

Consumer Insights
Uncover trends and behaviors shaping consumer choices today
Procurement Insights
Optimize your sourcing strategy with key market data
Industry Stats
Stay ahead with the latest trends and market analysis.
The global juicer market, valued at USD 3.45 Billion in 2025, has seen substantial growth, driven by the increasing demand for easy access to fresh, nutrient-packed fruit and vegetable juices that promote healthy living. The market is expected to grow at a compound annual growth rate (CAGR) of 8.70% from 2026 to 2035, potentially reaching USD 7.95 Billion by 2035, enabling consumers to effortlessly incorporate health-conscious drinks into their daily routines.
The Australian Bureau of Statistics (ABS) reported that the value of Australian fruit production (excluding wine grapes) was USD 6.3 billion in 2022-23, with total sales reaching 2.7 million tonnes. This robust output supports the juicer market by supplying fresh fruit for juicing.
According to industry reports, India fruit production was estimated at 110.21 million tonnes in 2022-23, with increased yields in apples, bananas, grapes, mangoes, and watermelons. This growth enhances the availability of fresh ingredients, benefiting the market.
The USDA reported that global apple production reached 82.31 million metric tonnes in 2022-23. As apples are a key ingredient for juicing, this large yield supports the juicer market, ensuring a reliable supply of apples for both local and global markets.
Compound Annual Growth Rate
8.7%
Value in USD Billion
2026-2035
| Global Juicer Market Report Summary | Description | Value |
| Base Year | USD Billion | 2025 |
| Historical Period | USD Billion | 2019-2025 |
| Forecast Period | USD Billion | 2026-2035 |
| Market Size 2025 | USD Billion | 3.45 |
| Market Size 2035 | USD Billion | 7.95 |
| CAGR 2019-2025 | Percentage | XX% |
| CAGR 2026-2035 | Percentage | 8.70% |
| CAGR 2026-2035 - Market by Region | Asia Pacific | 10.6% |
| CAGR 2026-2035 - Market by Country | India | 12.2% |
| CAGR 2026-2035 - Market by Country | China | 10.2% |
| CAGR 2026-2035 - Market by Product | Masticating Juicer | 9.7% |
| CAGR 2026-2035 - Market by End Use | Residential | 10.1% |
| Market Share by Country 2025 | India | 3.8% |
The growth of the juicer market is driven by its promotion of health, offering easy access to fresh, nutrient-packed juices. Juicers provide convenience, making it simple to consume fruits and vegetables daily. They allow for customised nutrition, such as detox or energy-boosting blends, while also supporting weight management. Moreover, they help boost vitamin intake and improve digestion. According to the USDA, the total export value of United States fruit and vegetable juices in 2023 was USD 977.27 million, with a three-year average of USD 931.08 million.
Read more about this report - REQUEST FREE SAMPLE COPY IN PDF
Fresh juices naturally enhance energy levels without the need for caffeine or sugar, while also supporting immune function due to their high Vitamin C content. Additionally, they promote better skin health by offering antioxidants and hydration, further driving the demand of the juicer market. Their popularity has surged, driven by the increasing global focus on healthy living and wellness trends.


The juicer market is expanding driven by the growing demand for health-conscious consumer trends, the increasing popularity of cold-pressed juices, as well as a shift towards sustainability and eco-friendly practices.
Xiaomi launched the Mijia Portable Juicer Cup 2, featuring 40-second juice extraction, a 19,500 RPM motor, and a 1300mAh battery for 12 uses per charge. Priced at 99 Yuan, it offers wireless portability, ice-crushing capability, auto-cleaning, and leak-proof design, with safety features like temperature control and charge protection.
iSqueeze launched the Citrocasa XPro, a multifruit juice machine capable of extracting juice from various fruits, including oranges and grapefruits. The machine features a slim design, responsive touchscreen, and easy assembly with fewer parts. It promotes health by using whole fruits, without preservatives or sweeteners, supporting the UK's growing health-conscious market.
HUROM, the creator of the slow juicer, launched its new H320 Slow Juicer, expanding its range of quality appliances. The juicer features a 2L self-feeding hopper, an automatic cutting function, and a low pulp juicing mechanism. The H320 uses slow squeeze technology to extract nutrients efficiently, providing a smooth juice.
Kuvings launched the Chef CB1000 Commercial Auto & Vacuum Blender and a new Whole Slow Juicer. The CB1000 features the world's first automatic opening and closing function, enhancing convenience for café workers. It creates a vacuum to preserve the freshness, texture, and nutrients of smoothies and juices.
The global market is benefitting from the rising trend towards health and wellness. Consumers are increasingly opting for fresh, natural juices to enhance their diets and wellbeing, which is fuelling demand for juicers that offer easy access to nutritious beverages, promoting market growth and innovation. In September 2022, Magic Bullet® introduced the Mini Juicer, a compact, affordable, and user-friendly appliance designed for quick and mess-free juicing. It features a 400-watt motor, a 2-inch feed chute, and a 52-oz pulp bin, along with a silicone spout cap, a 16-oz to-go cup, and dishwasher-safe attachments for easy cleaning and storage.
Cold-pressed juicers have gained traction for their ability to preserve more nutrients and enzymes, offering a healthier, more natural product. This trend, driven by rising consumer demand for premium, nutrient-dense beverages, is encouraging manufacturers to innovate and develop more efficient cold-press models. In April 2024, Pluckk, a digital fresh food brand, launched a line of preservative-free cold-pressed juices, responding to the increasing demand for health-conscious products. The range includes flavours like Mango and Pomegranate, made from 100% fruit with no added sugar, and boasts a 21-day shelf life using HPP technology.
The rise of smart juicers incorporating features such as app integration, touchscreens, and automated settings is a significant trend in the juicer market. These innovations enhance convenience and appeal to tech-savvy consumers, making the juicing process more accessible and user-friendly. In July 2022, Hazel Quinn introduced the world’s first true filter-free slow juicer with six patented technologies, offering efficient extraction, fibre-rich pulp, and optimal nutrition, while simplifying usage and cleaning. It is available for pre-sale on platforms like Indiegogo and Kickstarter.
Sustainability is increasingly influencing the market, with brands prioritising eco-friendly materials and energy-efficient machines. As consumers grow more environmentally aware, juicer manufacturers are responding by using recyclable materials, reducing packaging waste, and creating environmentally conscious products. In August 2024, two Japanese vending machines, “Feed ME Orange” and “IJOOZ,” became popular by offering fresh, 100% pure orange juice from seasonal, additive-free oranges.
Juicers are becoming more popular as they seamlessly fit into busy lifestyles, providing a quick and convenient way to enjoy health-focused drinks daily, which is positively impacting the juicer market revenue. They cater to various dietary needs, such as vegan and gluten-free preferences, while many models are designed with eco-friendly materials to reduce food waste. According to the USDA's Citrus Annual report, Australia's citrus production for 2024/25 is benefiting from favourable early conditions and expanded production areas, with orange production set to rise by 5%, reaching 545,000 metric tons—the highest in two decades.
The demand for the juicer market is rising, as home juicing offers cost savings in comparison to buying pre-packaged juices. Manufacturers have introduced options with features like easy cleaning and quiet operation. Additionally, juices, particularly those with high water content, support hydration, while the market continues to focus on sustainable sourcing and packaging, enhancing global accessibility.
Read more about this report - REQUEST FREE SAMPLE COPY IN PDF
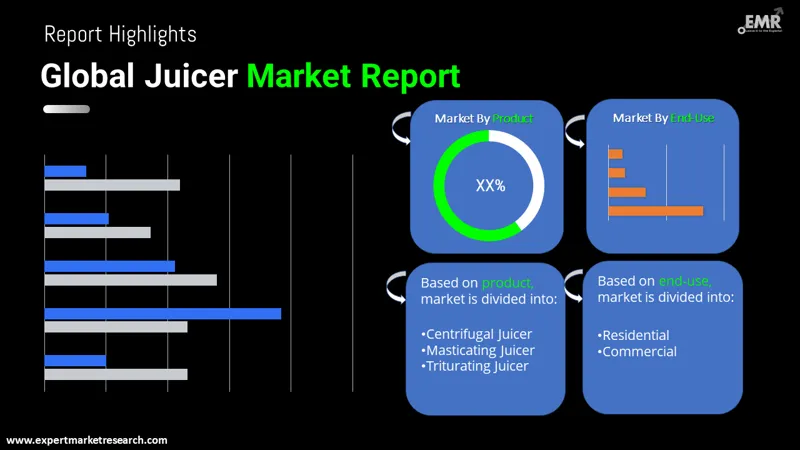
The EMR’s report titled “Global Juicer Market Report and Forecast 2026-2035” offers a detailed analysis of the market based on the following segments:
Market Breakup by Product
Market Breakup by End Use
Market Breakup by Region
| CAGR 2026-2035 - Market by | Country |
| India | 12.2% |
| China | 10.2% |
| Canada | 8.7% |
| Germany | 7.6% |
| France | 7.2% |
| USA | XX% |
| UK | XX% |
| Italy | XX% |
| Japan | 6.3% |
| Australia | XX% |
| Saudi Arabia | XX% |
| Brazil | XX% |
| Mexico | XX% |
According to the juicer market analysis, the market is led by residential juicers, catering to health-conscious consumers who seek quick, easy access to fresh, nutrient-dense juices at home. These juicers provide a cost-effective alternative to store-bought juices and support personalised nutrition tailored to various diets, including vegan and gluten-free. They also promote healthier lifestyle choices. In April 2024, Hurom launched the H70 Easy Clean Slow Juicer, designed to fit on kitchen countertops. With patented Slow Squeeze Technology at 70 RPM, it preserves nutrients and flavour, while its self-feeding hopper and two-part auger optimise juice yield, reducing pulp. The juicer also features an easy-clean chamber with detachable, user-friendly parts for simple maintenance.
The juicer market growth is boosted due to the rising demand for commercial juicers, particularly in cafes, restaurants, and juice bars, where fresh, high-quality beverages are in high demand. These juicers enable efficient, high-volume production with minimal waste, catering to the growing trend for health-conscious options. Businesses benefit from offering nutritious drinks to attract health-focused customers, helping them remain competitive. To tackle food waste, in November 2022, Spain introduced the Food Waste Law, with the UN FAO estimating that 30% of global food is wasted. ZUMEX® contributes by offering juicing solutions that reduce waste by turning "ugly" produce into juice. Their solutions help retailers, restaurants, and schools comply with sustainability regulations and promote responsible consumption practices.
The juicer market key players are renowned for their innovative, high-quality kitchen appliances. Initially known for food processors, these brands have expanded their product range to include juicers, blenders, coffee makers, and grills. Known for reliability and performance, they offer products that combine cutting-edge technology with sleek, user-friendly designs, making cooking and meal preparation more efficient and enjoyable. Their commitment to excellence has established them as trusted names worldwide.
Headquartered in Sydney, Australia, Breville Group Ltd. was established in 1932. Known for its innovative kitchen appliances, Breville has built a global reputation for producing high-quality juicers, coffee makers, and other cooking equipment, offering convenience and advanced technology to enhance everyday cooking and food preparation.
Founded in 1971 and headquartered in Connecticut, United States, Cuisinart is renowned for its high-quality kitchen appliances, including food processors, blenders, and juicers. The company has consistently focused on innovation and reliability, offering both professional-grade and home-use products that help consumers prepare meals with ease and efficiency.
Established in 1910 and based in Virginia, United States, Hamilton Beach Brands Holding Co. has been a leading manufacturer of household appliances. The company’s extensive product range includes juicers, blenders, coffee makers, and more, with a focus on providing affordable, practical solutions for everyday home cooking needs.
Headquartered in Amsterdam, Netherlands, Koninklijke Philips NV was founded in 1891. Philips is a global leader in health technology, home appliances, and electronics. With a diverse product portfolio, including juicers, Philips aims to improve people's lives through meaningful innovation, providing consumers with high-performance, energy-efficient appliances.
*Please note that this is only a partial list; the complete list of key players is available in the full report. Additionally, the list of key players can be customized to better suit your needs.*
Another key player in the juicer market report is Kuvings SNS among others.
Upto 15% Off
USD
$2499 $2249
$3999 $3599
$4999 $4249
$5999 $5099


*While we strive to always give you current and accurate information, the numbers depicted on the website are indicative and may differ from the actual numbers in the main report. At Expert Market Research, we aim to bring you the latest insights and trends in the market. Using our analyses and forecasts, stakeholders can understand the market dynamics, navigate challenges, and capitalize on opportunities to make data-driven strategic decisions.*
The market is assessed to grow at a CAGR of 8.70% between 2026 and 2035.
The industry is being driven by the consumers' inclination towards fresh fruit and vegetable juices over packaged juices, increase in the number of juice outlets and shops, rising urbanisation, changing lifestyle, rise in the number of health awareness campaigns and high disposable income.
The key industry trends augmenting the industry’s expansion are the rising demand for shorter preparation time and minimal effort while making juice and rising health concerns.
The major regions in the industry are North America, Latin America, Europe, the Middle East and Africa, and the Asia Pacific.
The various products in the industry are centrifugal juicer, masticating juicer, and triturating juicer.
Residential and commercial segments are the end-uses of the industry.
The major players in the industry are Breville Group Ltd., Cuisinart, Hamilton Beach Brands, Inc, Koninklijke Philips NV, and Kuvings SNS, among others.
In 2025, the juicer market reached an approximate value of USD 3.45 Billion.
The market is estimated to witness healthy growth in the forecast period of 2026-2035 to reach a value of around USD 7.95 Billion by 2035.
Explore our key highlights of the report and gain a concise overview of key findings, trends, and actionable insights that will empower your strategic decisions.
| REPORT FEATURES | DETAILS |
| Base Year | 2025 |
| Historical Period | 2019-2025 |
| Forecast Period | 2026-2035 |
| Scope of the Report |
Historical and Forecast Trends, Industry Drivers and Constraints, Historical and Forecast Market Analysis by Segment:
|
| Breakup by Product |
|
| Breakup by End Use |
|
| Breakup by Region |
|
| Market Dynamics |
|
| Competitive Landscape |
|
| Companies Covered |
|
| Report Price and Purchase Option | Explore our purchase options that are best suited to your resources and industry needs. |
| Delivery Format | Delivered as an attached PDF and Excel through email, with an option of receiving an editable PPT, according to the purchase option. |
Datasheet
One User
USD 2,499
USD 2,249
tax inclusive*
Single User License
One User
USD 3,999
USD 3,599
tax inclusive*
Five User License
Five User
USD 4,999
USD 4,249
tax inclusive*
Corporate License
Unlimited Users
USD 5,999
USD 5,099
tax inclusive*
*Please note that the prices mentioned below are starting prices for each bundle type. Kindly contact our team for further details.*
Flash Bundle
Small Business Bundle
Growth Bundle
Enterprise Bundle
*Please note that the prices mentioned below are starting prices for each bundle type. Kindly contact our team for further details.*
Flash Bundle
Number of Reports: 3
20%
tax inclusive*
Small Business Bundle
Number of Reports: 5
25%
tax inclusive*
Growth Bundle
Number of Reports: 8
30%
tax inclusive*
Enterprise Bundle
Number of Reports: 10
35%
tax inclusive*
How To Order

Select License Type
Choose the right license for your needs and access rights.

Click on ‘Buy Now’
Add the report to your cart with one click and proceed to register.

Select Mode of Payment
Choose a payment option for a secure checkout. You will be redirected accordingly.
Strategic Solutions for Informed Decision-Making
Gain insights to stay ahead and seize opportunities.

Get insights & trends for a competitive edge.

Track prices with detailed trend reports.

Analyse trade data for supply chain insights.

Leverage cost reports for smart savings

Enhance supply chain with partnerships.

Connect For More Information
Our expert team of analysts will offer full support and resolve any queries regarding the report, before and after the purchase.
Our expert team of analysts will offer full support and resolve any queries regarding the report, before and after the purchase.
We employ meticulous research methods, blending advanced analytics and expert insights to deliver accurate, actionable industry intelligence, staying ahead of competitors.
Our skilled analysts offer unparalleled competitive advantage with detailed insights on current and emerging markets, ensuring your strategic edge.
We offer an in-depth yet simplified presentation of industry insights and analysis to meet your specific requirements effectively.


