

Consumer Insights
Uncover trends and behaviors shaping consumer choices today
Procurement Insights
Optimize your sourcing strategy with key market data
Industry Stats
Stay ahead with the latest trends and market analysis.
The global micronutrient fertilizers market was valued at USD 3.05 Billion in 2025. The market is expected to grow at a CAGR of 8.20% during the forecast period of 2026-2035 to reach a value of USD 6.71 Billion by 2035. Growing awareness regarding soil health and balanced crop nutrition is driving the demand in the market.
Compound Annual Growth Rate
8.2%
Value in USD Billion
2026-2035
Micronutrient fertilizers refer to specialised fertilizers that contain micronutrients that help crop growth and plant processes. Common nutrients in micronutrient fertilizers include zinc, boron, manganese, copper, and iron. The micronutrient fertilizers can be applied directly on soil or foliar, or through the process of fertigation.
Read more about this report - REQUEST FREE SAMPLE COPY IN PDF
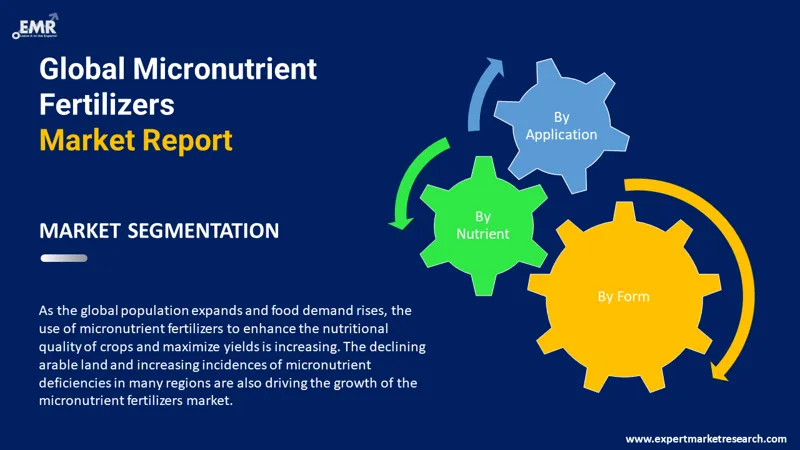
The EMR’s report titled “Micronutrient Fertilizers Market Report and Forecast 2026-2035 offers a detailed analysis of the market based on the following segments:
Market Breakup by Nutrient
Market Breakup by Form
Market Breakup by Application
Market Breakup by Crop Type
Market Breakup by Region
Read more about this report - REQUEST FREE SAMPLE COPY IN PDF
Zinc is anticipated to account for a sizable share of the micronutrient fertilizers market due to the desire to improve soil health and fertility as well as the rising understanding of zinc's benefits in improving crop production and quality. Also, zinc is considered to be an essential element which is required for the proper growth and development of plants. Crops that are zinc deficient may grow slower, yield less, and be of poor quality. Over the forecast period, the market for zinc micronutrient fertilizers is anticipated to grow as a consequence of the rising consumption of cereal-based food that is low in zinc content.


Asia Pacific is expected to witness significant growth in the global market for micronutrients fertilizers. The market for different micronutrient fertiliser products in the region is boosted by the well-established distribution network of micronutrient fertilizers in major Asia Pacific countries, including China and India. The micronutrient fertilizers market expansion in the region is also being propelled by the rising demand for food grains to meet the needs of large populations and the depletion of soil nutrients. Increasing awareness regarding the micronutrient requirements of various crops is further increasing the demand for micronutrient fertilizers in the Asia Pacific.
The comprehensive EMR report provides an in-depth assessment of the market based on Porter's five forces model, along with giving a SWOT analysis. The report gives a detailed analysis of the following key players in the global micronutrient fertilizers market, covering their competitive landscape and the latest developments like mergers, acquisitions, investments, and expansion plans.
Yara International ASA, founded in 1905 and headquartered in Oslo, Norway, deals with the production and distribution of nitrogen-based mineral fertilizers and associated industrial goods. The company also produces nitrates, ammonia, urea, and other nitrogen-based substances.
Haifa Negev technologies LTD, established in 1966 and headquartered in Haifa, Israel, is an international company and a leading provider of specialised fertilizers, such as agricultural and industrial grade potassium nitrate. Additionally, the company develops and produces a large variety of specialised fertilizers.
Coromandel International Limited, founded in 1961 and based in Telangana, India, is a leading producer of phosphatic fertiliser in India. The company operates in the business sectors of fertilizers, specialty nutrients, crop protection, and retail.
*Please note that this is only a partial list; the complete list of key players is available in the full report. Additionally, the list of key players can be customized to better suit your needs.*
Other market players include UPL LTD, BASF SE, and Israel Chemicals Ltd., among others.
Upto 15% Off
USD
$3999 $3599
$2499 $2249
$4999 $4249
$5999 $5099


*While we strive to always give you current and accurate information, the numbers depicted on the website are indicative and may differ from the actual numbers in the main report. At Expert Market Research, we aim to bring you the latest insights and trends in the market. Using our analyses and forecasts, stakeholders can understand the market dynamics, navigate challenges, and capitalize on opportunities to make data-driven strategic decisions.*
The market is projected to grow at a CAGR of 8.20% between 2026 and 2035.
The major market drivers include the declining arable land, rising demand for food, increasing soil and plant tissue testing, and increasing importance of micronutrients for plant growth.
The key trends guiding the growth of the market include the rising adoption of precision agriculture, development of specialised micronutrient fertilizers, and government initiatives to promote the use of micronutrient fertilizers.
The major regions in the market are North America, Europe, the Asia Pacific, Latin America, and the Middle East and Africa.
The different nutrients in the market for micronutrient fertilizers are zinc, manganese, copper, boron, molybdenum, and iron, among others.
The various applications of micronutrient fertilizers in the market include soil, foliar, and fertigation, among others.
The major market players, according to the report, are Yara International ASA, Haifa Negev technologies LTD, Coromandel International Limited, UPL LTD, BASF SE, and Israel Chemicals Ltd., among others.
In 2025, the global micronutrient fertilizers market reached an approximate value of USD 3.05 Billion.
The market is expected to register consistent growth and reach USD 6.71 Billion by 2035.
Explore our key highlights of the report and gain a concise overview of key findings, trends, and actionable insights that will empower your strategic decisions.
| REPORT FEATURES | DETAILS |
| Base Year | 2025 |
| Historical Period | 2019-2025 |
| Forecast Period | 2026-2035 |
| Scope of the Report |
Historical and Forecast Trends, Industry Drivers and Constraints, Historical and Forecast Market Analysis by Segment:
|
| Breakup by Nutrient |
|
| Breakup by Form |
|
| Breakup by Application |
|
| Breakup by Crop Type |
|
| Breakup by Region |
|
| Market Dynamics |
|
| Competitive Landscape |
|
| Companies Covered |
|
| Report Price and Purchase Option | Explore our purchase options that are best suited to your resources and industry needs. |
| Delivery Format | Delivered as an attached PDF and Excel through email, with an option of receiving an editable PPT, according to the purchase option. |
Single User License
One User
USD 3,999
USD 3,599
tax inclusive*
Datasheet
One User
USD 2,499
USD 2,249
tax inclusive*
Five User License
Five User
USD 4,999
USD 4,249
tax inclusive*
Corporate License
Unlimited Users
USD 5,999
USD 5,099
tax inclusive*
*Please note that the prices mentioned below are starting prices for each bundle type. Kindly contact our team for further details.*
Flash Bundle
Small Business Bundle
Growth Bundle
Enterprise Bundle
*Please note that the prices mentioned below are starting prices for each bundle type. Kindly contact our team for further details.*
Flash Bundle
Number of Reports: 3
20%
tax inclusive*
Small Business Bundle
Number of Reports: 5
25%
tax inclusive*
Growth Bundle
Number of Reports: 8
30%
tax inclusive*
Enterprise Bundle
Number of Reports: 10
35%
tax inclusive*
How To Order

Select License Type
Choose the right license for your needs and access rights.

Click on ‘Buy Now’
Add the report to your cart with one click and proceed to register.

Select Mode of Payment
Choose a payment option for a secure checkout. You will be redirected accordingly.
Strategic Solutions for Informed Decision-Making
Gain insights to stay ahead and seize opportunities.

Get insights & trends for a competitive edge.

Track prices with detailed trend reports.

Analyse trade data for supply chain insights.

Leverage cost reports for smart savings

Enhance supply chain with partnerships.

Connect For More Information
Our expert team of analysts will offer full support and resolve any queries regarding the report, before and after the purchase.
Our expert team of analysts will offer full support and resolve any queries regarding the report, before and after the purchase.
We employ meticulous research methods, blending advanced analytics and expert insights to deliver accurate, actionable industry intelligence, staying ahead of competitors.
Our skilled analysts offer unparalleled competitive advantage with detailed insights on current and emerging markets, ensuring your strategic edge.
We offer an in-depth yet simplified presentation of industry insights and analysis to meet your specific requirements effectively.


