

Consumer Insights
Uncover trends and behaviors shaping consumer choices today
Procurement Insights
Optimize your sourcing strategy with key market data
Industry Stats
Stay ahead with the latest trends and market analysis.
The global mobile application market size reached a value of USD 259.37 Billion in 2025. During the forecast period of 2026 and 2035, the market is expected to grow at a CAGR of 14.10% to reach a value of around USD 970.01 Billion by 2035. The surge in mobile app demand is driven by digital transformation, user convenience, and growing app-based services across industries. As businesses prioritize mobile-first strategies and users seek seamless digital experiences, the market is set for robust expansion in the coming years.
Compound Annual Growth Rate
14.1%
Value in USD Billion
2026-2035
| Global Mobile Application Market Report Summary | Description | Value |
| Base Year | USD Billion | 2025 |
| Historical Period | USD Billion | 2019-2025 |
| Forecast Period | USD Billion | 2026-2035 |
| Market Size 2025 | USD Billion | 259.37 |
| Market Size 2035 | USD Billion | 970.01 |
| CAGR 2019-2025 | Percentage | XX% |
| CAGR 2026-2035 | Percentage | 14.10% |
| CAGR 2026-2035 - Market by Region | Asia Pacific | 16.3% |
| CAGR 2026-2035 - Market by Country | India | 17.6% |
| CAGR 2026-2035 - Market by Country | Brazil | 16.7% |
| CAGR 2026-2035 - Market by Platform | Google Store | 15.8% |
| CAGR 2026-2035 - Market by App Category | Gaming | 16.1% |
| Market Share by Country 2025 | Japan | 4.5% |
Software applications that run on or are created for smartphones, tablets, and computer tablets are known as mobile applications. Similar services to those offered by computer-based apps are also offered by mobile applications, but suited for the screen size and interface of mobile devices. There are many programmes available for various platforms, including Android, iOS, Windows, and others.
Read more about this report - REQUEST FREE SAMPLE COPY IN PDF
The EMR’s report titled “Mobile Application Market Report and Forecast 2026-2035" offers a detailed analysis of the market based on the following segments:
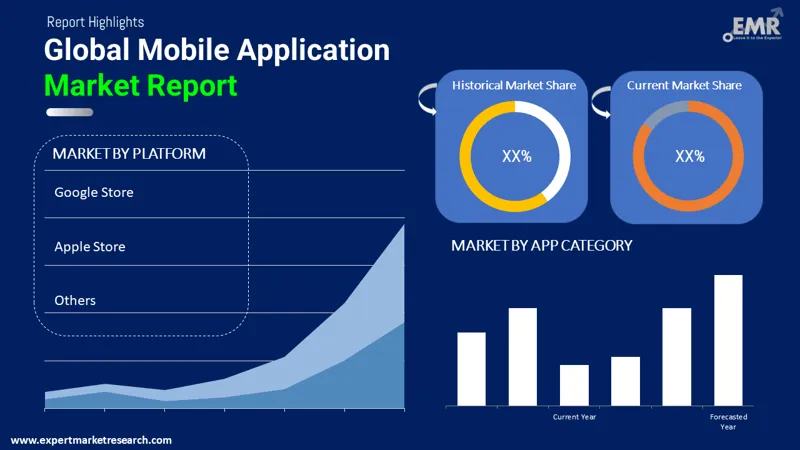
Market Breakup by Platform
Market Breakup by App Category
Market Breakup by Region
Read more about this report - REQUEST FREE SAMPLE COPY IN PDF
During the forecast period, it is anticipated that the Apple Store segment would account for the largest mobile application market share. The significant share of the segment can be largely ascribed to iOS apps' considerably greater rate of monetisation for revenue from in-app purchases and premium apps. Additionally, the growing number of iPhone and iPad users worldwide is projected to support the segment's expansion.
Meanwhile, the Google Play Store category accounted for the highest share in terms of downloads in 2021 and is anticipated to maintain its leadership throughout the forecast period. Additionally, sales of Android smartphones have increased significantly over the past several years, with numerous new competitors such as Xiaomi Corporation and OnePlus challenging the established and dominant giants like Samsung and iPhone.
A broad variety of mobile applications have been released on Google Play Store as a result of the development of new Android smartphone manufacturers. A large user base and the release of a variety of mobile applications indicate that the Google Play store will continue to grow rapidly over the forecast period.


North America is anticipated to dominate the mobile application market due to the concentration of many leading companies, including Apple Inc., Hewlett Packard Enterprise, Google LLC, Netflix Inc., and Microsoft Corporation in the region. The extensive usage of smartphones, rising in-app consumer spending, and significantly more smartphone application downloads all contribute to a considerable market share. In terms of paid mobile games, in-app purchases, and a rapidly expanding mobile app user base, the United States is predicted to develop into a very lucrative market for mobile gaming applications.
| CAGR 2026-2035 - Market by | Country |
| India | 17.6% |
| Brazil | 16.7% |
| China | 15.6% |
| UK | 12.9% |
| USA | 12.6% |
| Canada | XX% |
| Germany | 11.6% |
| France | XX% |
| Italy | XX% |
| Australia | XX% |
| Saudi Arabia | XX% |
| Mexico | XX% |
| Japan | 9.7% |
The Asia Pacific area is expected to experience the fastest growth given its potential for internet adoption and smartphone usage. According to estimates, China and India will remain the two biggest markets, offering excellent growth opportunities for all participants in the mobile application ecosystem.
Furthermore, it is projected that the growth of the market for mobile applications will be positively impacted in the years to come by increased disposable income along with government initiatives like Digital India. Additionally, networking advancements and the accessibility of low-cost data consumption packs are important growth drivers for regional expansion.
The comprehensive EMR report offers a detailed analysis of the market based on a SWOT analysis and Porter's five forces model. The following top players in the global mobile application market are thoroughly analysed in the study, along with their competitive landscape and recent developments such as mergers, acquisitions, investments, and expansion plans.
Google LLC, a subsidiary of Alphabet Inc. with its main office in California in the United States, offers internet search and advertising services. The company focuses on enterprise and hardware products, advertising, search engines, platforms, and operating systems.
Apple Inc., an American technology business, was established in April 1976 by Steve Jobs, Steve Wozniak, and Ronald Wayne. The company expanded into various consumer electronics categories over time, including mobile communication devices, notebooks, wearable technology, and digital music players. The firm also creates and sells a variety of complementary software, services, and networking solutions.
Alibaba Group offers e-commerce and IT infrastructure services. Thanks to the company's basic technical backbone services, businesses, brands, retailers, and merchants can market, sell, and operate online. Its businesses include traditional commercial operations, digital media and entertainment, cloud computing, and various innovation projects.
*Please note that this is only a partial list; the complete list of key players is available in the full report. Additionally, the list of key players can be customized to better suit your needs.*
Other market players are Microsoft Corporation, Meta Platforms, Inc., Amazon.com, Inc., IBM Corporation, Cognizant Technology Solutions Corporation, Gameloft SE, and Hewlett Packard Enterprise Development LP, among others.
Upto 15% Off
USD
$2499 $2249
$3999 $3599
$4999 $4249
$5999 $5099


*While we strive to always give you current and accurate information, the numbers depicted on the website are indicative and may differ from the actual numbers in the main report. At Expert Market Research, we aim to bring you the latest insights and trends in the market. Using our analyses and forecasts, stakeholders can understand the market dynamics, navigate challenges, and capitalize on opportunities to make data-driven strategic decisions.*
In 2025, the global market for mobile applications attained a value of nearly USD 259.37 Billion.
The global market for mobile applications is projected to grow at a CAGR of 14.10% between 2026 and 2035.
The market is estimated to witness a healthy growth in the forecast period of 2026-2035 to reach USD 970.01 Billion by 2035.
The major drivers of the market include the rising use of virtual reality and augmented reality, increase in the demand for gaming applications, an increase in the availability of low-cost data plans from telecom operators, and a rise in the research and investments.
Rise in internet usage and increasing use of smartphones are the key industry trends propelling the growth of the market.
The key players in the global mobile application market are Google LLC, Apple Inc., Microsoft Corporation, Meta Platforms, Inc., Amazon.com, Inc., IBM Corporation, Cognizant Technology Solutions Corporation, Gameloft SE, Alibaba Group, and Hewlett Packard Enterprise Development LP, among others.
Mobile apps are designed for hands-on interaction and give consumers convenient, real-time access to the information, goods, services, and procedures they require.
Mobile applications are designed for use on mobile devices like phones and tablets which have different interfaces and can have restrictions on connectivity and storage. A desktop application is designed for usage on desktop computer or laptops, which typically have larger storage, bigger screens, and lack of touch screen inputs.
The four different categories of application components are activities, services, broadcast receivers, and content providers.
Explore our key highlights of the report and gain a concise overview of key findings, trends, and actionable insights that will empower your strategic decisions.
| REPORT FEATURES | DETAILS |
| Base Year | 2025 |
| Historical Period | 2019-2025 |
| Forecast Period | 2026-2035 |
| Scope of the Report |
Historical and Forecast Trends, Industry Drivers and Constraints, Historical and Forecast Market Analysis by Segment:
|
| Breakup by Platform |
|
| Breakup by App Category |
|
| Breakup by Region |
|
| Market Dynamics |
|
| Competitive Landscape |
|
| Companies Covered |
|
Datasheet
One User
USD 2,499
USD 2,249
tax inclusive*
Single User License
One User
USD 3,999
USD 3,599
tax inclusive*
Five User License
Five User
USD 4,999
USD 4,249
tax inclusive*
Corporate License
Unlimited Users
USD 5,999
USD 5,099
tax inclusive*
*Please note that the prices mentioned below are starting prices for each bundle type. Kindly contact our team for further details.*
Flash Bundle
Small Business Bundle
Growth Bundle
Enterprise Bundle
*Please note that the prices mentioned below are starting prices for each bundle type. Kindly contact our team for further details.*
Flash Bundle
Number of Reports: 3
20%
tax inclusive*
Small Business Bundle
Number of Reports: 5
25%
tax inclusive*
Growth Bundle
Number of Reports: 8
30%
tax inclusive*
Enterprise Bundle
Number of Reports: 10
35%
tax inclusive*
How To Order

Select License Type
Choose the right license for your needs and access rights.

Click on ‘Buy Now’
Add the report to your cart with one click and proceed to register.

Select Mode of Payment
Choose a payment option for a secure checkout. You will be redirected accordingly.
Strategic Solutions for Informed Decision-Making
Gain insights to stay ahead and seize opportunities.

Get insights & trends for a competitive edge.

Track prices with detailed trend reports.

Analyse trade data for supply chain insights.

Leverage cost reports for smart savings

Enhance supply chain with partnerships.

Connect For More Information
Our expert team of analysts will offer full support and resolve any queries regarding the report, before and after the purchase.
Our expert team of analysts will offer full support and resolve any queries regarding the report, before and after the purchase.
We employ meticulous research methods, blending advanced analytics and expert insights to deliver accurate, actionable industry intelligence, staying ahead of competitors.
Our skilled analysts offer unparalleled competitive advantage with detailed insights on current and emerging markets, ensuring your strategic edge.
We offer an in-depth yet simplified presentation of industry insights and analysis to meet your specific requirements effectively.


