

Consumer Insights
Uncover trends and behaviors shaping consumer choices today
Procurement Insights
Optimize your sourcing strategy with key market data
Industry Stats
Stay ahead with the latest trends and market analysis.
The global pH sensors market reached a value of nearly USD 1.25 Billion in 2025. The market is further estimated to grow in the forecast period of 2026-2035 at a CAGR of 6.30% to reach about USD 2.30 Billion by 2035.
Overview: The Iran-US-Israel war that escalated in Q1 2026 left a clear mark on the ph sensors sector. PH sensors, electrochemical sensors measuring hydrogen ion concentration in aqueous solutions, are critical process quality control instruments in pharmaceutical manufacturing, water treatment, food and beverage production, and chemical processing. The conflict's effects on industrial chemical production, including petrochemical feedstock availability and water treatment chemical supply, created process monitoring demand for precise pH measurement.
United States: US Ph sensor demand through Q1 2026 was maintained across pharmaceutical manufacturing quality control, with bioreactor pH monitoring, buffer preparation verification, and cleanroom water system pH management consuming analytical and process pH sensors. US water treatment, for municipal drinking water and industrial wastewater compliance monitoring, maintained pH sensor procurement as utilities managed elevated water treatment chemical costs from Q1 2026 supply chain disruption. Industrial chemical manufacturing pH monitoring, for chemical synthesis, neutralization, and quality verification, maintained process instrumentation demand across the US chemical industry.
Iran: Iran's market activity remained severely constrained throughout Q1 2026. Comprehensive OFAC sanctions under 31 C.F.R. Part 560 and conflict-related strikes across 26 provinces (ACLED, March 2026) prohibited all commercial engagement with Iranian entities.
Israel: Within the conflict region itself, Gulf state petrochemical and water treatment facilities, operating at elevated throughput, maintained pH sensor procurement for process control and environmental compliance monitoring. Food and beverage manufacturing globally maintained standard pH monitoring procurement for product quality and safety verification.
Government & Policy Watch
Market & Industry Impact
Procurement & Supply Chain Alert
pH sensors are widely used in industries like water treatment, agriculture, and medicine to monitor and control acid levels.
The response time of pH sensors is usually less than 1 minute. This allows for rapid measurement of pH changes.
Research and development in pH sensor technology include innovative approaches like a flexible optical pH sensor based on polysulfone (PSU) and polyaniline (PANI), offering new possibilities for pH measurement in diverse applications.
Compound Annual Growth Rate
6.3%
Value in USD Billion
2026-2035
A vital tool, pH sensors are usually utilised for water measurements. Such sort of a sensor can examine and identify the amount of acidity and alkalinity in water. When utilised correctly, suitable pH sensors can confirm the safety and quality of an aqueous product. It also verifies the quality and safety of procedures that take place within manufacturing or wastewater plants.
The factors favourably impacting pH sensors market outlook include stringent environmental protection regulations mandating the use of pH sensors in various industries, advancements in sensor technology leading to the development of robust and cost-effective pH sensors, and the rising adoption of Internet of Things (IoT) devices and automated monitoring systems. These factors have been instrumental in driving the demand for pH sensors globally, particularly in industries such as food and beverages, medical, biotechnology, and paper and pulp.
Read more about this report - REQUEST FREE SAMPLE COPY IN PDF
Increasing automation in water and chemicals industry, advancements in sensor technology, and rising focus on preventive care in healthcare sector have augmented the pH sensors market growth
ABB acquired Real Tech, a Canadian optical sensor company, to enhance its smart water management solutions. This acquisition strengthens ABB's position in the water segment and aligns with the growing demand for sustainable water management solutions.
Aquatic Informatics acquired Sedaru, a leading water utility management software provider, joining Danaher's Water Quality platform. This acquisition aims to enhance water system operations and asset management with real-time network intelligence solutions.
Hach, a global water quality analysis leader, partnered with 120Water to offer Lead and Copper compliance solutions. This collaboration integrated 120Water's digital water platform with Hach's services, which enhanced drinking water compliance programs for utilities nationwide.
Technological innovations are enabling the development of smaller, more flexible pH sensors with IoT and AI capabilities. Process sensors are increasingly being used for continuous in-situ monitoring due to their fast response times, reliability in harsh conditions, and minimal maintenance needs.
The rise in industrial automation across the globe is a major driver for the pH sensors market expansion. pH sensors provide continuous data on acidity/alkalinity levels to optimise operations, control pollution, and ensure regulatory compliance.
pH sensors are seeing growing usage in medical diagnostics and point-of-care testing. They play a key role in measuring the acidity/alkalinity of bodily fluids and tissues to detect conditions like diabetes, kidney disease, and metabolic disorders. Increasing healthcare spending and focus on preventive care in developing nations is driving adoption of pH sensors in this sector.
The market is expected to witness robust growth due to the rising awareness about the harmful effects of acidic water produced from industrial units. The impact of basic or acidic water on pipelines and equipment like condensers and boilers, in the chemical, power, and oil and gas industries is further leading to pH sensors market development and technological advancements in the field.
Moreover, poor water quality generates health concerns, these include dullness of hair along with skin irritations such as itchiness and dryness. Poor water quality also impacts washing of clothes, resulting in quality degradation and roughness of clothing. These factors are likely to fuel the market demand for pH sensors over the coming years.
Read more about this report - REQUEST FREE SAMPLE COPY IN PDF
The EMR’s report titled “pH Sensors Market Report and Forecast 2026-2035” offers a detailed analysis of the market based on the following segments:
Market Breakup by Type
Breakup by Application
Breakup by Region
Benchtop analysers have a significant demand as they offer higher accuracy
Benchtop analysers are stationary pH sensors used in laboratories and research settings for precise pH measurements. They offer high accuracy and stability, making them ideal for industries like pharmaceuticals and biotechnology where meticulous pH monitoring is crucial.
Portable analysers are compact pH sensors designed for on-the-go pH monitoring in field applications. As per pH sensors market analysis, they provide flexibility and real-time data collection, making them suitable for environmental monitoring, water quality testing, and on-site industrial processes that require mobility and immediate pH analysis.
Process analysers, however, are integrated pH sensors for continuous monitoring in industrial processes. They offer reliability, robustness, and ensure real-time pH data for process optimisation in industries like water treatment and food processing.
Water and wastewater segment rely heavily on accurate pH measurements to satisfy mandated water standards
In water and wastewater applications, pH sensors are essential for monitoring pH levels and oxidation-reduction potential (ORP) in treatment plants. These sensors provide accurate readings crucial for maintaining water quality standards and ensuring effective treatment processes. The increasing use of pH sensors in water and wastewater applications reflects their significance in environmental protection and public health, driving pH sensors market growth.
Within the medical industry, pH sensors are integral to medical diagnostics, particularly in measuring acidity or alkalinity in bodily fluids and tissues to detect metabolic disorders and other health conditions. The adoption of pH sensors in the medical field contributes to improved patient care, diagnostic accuracy, and advancements in healthcare technology.


Asia Pacific to hold a significant share in the market of pH sensors driven by industrial development
The Asia Pacific region is likely to hold a significant share in the market on account of the increasing awareness of technological advancements. Additionally, emerging economies like China and India and rising innovations in the pharmaceutical and biotechnology industries are expected to increase pH sensors market share in the region. The surging awareness in the manufacturing industry and a rise in government initiatives for funding are also likely to fuel the market.
With the rise in infrastructure projects in China, there are various water reuse and wastewater treatment policies in place. These policies are increasing the demand for pH sensors and analysers in the country, further driving the market growth. Moreover, the expanding medical industries in the region are utilising personal medical instruments or personal sensors.
Meanwhile, in North America, the pH sensors market is driven by a strong emphasis on water quality for consumption and industrial use, supported by stringent environmental regulations. Key players like Thermo Fisher Scientific and Emerson Electric lead innovation in this region.
Market players are investing in advanced technologies and engaging in strategic partnerships to enhance accuracy and efficiency in pH measurement applications.
ABB Ltd. was founded in 1988 and is headquartered in Zurich, Switzerland. The company specialises in power and automation technologies, offering a range of products and services including pH sensors and analysers for sectors such as water/wastewater treatment, chemicals, and manufacturing.
Hach Company was established in 1947 and is based in Colorado, United States. Its product line includes pH meters and sensors designed for water treatment and environmental monitoring applications. Hach plays a vital role in ensuring the safety and compliance of water systems worldwide.
Thermo Fisher Scientific Inc., formed in 2006, headquartered in Massachusetts, United States, is a leading supplier of scientific instrumentation, reagents, and software for laboratory and process applications. It offers a comprehensive range of pH meters and sensors tailored for research, clinical, and industrial markets.
Mettler-Toledo, established in 1945 and based in Ohio, United States, specialises in precision instruments and services. The company provides a wide array of products, including pH meters and sensors for laboratory, industrial, and food retailing applications.
*Please note that this is only a partial list; the complete list of key players is available in the full report. Additionally, the list of key players can be customized to better suit your needs.*
Other key players in the global pH sensors market include PHionics Inc., and Endress+Hauser Group Services AG, and Honeywell International Inc., among others.
Upto 15% Off
USD
$3999 $3599
$2499 $2249
$4999 $4249
$5999 $5099


*While we strive to always give you current and accurate information, the numbers depicted on the website are indicative and may differ from the actual numbers in the main report. At Expert Market Research, we aim to bring you the latest insights and trends in the market. Using our analyses and forecasts, stakeholders can understand the market dynamics, navigate challenges, and capitalize on opportunities to make data-driven strategic decisions.*
In 2025, the pH sensors market reached an approximate value of USD 1.25 Billion.
The market is expected to grow at a CAGR of 6.30% between 2026 and 2035.
The market is estimated to witness a healthy growth in the forecast period of 2026-2035 to USD 2.30 Billion by 2035.
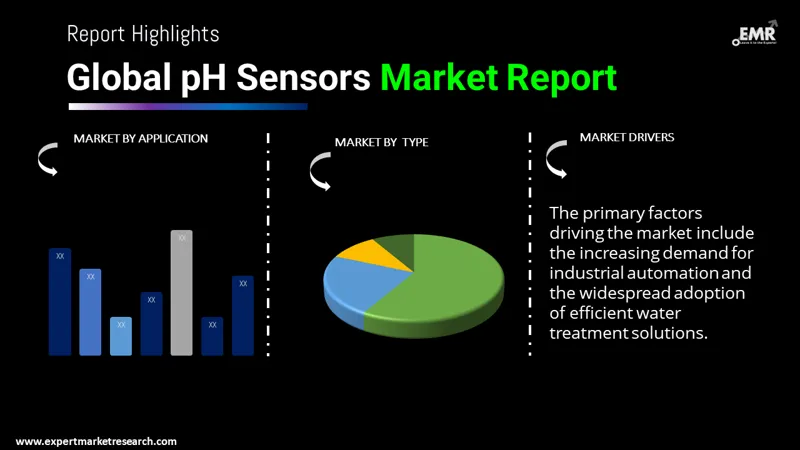
The major market drivers are the growing needs for industrial automation and the extensive adoption of effective water treatment solutions.
Key trends aiding market expansion include the emergence of the Internet of Things (IoT)-enabled digital pH sensors and technological advancements.
Regions considered in the market are North America, Europe, the Asia Pacific, Latin America, and the Middle East and Africa.
The various types of pH sensors in the market include benchtop analysers, portable analysers, and process analysers.
The various applications in the market include water and wastewater, medical, oil and gas, food and beverages, and industrial, among others.
Key players in the market are ABB Ltd., Hach Company, Thermo Fisher Scientific Inc., Mettler Toledo, PHionics Inc., and Endress+Hauser Group Services AG, and Honeywell International Inc., among others.
Explore our key highlights of the report and gain a concise overview of key findings, trends, and actionable insights that will empower your strategic decisions.
| REPORT FEATURES | DETAILS |
| Base Year | 2025 |
| Historical Period | 2019-2025 |
| Forecast Period | 2026-2035 |
| Scope of the Report |
Historical and Forecast Trends, Industry Drivers and Constraints, Historical and Forecast Market Analysis by Segment:
|
| Breakup by Type |
|
| Breakup by Application |
|
| Breakup by Region |
|
| Market Dynamics |
|
| Competitive Landscape |
|
| Companies Covered |
|
Single User License
One User
USD 3,999
USD 3,599
tax inclusive*
Datasheet
One User
USD 2,499
USD 2,249
tax inclusive*
Five User License
Five User
USD 4,999
USD 4,249
tax inclusive*
Corporate License
Unlimited Users
USD 5,999
USD 5,099
tax inclusive*
*Please note that the prices mentioned below are starting prices for each bundle type. Kindly contact our team for further details.*
Flash Bundle
Small Business Bundle
Growth Bundle
Enterprise Bundle
*Please note that the prices mentioned below are starting prices for each bundle type. Kindly contact our team for further details.*
Flash Bundle
Number of Reports: 3
20%
tax inclusive*
Small Business Bundle
Number of Reports: 5
25%
tax inclusive*
Growth Bundle
Number of Reports: 8
30%
tax inclusive*
Enterprise Bundle
Number of Reports: 10
35%
tax inclusive*
How To Order

Select License Type
Choose the right license for your needs and access rights.

Click on ‘Buy Now’
Add the report to your cart with one click and proceed to register.

Select Mode of Payment
Choose a payment option for a secure checkout. You will be redirected accordingly.
Strategic Solutions for Informed Decision-Making
Gain insights to stay ahead and seize opportunities.

Get insights & trends for a competitive edge.

Track prices with detailed trend reports.

Analyse trade data for supply chain insights.

Leverage cost reports for smart savings

Enhance supply chain with partnerships.

Connect For More Information
Our expert team of analysts will offer full support and resolve any queries regarding the report, before and after the purchase.
Our expert team of analysts will offer full support and resolve any queries regarding the report, before and after the purchase.
We employ meticulous research methods, blending advanced analytics and expert insights to deliver accurate, actionable industry intelligence, staying ahead of competitors.
Our skilled analysts offer unparalleled competitive advantage with detailed insights on current and emerging markets, ensuring your strategic edge.
We offer an in-depth yet simplified presentation of industry insights and analysis to meet your specific requirements effectively.


