

Consumer Insights
Uncover trends and behaviors shaping consumer choices today
Procurement Insights
Optimize your sourcing strategy with key market data
Industry Stats
Stay ahead with the latest trends and market analysis.
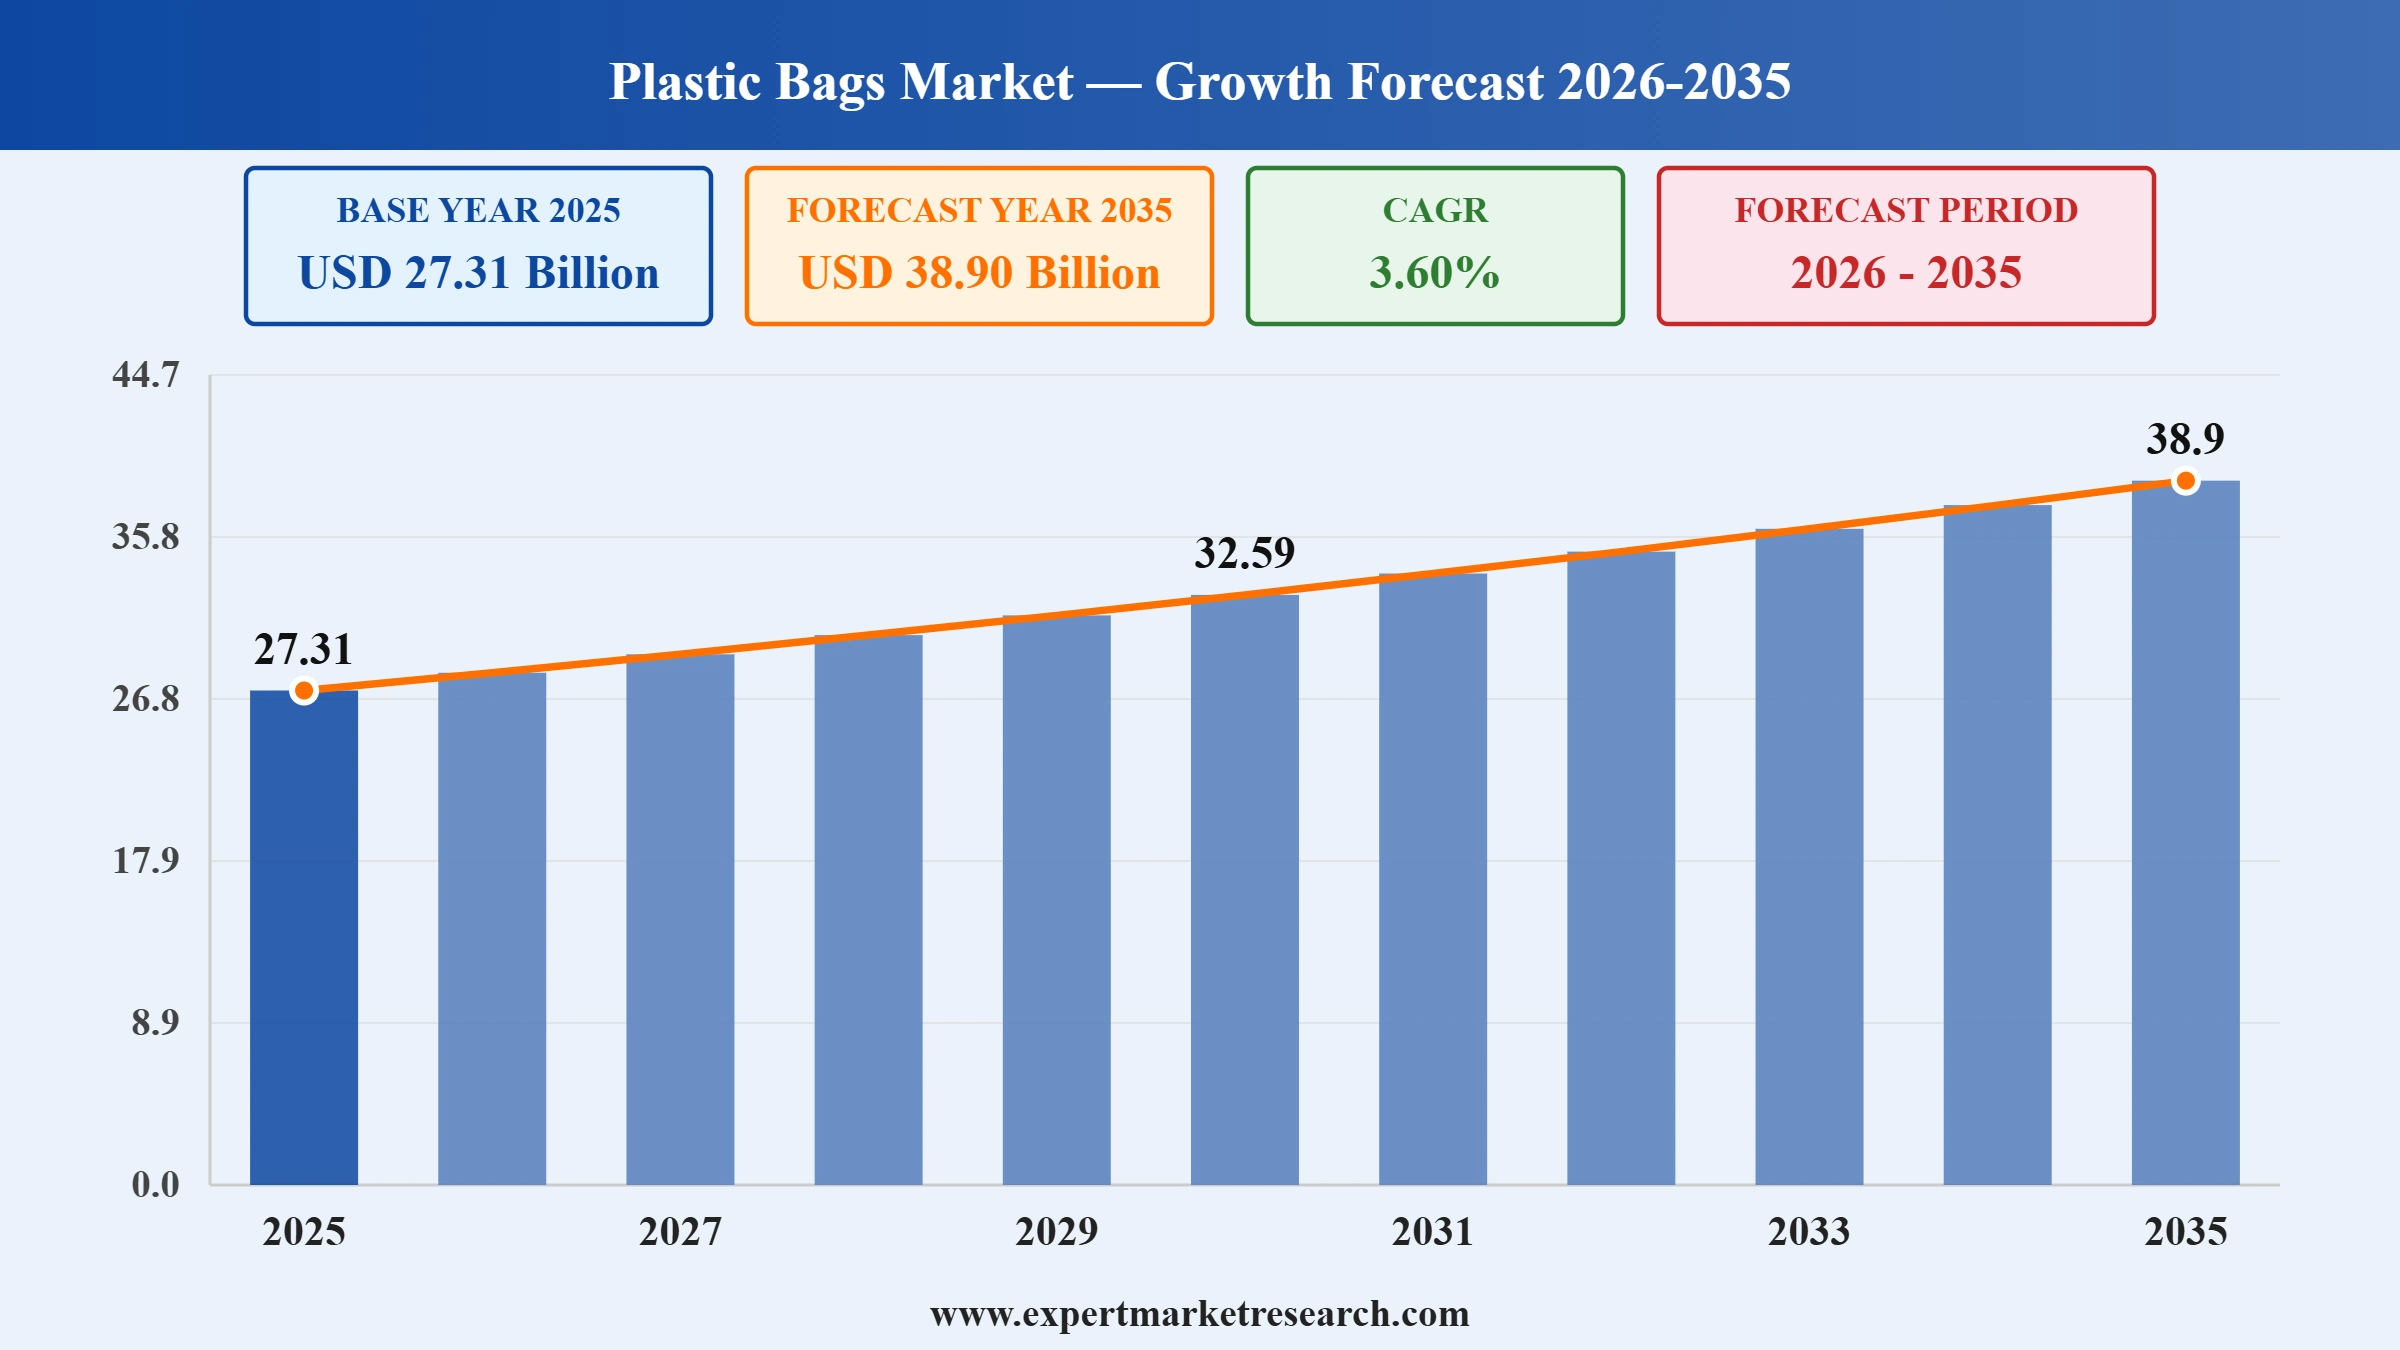
The global plastic bags market size reached around USD 27.31 Billion in 2025. The market is projected to grow at a CAGR of 3.60% between 2026 and 2035 to reach nearly USD 38.90 Billion by 2035. The market growth can be attributed to the rapid growth of the e-commerce industry and increasing government investments in expanding the domestic plastic recycling infrastructure. Rapid technological advancements in recycling processes are also expected to sustain the market growth in the coming years.
Companies are shifting towards using innovative technologies to manufacture recycled plastics ideal for contact-sensitive applications amid the growing focus on sustainability and stringent government initiatives. With the United States government is expected to double the plastic recycling rates in the United States, from 13%, by 2030, the demand for recycled plastics is surging.
In the e-commerce sector, plastic bags are extensively used in securing items and transporting them over long distances. As per industry reports, in H1 of 2024, Belgium reported a 5% growth in e-commerce sales and transaction volume, indicating robust consumer spending on different commodities. The industrial analysis suggests that around 89% of Belgians shopped online in 2024, and the total value of transactions reached EUR 8.3 billion.
Consumers are increasingly becoming conscious of reducing, reusing, and recycling plastic waste to minimise their carbon footprint. This is likely to increase sustainable plastic usage in the long-run and lead to the plastic bags market expansion in the forecast period.
Read more about this report - REQUEST FREE SAMPLE COPY IN PDF
| Global Plastic Bags Market Report Summary | Description | Value |
| Base Year | USD Billion | 2025 |
| Historical Period | USD Billion | 2019-2025 |
| Forecast Period | USD Billion | 2026-2035 |
| Market Size 2025 | USD Billion | 27.31 |
| Market Size 2035 | USD Billion | 38.90 |
| CAGR 2019-2025 | Percentage | XX% |
| CAGR 2026-2035 | Percentage | 3.60% |
| CAGR 2026-2035 - Market by Region | Asia Pacific | 4.0% |
| CAGR 2026-2035 - Market by Country | India | 4.1% |
| CAGR 2026-2035 - Market by Country | China | 3.9% |
| CAGR 2026-2035 - Market by Bag Type | Zipper Bags | 4.8% |
| CAGR 2026-2035 - Market by Material | Polylactic Acid (PLA) | 4.5% |
| Market Share by Country 2025 | UK | 3.3% |
The growth of e-commerce industry is expected to favourably influence the plastic bags market dynamics over the forecast period. In H1 2024, e-commerce sales in China recorded a year-on-year growth of 9.8% and reached a value of USD 996 billion. In this, retail sales of different products reached 5.96 trillion yuan, thereby recording a year-on-year growth of 8.8%. Similarly, total e-commerce sales during this period in the United States surpassed USD 579.45 billion. This is expected to increase the demand for plastic bags for the safe and secure transportation of various items across different regions.
In September 2024, the US government introduced a bill for passing the “Accelerating a Circular Economy for Plastics and Recycling Innovation Act of 2024”. With the anticipated formalisation of this law, the U.S. Environmental Protection Agency can establish national standards to double plastic recycling rates in over 9,000 jurisdictions across the United States. The government is also expected to mandate the use of 30% recycled content in plastic packaging by 2030 and incentivise the usage of recyclable plastic packaging. This is anticipated to create a favourable plastic bags market outlook in the forecast period.
The shift towards sustainability; soaring appeal of customisation; evolving business strategies of wholesalers; and rapid technological advancements are the major factors driving the plastic bags market growth.
Sonoco Products Co. signed an agreement with a Tokyo-based company Toppan Holdings Inc. to sell its thermoformed and flexible packaging (TFP) business for USD 1.8 billion. This is expected to bolster its focus on the consumer goods and industrial paper packaging businesses while enabling the latter to expand its existing portfolio of packaging solutions for the healthcare and food and beverage industries.
In collaboration with T2 Maschinenbau, Berry Global Inc. launched Single Wound Sheet (SWS) films comprising 50% recycled plastic content to manufacture PE bags for various commercial and industrial applications. These sheets guarantee exceptional clarity and depth of printing surface and can be decorated with around 10 colour prints to maximise branding and labelling space on packaging products. This is expected to facilitate the plastic bags market development in the coming years.
Amcor plc launched a Clear-Tite 40 shrink bag that enables retailers to pack fresh/processed meat products in a visually appealing way for consumers. This bag is 19% lighter than standard 50µ shrink bags and reduces carbon emissions by 16%. It is a ‘wrinkle-free’ packaging solution that ensures high shrink performance while being printable, thereby assisting brands in branding and labelling operations. The introduction of such products is expected to increase Amcor’s plastic bags market share significantly in the coming years.
Berry Global announced the availability of its Circular range of beauty and personal care packaging with CleanStream recycled plastic. The company’s proprietary technology recycles nearly 40% of polypropylene (PP0 waste collected from UK households. This move by the company is aimed at bolstering the company’s shift towards sustainability while providing brands with eco-friendly packaging options.
Major plastic bag manufacturers are producing bags from biodegradable or post-consumer recycled (PCR) materials to minimise waste generation and promote circular economic development. By enhancing their portfolio of eco-friendly plastic bags, they are creating a robust and long-lasting alternative to conventional plastic bags that harm the environment. This is expected to increase the plastic bags market revenue over the forecast period.
Technological advancements in printing technologies have enabled packaging companies to provide plastic bags in customised styles, patterns, and colours. This serves as an effective marketing tool that enhances brand image and leaves a long-lasting impact on customers’ minds. These bags are extremely popular for commercial applications, which is facilitating the plastic bags market expansion.
The development of compostable plastics has revolutionised plastic production by enabling companies to offer environment-friendly packaging solutions. Moreover, by adopting new production methods (such as process automation), companies are increasing the plastic bags market value by reducing costs and speeding up processes.
Plastic bag wholesalers are rethinking their strategies and providing businesses with small batches of recyclable and customisable plastic bags that balance their priorities of affordability and sustainability. This is driving the market growth by increasing plastic bags sales.
Focus on plastic recycling
By March 2027, kerbside recycling of flexible plastic packaging products is likely to become mandatory in the United Kingdom. This is prompting companies like Berry Global Inc. to make significant investments in upgrading their existing capacity for recycling plastic bags. Such strategic initiatives by plastic packaging companies are expected to create a favourable plastic bags market outlook in the forecast period.
Introduction of innovative plastic shrink bags
Amcor plc’s Clear-Tite 40 shrink bag is expected to enable manufacturers to cut down on their Extended Producer Responsibility (EPR) fees by 19%, especially in countries like the Netherlands, Italy, Spain, France, Germany, and the United Kingdom. As per the plastic bags market analysis, companies like Nestle are also introducing recyclable shrink bags that maintain product freshness and allow consumers to inspect fresh/processed food products easily at retail stores. This is expected to drive the market development over the forecast period.
The EMR’s report titled “Global Plastic Bags Market Report and Forecast 2026-2035” offers a detailed analysis of the market based on the following segments:
Breakup by Bag Type
Breakup by Material
Breakup by End Use
Breakup by Distribution Channel
Breakup by Region
Read more about this report - REQUEST FREE SAMPLE COPY IN PDF
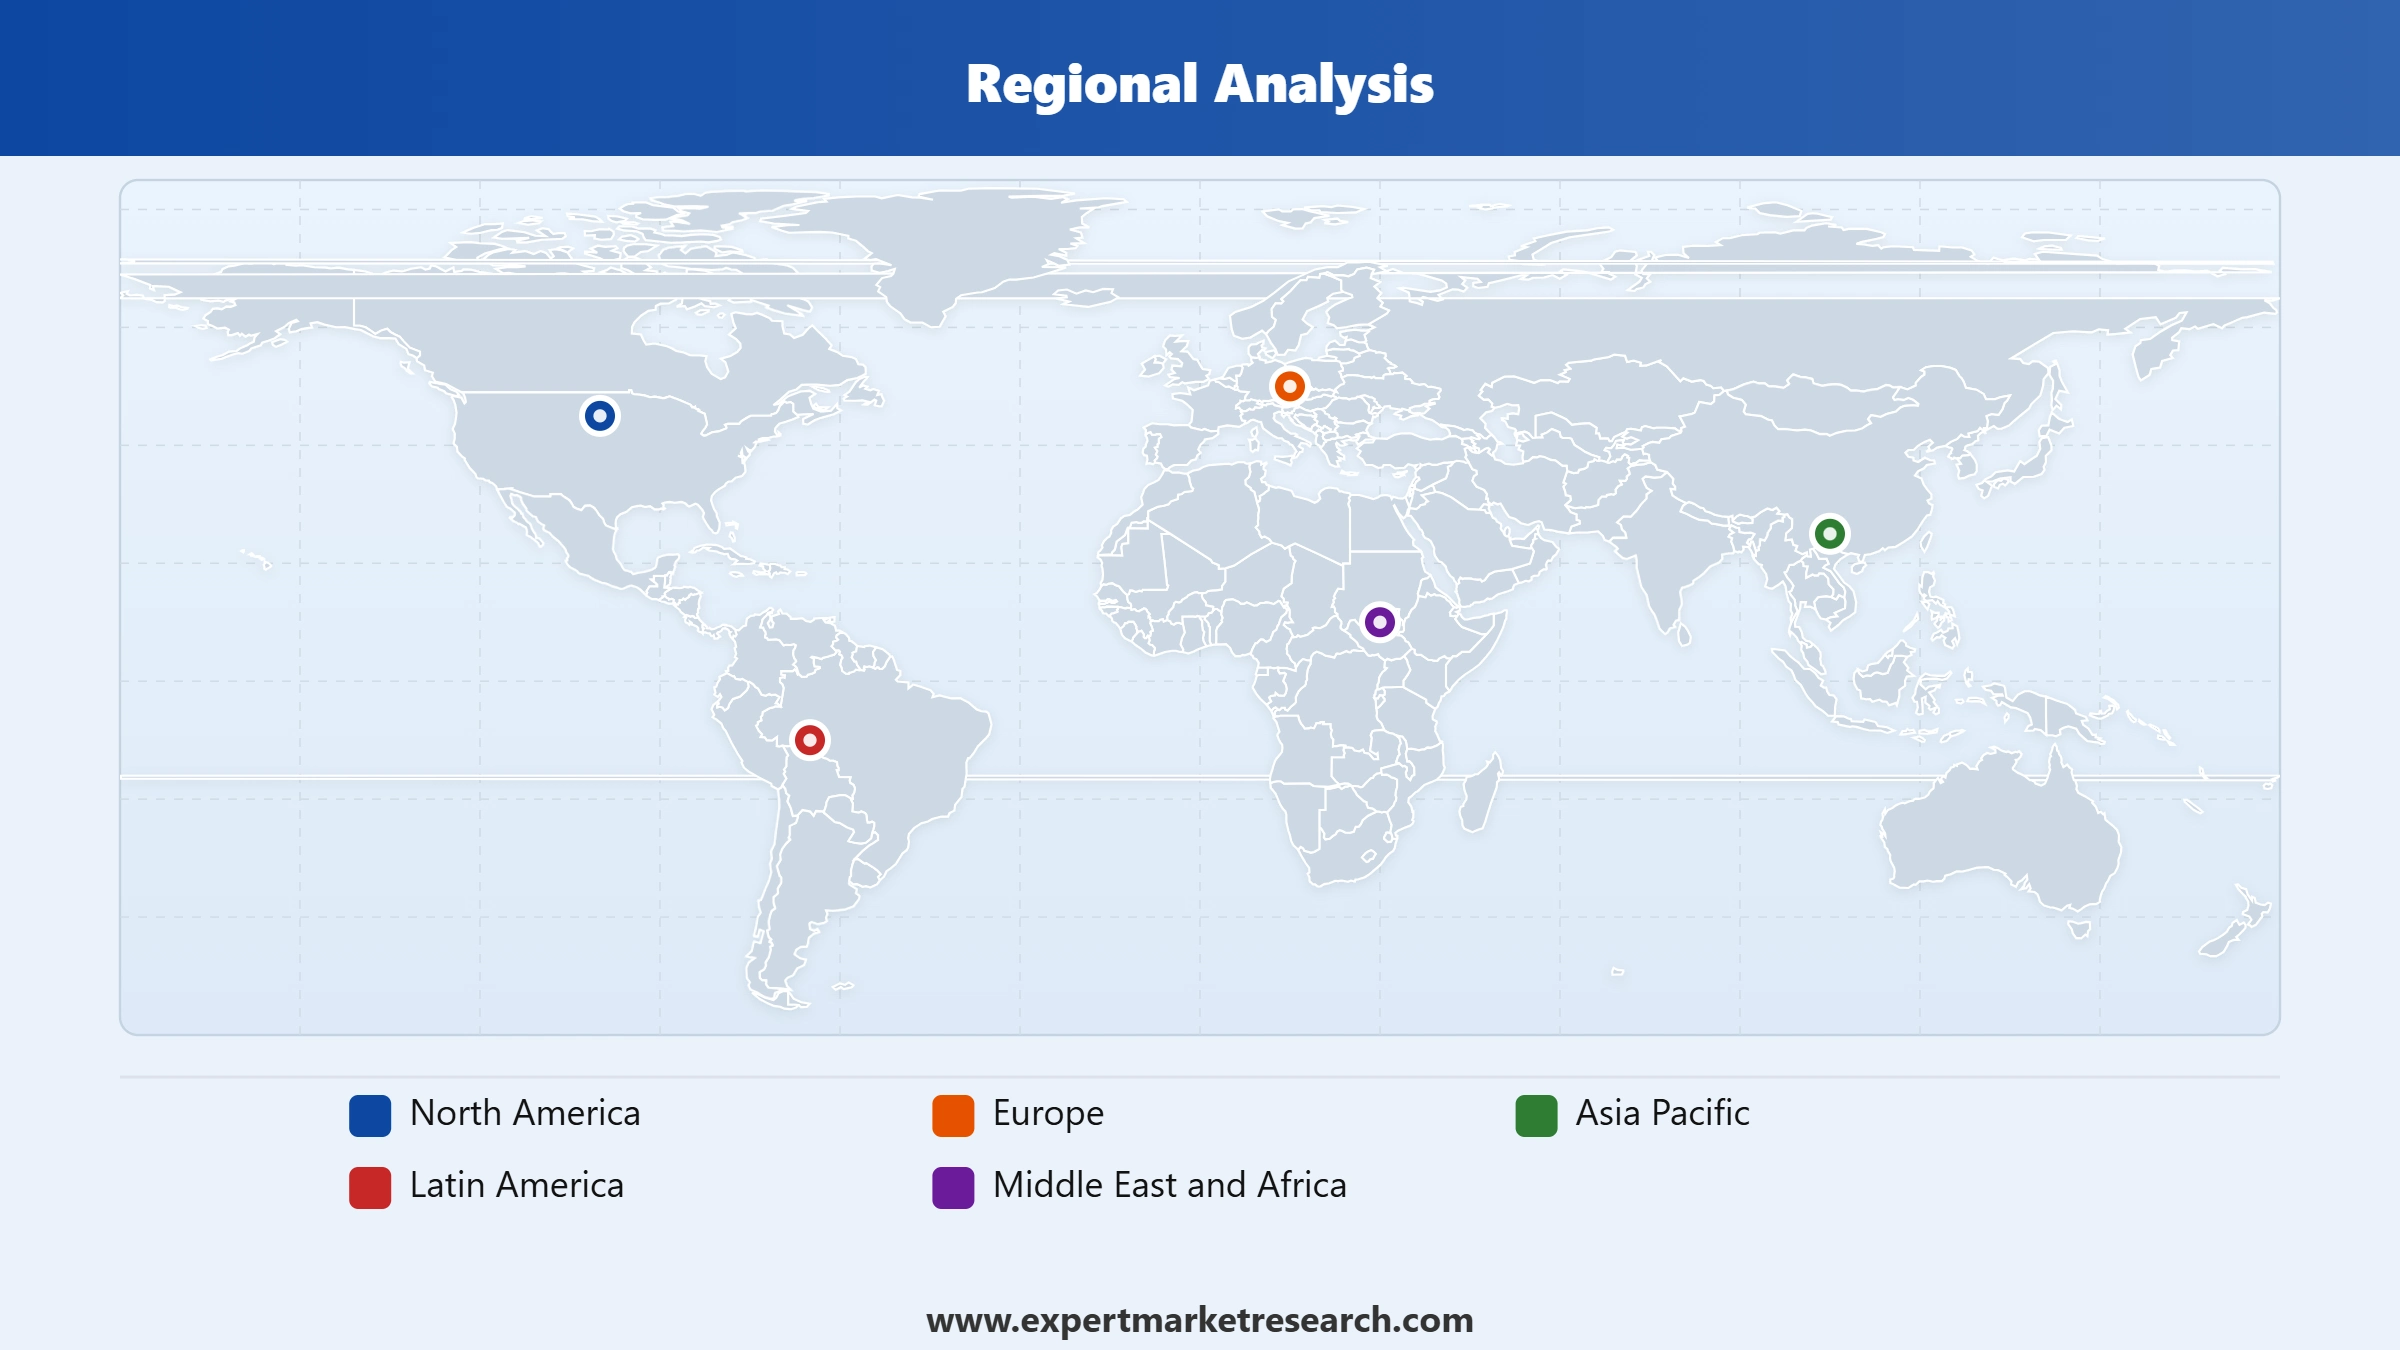
Based on region, the market is segmented into North America, Europe, the Asia Pacific, Latin America, and the Middle East and Africa. Over the forecast period of 2026-2035, the demand for market bags in the Asia Pacific is expected to grow at a CAGR of 4.0% as a result of the rapid growth of the e-commerce industry. Moreover, Latin America is expected to witness a CAGR of 3.9%, due to the introduction of bio-based packaging solutions. This is expected to increase the plastic bags market revenue in the long run.
Read more about this report - REQUEST FREE SAMPLE COPY IN PDF
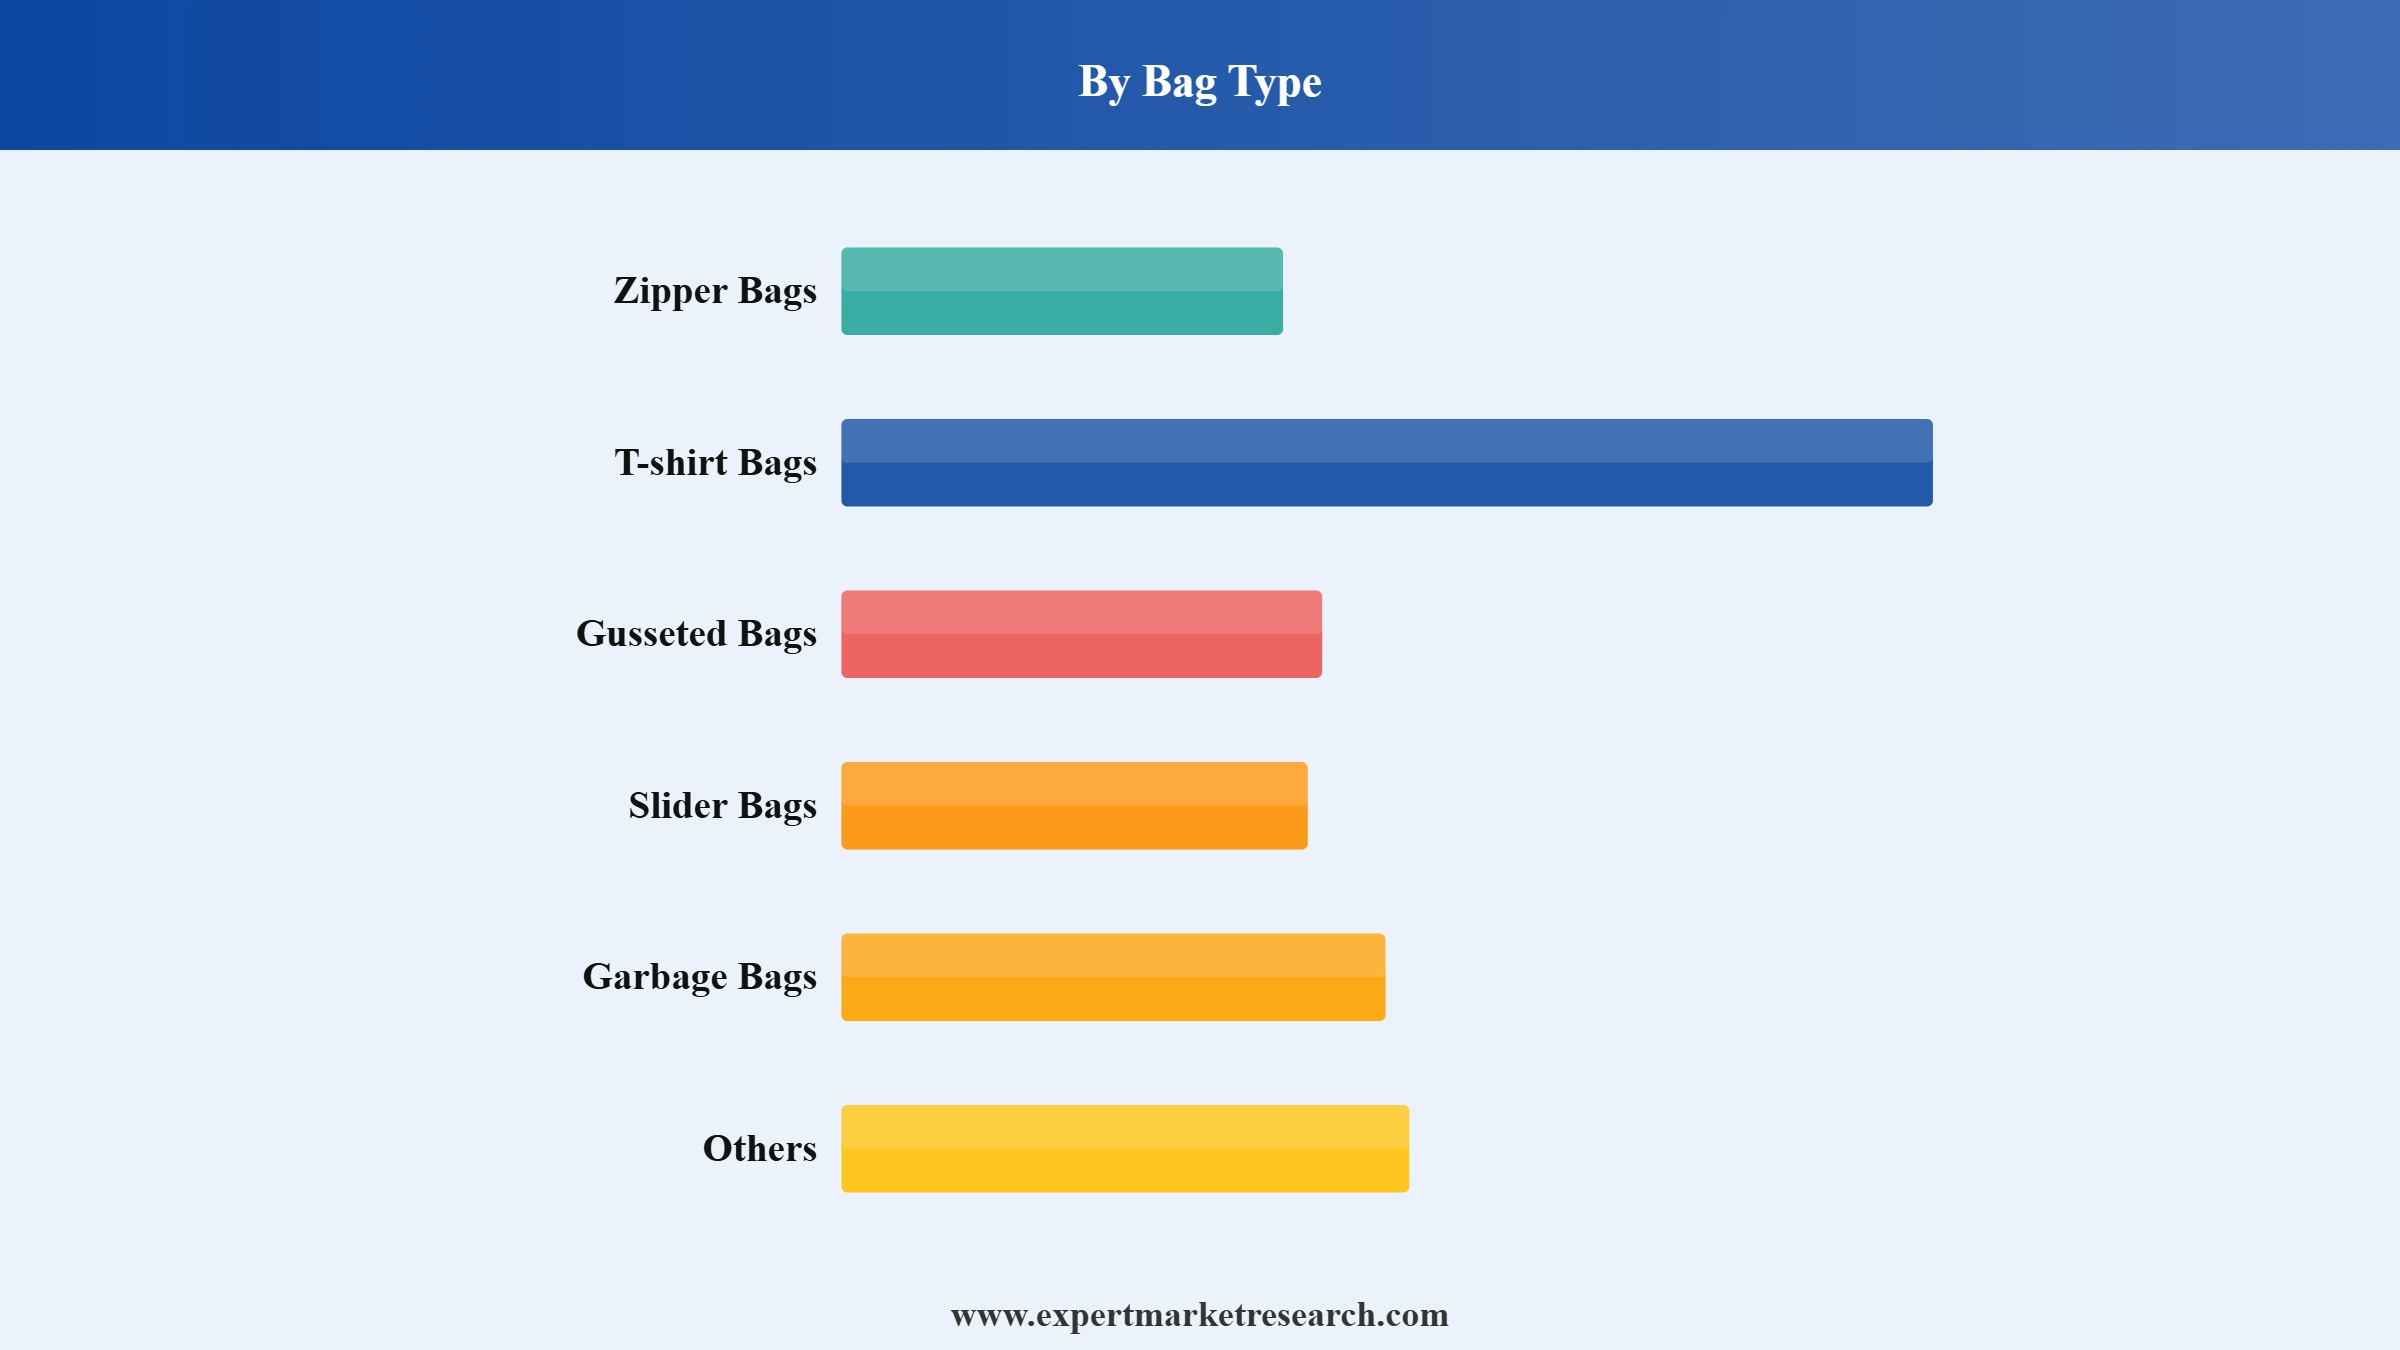
Based on bag type, the market is segmented into zipper bags, t-shirt bags, gusseted bags, slider bags, and garbage bags, among others. Over the forecast period of 2026-2035, the market for zipper bags is expected to grow at a CAGR of 4.8% due to the rising demand for practical and safe packaging solutions. Besides, the plastic bags market development is also expected to be driven by the increasing application of slider bags for storage of food and electronics items.
Read more about this report - REQUEST FREE SAMPLE COPY IN PDF
As per the plastic bags market analysis, major players are minimising the consumption of single-use plastics, adopting sustainable packaging solutions, and boosting their investments in expanding their existing plastic recycling infrastructure. These initiatives align with global efforts to promote environmental sustainability and reduce the usage of non-biodegradable plastics.
Sonoco Products Co. was founded in 1899 and is headquartered in South Carolina, United States. It produces a wide range of packaging solutions for the consumer goods, industrial, and healthcare sectors in 34 countries.
Advance Polybag, Inc. was founded in 1986 and is headquartered in Texas, United States. It uses resins derived from domestically produced natural gas to manufacture plastic bags in its state-of-the-art extrusion, bag-making, and printing facility.
Rutan Poly Industries, Inc. is headquartered in New Jersey, United States. It specialises in producing custom-printed plastic bags, zipper-style bags, gusseted plastic bags, and tape bags, among others.
Royal Bag Inc. was founded in 1971 and is headquartered in New York, United States. It produces packaging containers and plastic bags from virgin polyethylene.
*Please note that this is only a partial list; the complete list of key players is available in the full report. Additionally, the list of key players can be customized to better suit your needs.*
Other players included in the plastic bags market report are Berry Global Inc., Polypak Packaging, Corporation, Caltex Plastics, Amcor Plc, Bischof+Klein SE & Co. KG, International Plastics Inc., among others.


Upto 15% Off
USD
$2499 $2249
$3999 $3599
$4999 $4249
$5999 $5099


*While we strive to always give you current and accurate information, the numbers depicted on the website are indicative and may differ from the actual numbers in the main report. At Expert Market Research, we aim to bring you the latest insights and trends in the market. Using our analyses and forecasts, stakeholders can understand the market dynamics, navigate challenges, and capitalize on opportunities to make data-driven strategic decisions.*
In 2025, the market reached an approximate value of USD 27.31 Billion.
The market is projected to grow at a CAGR of 3.60% between 2026 and 2035.
The market is estimated to witness healthy growth in the forecast period of 2026-2035 to reach a value of around USD 38.90 Billion by 2035.
The different regions considered in the market report include North America, Europe, the Asia Pacific, Latin America, and the Middle East and Africa.
The different types of bags in the market are zipper bags, t-shirt bags, gusseted bags, slider bags, and garbage bags, among others.
The different end uses of plastic bags are retail, commercial, institutional, and household.
The different distribution channels of plastic bags are distributors, direct sales, and online channel, among others.
Key players in the market are Berry Global Inc., Advance Polybag, Inc., Polypak Packaging, Corporation, Rutan Poly Industries, Inc., Caltex Plastics, Royal Bag Inc., Amcor Plc, Bischof+Klein SE & Co. KG, International Plastics Inc., and Sonoco Products Co., among others.
Explore our key highlights of the report and gain a concise overview of key findings, trends, and actionable insights that will empower your strategic decisions.
| REPORT FEATURES | DETAILS |
| Base Year | 2025 |
| Historical Period | 2019-2025 |
| Forecast Period | 2026-2035 |
| Scope of the Report |
Historical and Forecast Trends, Industry Drivers and Constraints, Historical and Forecast Market Analysis by Segment:
|
| Breakup by Bag Type |
|
| Breakup by Material |
|
| Breakup by End Use |
|
| Breakup by Distribution Channel |
|
| Breakup by Region |
|
| Market Dynamics |
|
| Competitive Landscape |
|
| Companies Covered |
|
Datasheet
One User
USD 2,499
USD 2,249
tax inclusive*
Single User License
One User
USD 3,999
USD 3,599
tax inclusive*
Five User License
Five User
USD 4,999
USD 4,249
tax inclusive*
Corporate License
Unlimited Users
USD 5,999
USD 5,099
tax inclusive*
*Please note that the prices mentioned below are starting prices for each bundle type. Kindly contact our team for further details.*
Flash Bundle
Small Business Bundle
Growth Bundle
Enterprise Bundle
*Please note that the prices mentioned below are starting prices for each bundle type. Kindly contact our team for further details.*
Flash Bundle
Number of Reports: 3
20%
tax inclusive*
Small Business Bundle
Number of Reports: 5
25%
tax inclusive*
Growth Bundle
Number of Reports: 8
30%
tax inclusive*
Enterprise Bundle
Number of Reports: 10
35%
tax inclusive*
How To Order

Select License Type
Choose the right license for your needs and access rights.

Click on ‘Buy Now’
Add the report to your cart with one click and proceed to register.

Select Mode of Payment
Choose a payment option for a secure checkout. You will be redirected accordingly.
Strategic Solutions for Informed Decision-Making
Gain insights to stay ahead and seize opportunities.

Get insights & trends for a competitive edge.

Track prices with detailed trend reports.

Analyse trade data for supply chain insights.

Leverage cost reports for smart savings

Enhance supply chain with partnerships.

Connect For More Information
Our expert team of analysts will offer full support and resolve any queries regarding the report, before and after the purchase.
Our expert team of analysts will offer full support and resolve any queries regarding the report, before and after the purchase.
We employ meticulous research methods, blending advanced analytics and expert insights to deliver accurate, actionable industry intelligence, staying ahead of competitors.
Our skilled analysts offer unparalleled competitive advantage with detailed insights on current and emerging markets, ensuring your strategic edge.
We offer an in-depth yet simplified presentation of industry insights and analysis to meet your specific requirements effectively.




