

Consumer Insights
Uncover trends and behaviors shaping consumer choices today
Procurement Insights
Optimize your sourcing strategy with key market data
Industry Stats
Stay ahead with the latest trends and market analysis.
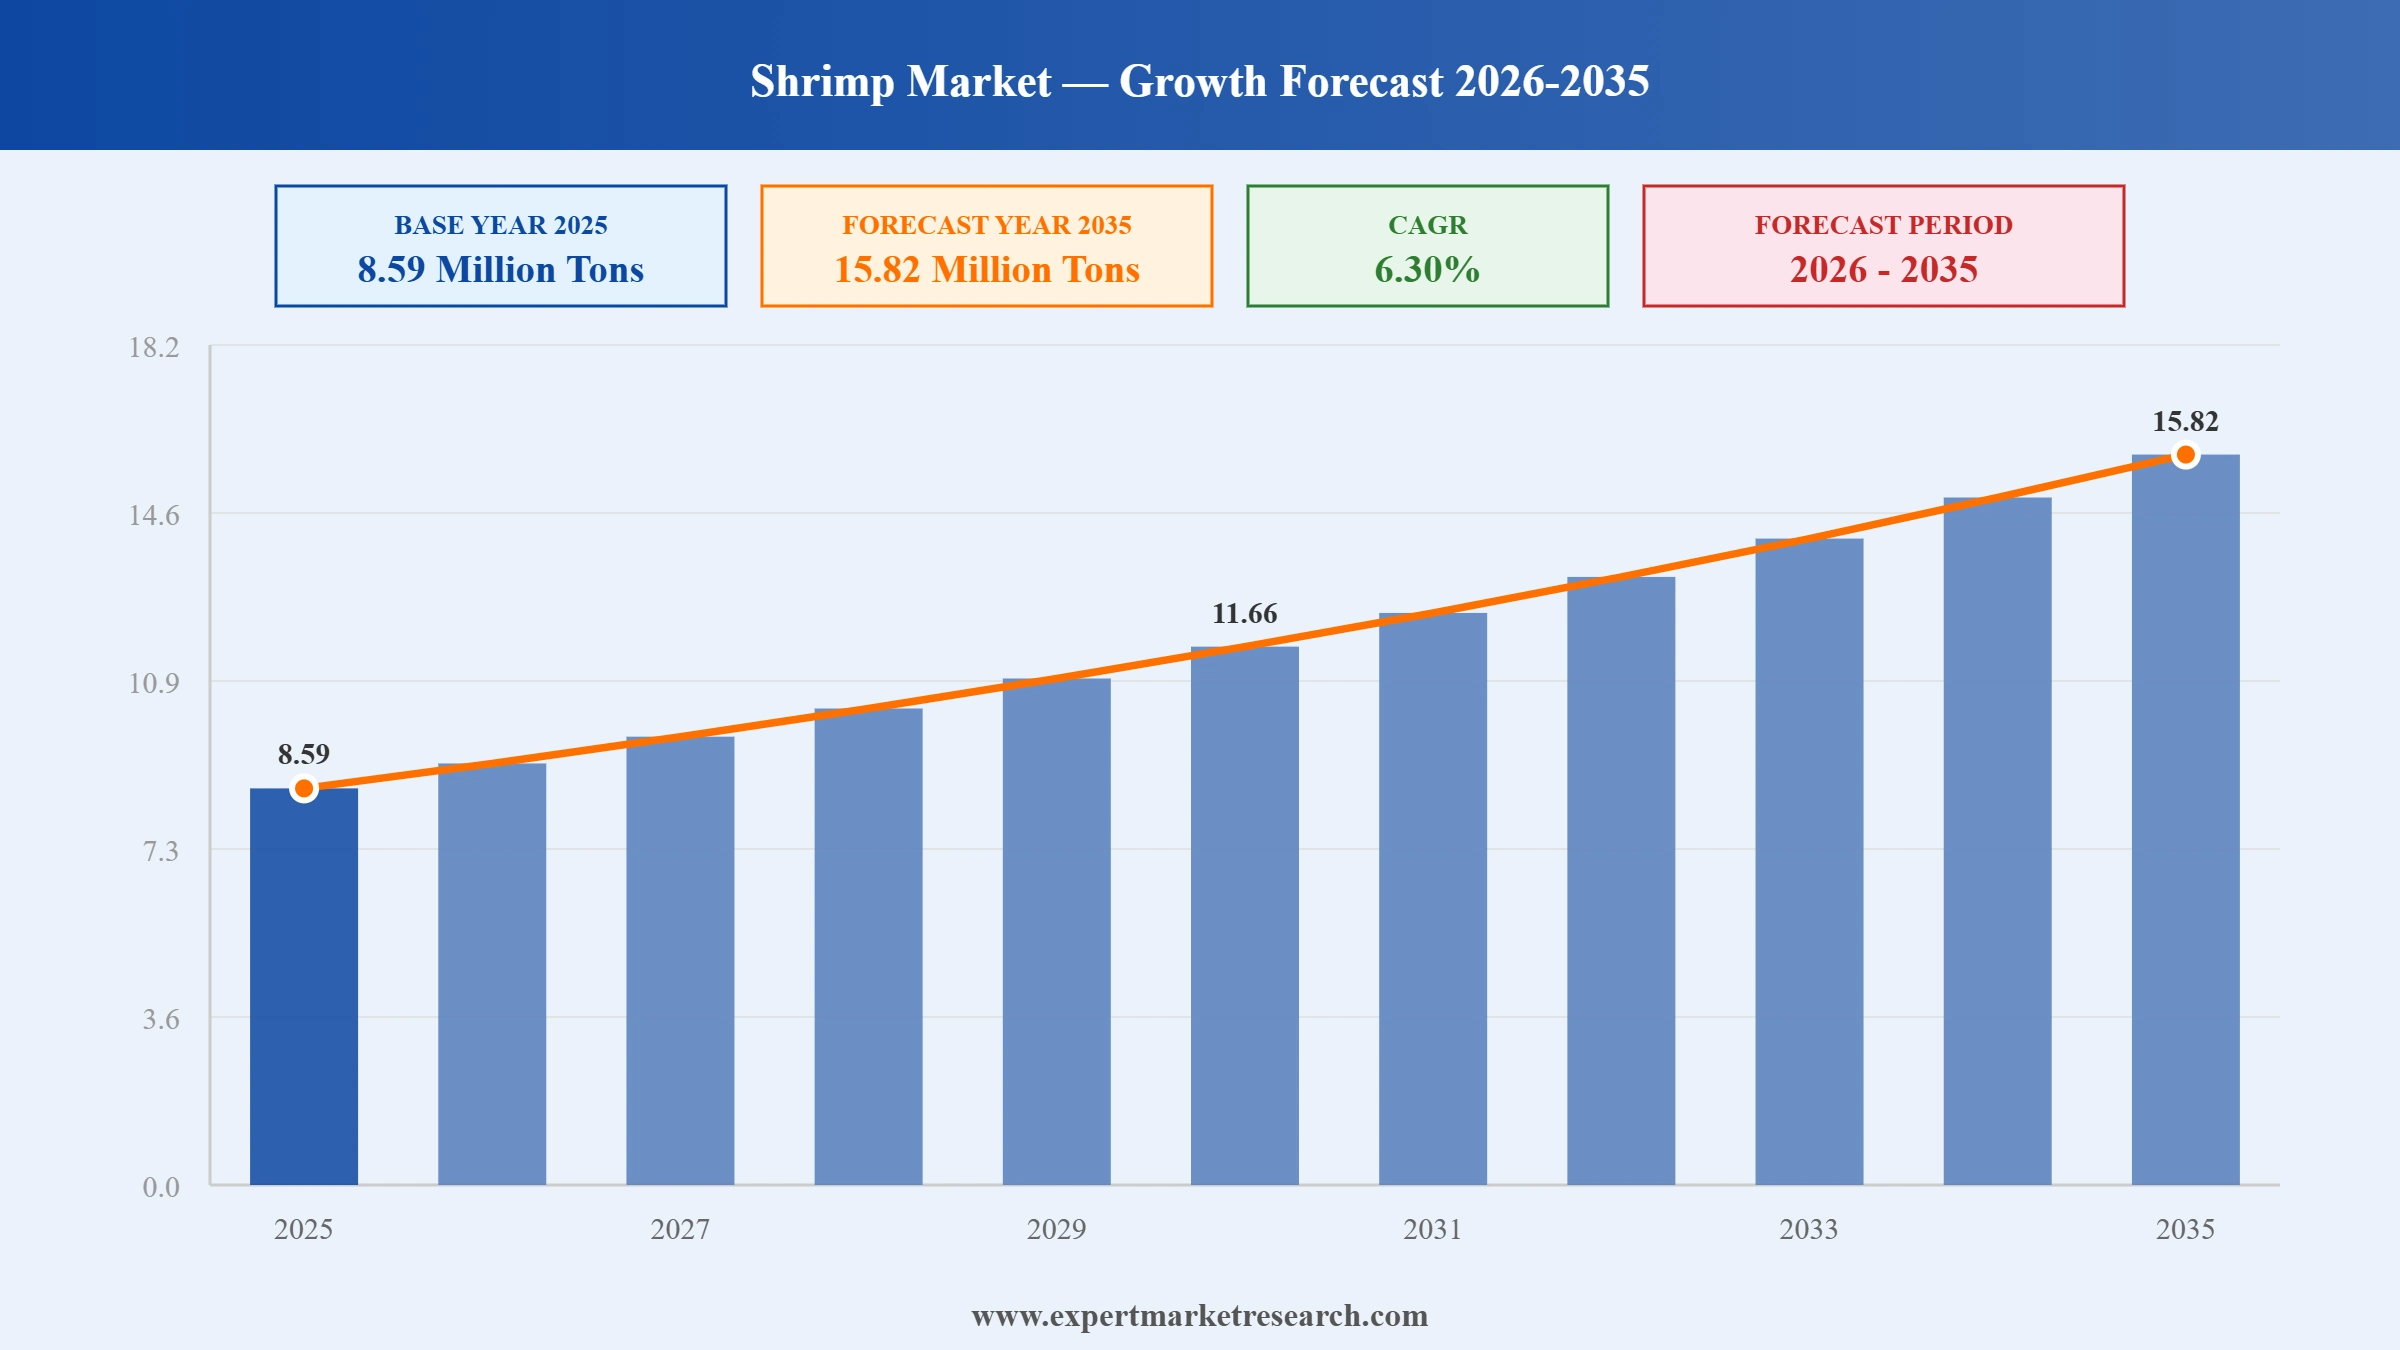
The global shrimp market reached a volume of 8.59 Million Tons at 2025 and is projected to expand at a CAGR of around 6.30% during the forecast period of 2026-2035. With rising global seafood and protein consumption, accelerated aquaculture investment in Ecuador and Vietnam, growing biosecure farming and disease prevention technology, and expanding modern retail and HoReCa demand worldwide, the market is expected to reach 15.82 Million Tons by 2035.
Read more about this report - REQUEST FREE SAMPLE COPY IN PDF
| Global Shrimp Market Report Summary | Description | Value |
| Base Year | Million Tons | 2025 |
| Historical Period | Million Tons | 2019-2025 |
| Forecast Period | Million Tons | 2026-2035 |
| Market Size 2025 | Million Tons | 8.59 |
| Market Size 2035 | Million Tons | 15.82 |
| CAGR 2019-2025 | Percentage | XX% |
| CAGR 2026-2035 | Percentage | 6.30% |
| CAGR 2026-2035 - Market by Region | Asia Pacific | 7.1% |
| CAGR 2026-2035 - Market by Country | India | 7.9% |
| CAGR 2026-2035 - Market by Country | China | 6.8% |
| CAGR 2026-2035 - Market by Type | Farmed Shrimp | 6.9% |
| CAGR 2026-2035 - Market by Distribution Channel | Online | 8.3% |
| Market Share by Country 2025 | Italy | 4.6% |
The global shrimp market is reshaped by Ecuador export surge, Vietnam and India aquaculture growth, biosecure farming adoption, and Thai Union and Avanti Feeds investments in Latin American capacity. These shifts are recalibrating global trade flows and supply chain economics.
Avanti Feeds Ltd. approved a USD 3 million investment for a 10 percent stake in Thai Union Feedmill Ecuador, marking Avanti formal entry into the South American market and reinforcing Ecuador rising role as a global shrimp production hub for export to China, the US, and Europe.
Thai Union Group PCL announced an investment of up to USD 55 million to build an aquaculture feed production facility in Ecuador, suggesting sustained investment in Ecuador shrimp aquaculture supply chain and supporting Penaeus vannamei farming productivity and biosecurity at scale.
Ecuador exported 276 million pounds of shrimp in January 2026 alone, up 23 percent year on year, aided by resilient white shrimp production, expanding feed and biosecure farming investments, and recovering demand from China and the United States.
India black tiger shrimp exports expanded sharply, with Penaeus monodon volumes rising from 6,059 tons in 2020 to 58,221 tons in 2025, nearly a tenfold increase in five years, aided by Andhra Pradesh and Tamil Nadu aquaculture farms and export market diversification.
Ecuador Push: The global shrimp market is lifted by Ecuador white shrimp aquaculture growth, with Thai Union investing USD 55 million in a feed plant and Avanti Feeds taking a 10 percent stake in Thai Union Feedmill Ecuador, supporting Ecuador export volume to China, the US, and Europe.
Biosecure Push: Global shrimp market growth is shaped by biosecure farming and disease prevention systems, with India, Vietnam, Ecuador, and Indonesia adopting better hatchery management, biofloc, and recirculating aquaculture systems to boost productivity and reduce disease losses.
India Push: The global shrimp market is aided by India Penaeus monodon black tiger shrimp growth, with exports rising nearly tenfold in five years to 58,221 tons in 2025, anchored by Andhra Pradesh and Tamil Nadu farms and growing premium export market positioning.
Vietnam Push: The global shrimp market is lifted by Vietnam shrimp export ambitions for 2026, with the fishing industry aiming for export turnover near USD 11.5 billion, aided by stabilising raw material sources, biosecure farms, and value added processing for premium export markets.
Retail Push: Global shrimp market growth is aided by modern retail, hypermarket, e-commerce, and HoReCa channel growth, with Penaeus vannamei and Penaeus monodon SKUs anchoring frozen, fresh, and value added shrimp assortments across global metro markets.
The report of the Expert Market Research's titled "Global Shrimp Market Report and Forecast 2026-2035" offers a detailed analysis of the market based on the following segments:
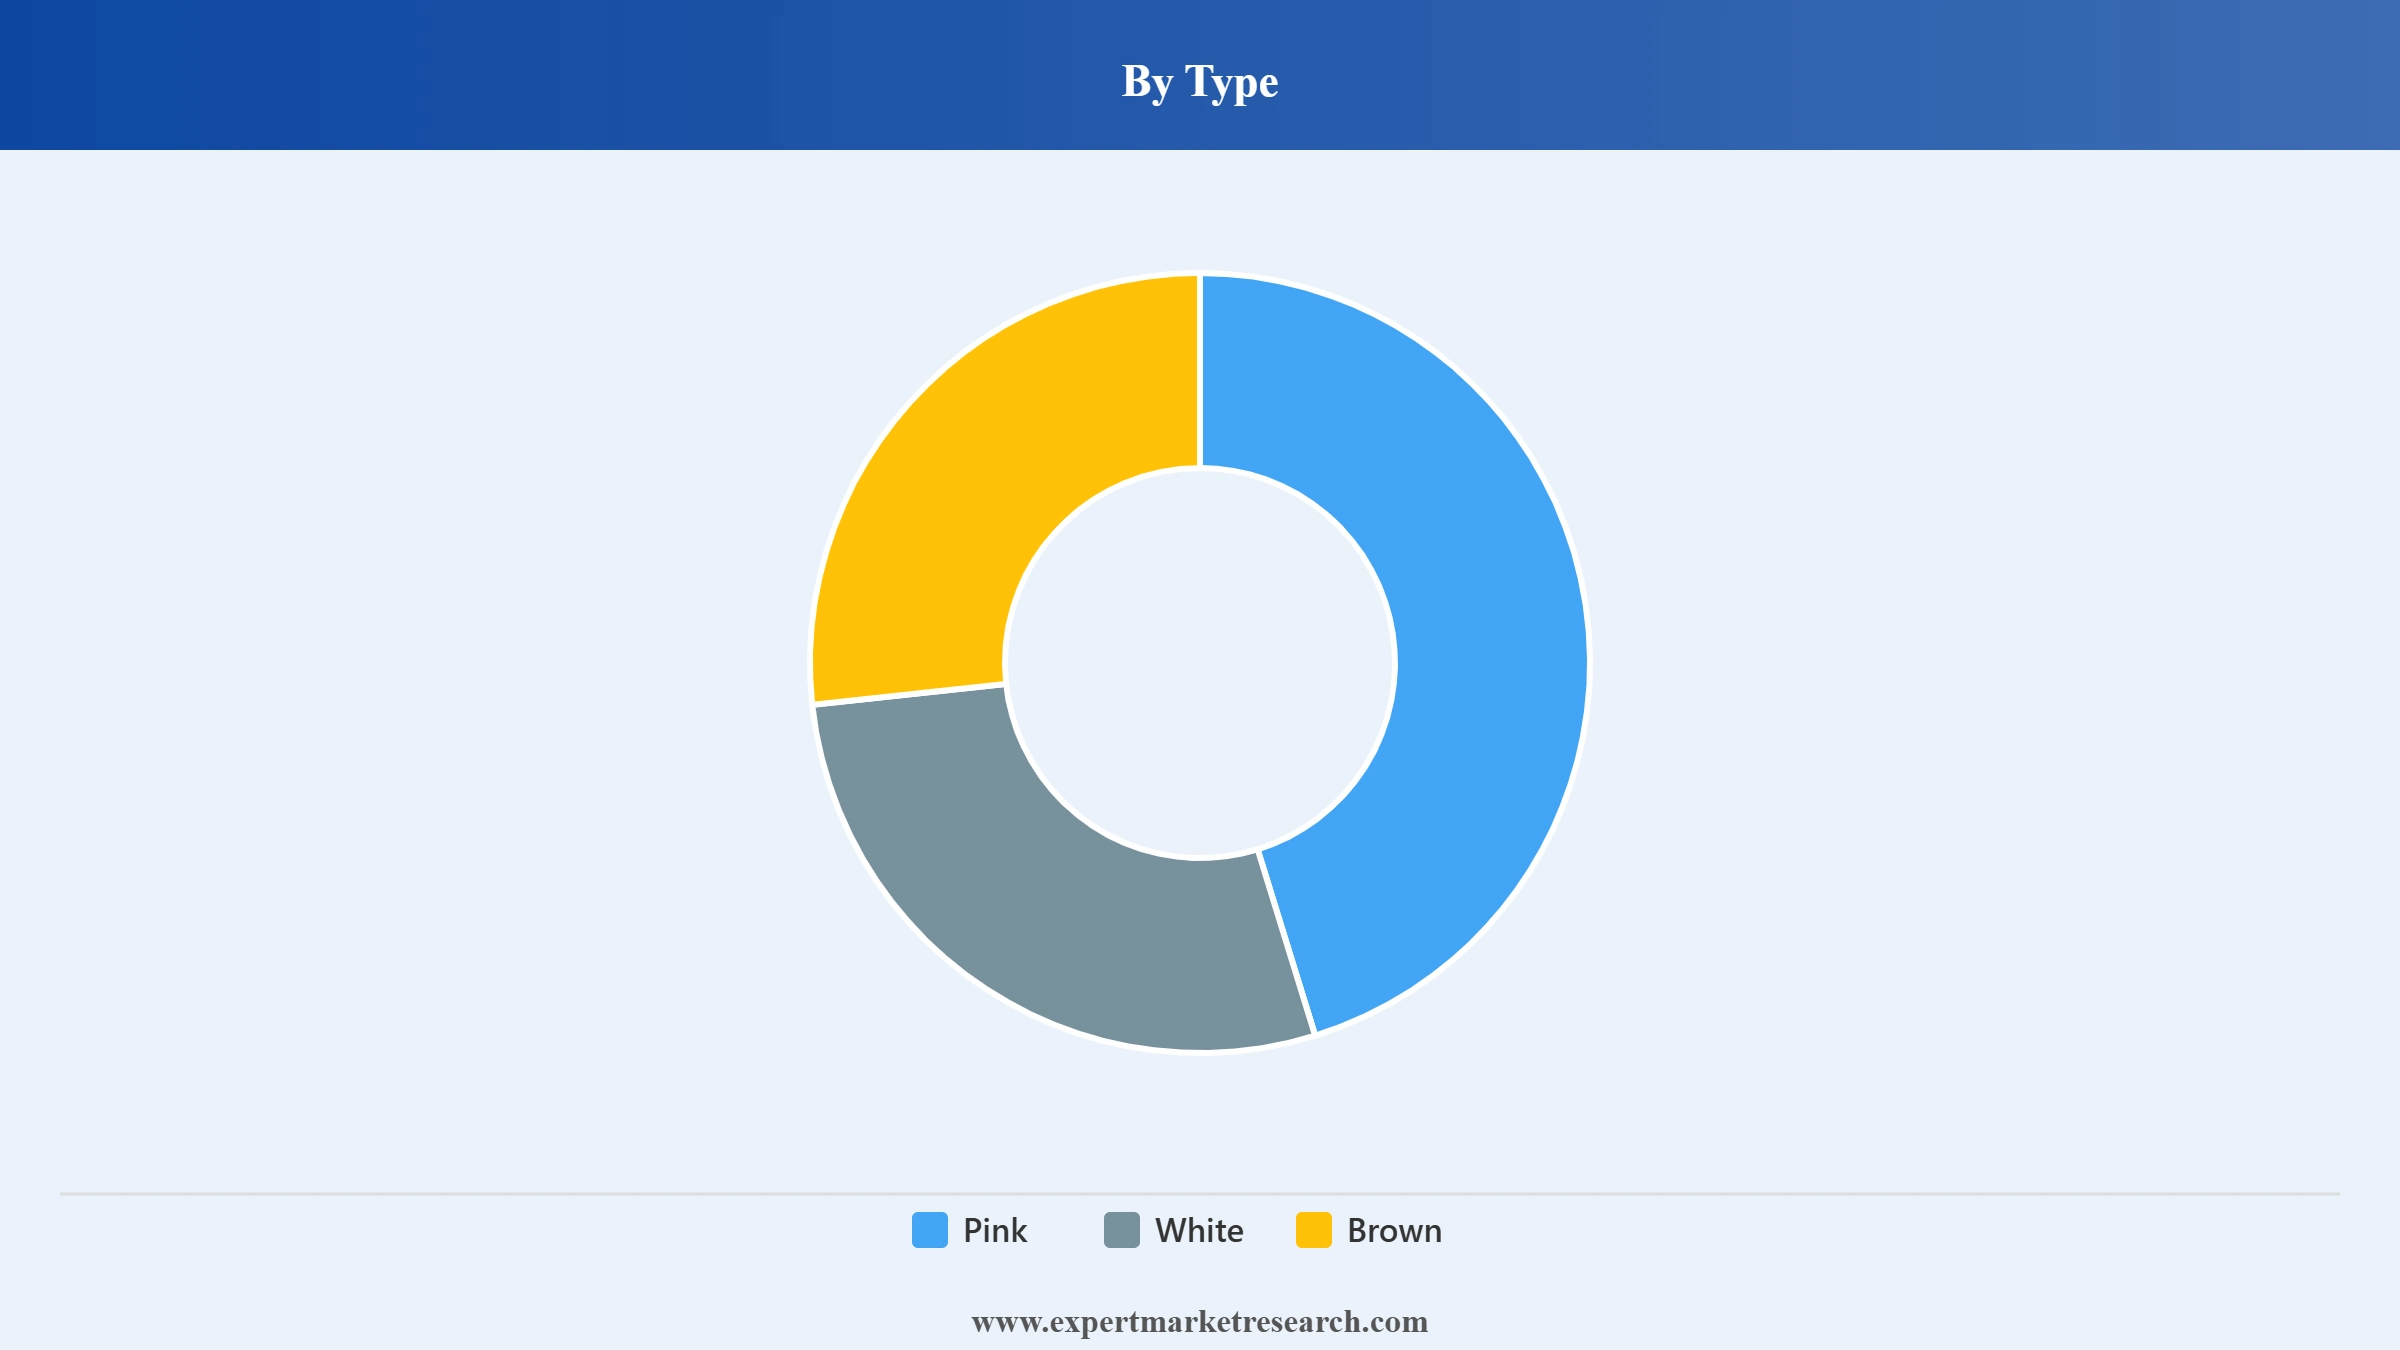
Market Breakup by Type
Key Insight: White shrimp dominates the type segment with Penaeus vannamei aquaculture in Ecuador, India, Vietnam, China, Indonesia, and Thailand. Pink shrimp anchor Mexican and Mediterranean wild capture and aquaculture. Brown shrimp lead Gulf of Mexico and North Sea wild capture. Other species including Macrobrachium rosenbergii contribute incremental volumes, with white shrimp growth backed by biosecure farming and feed innovation.
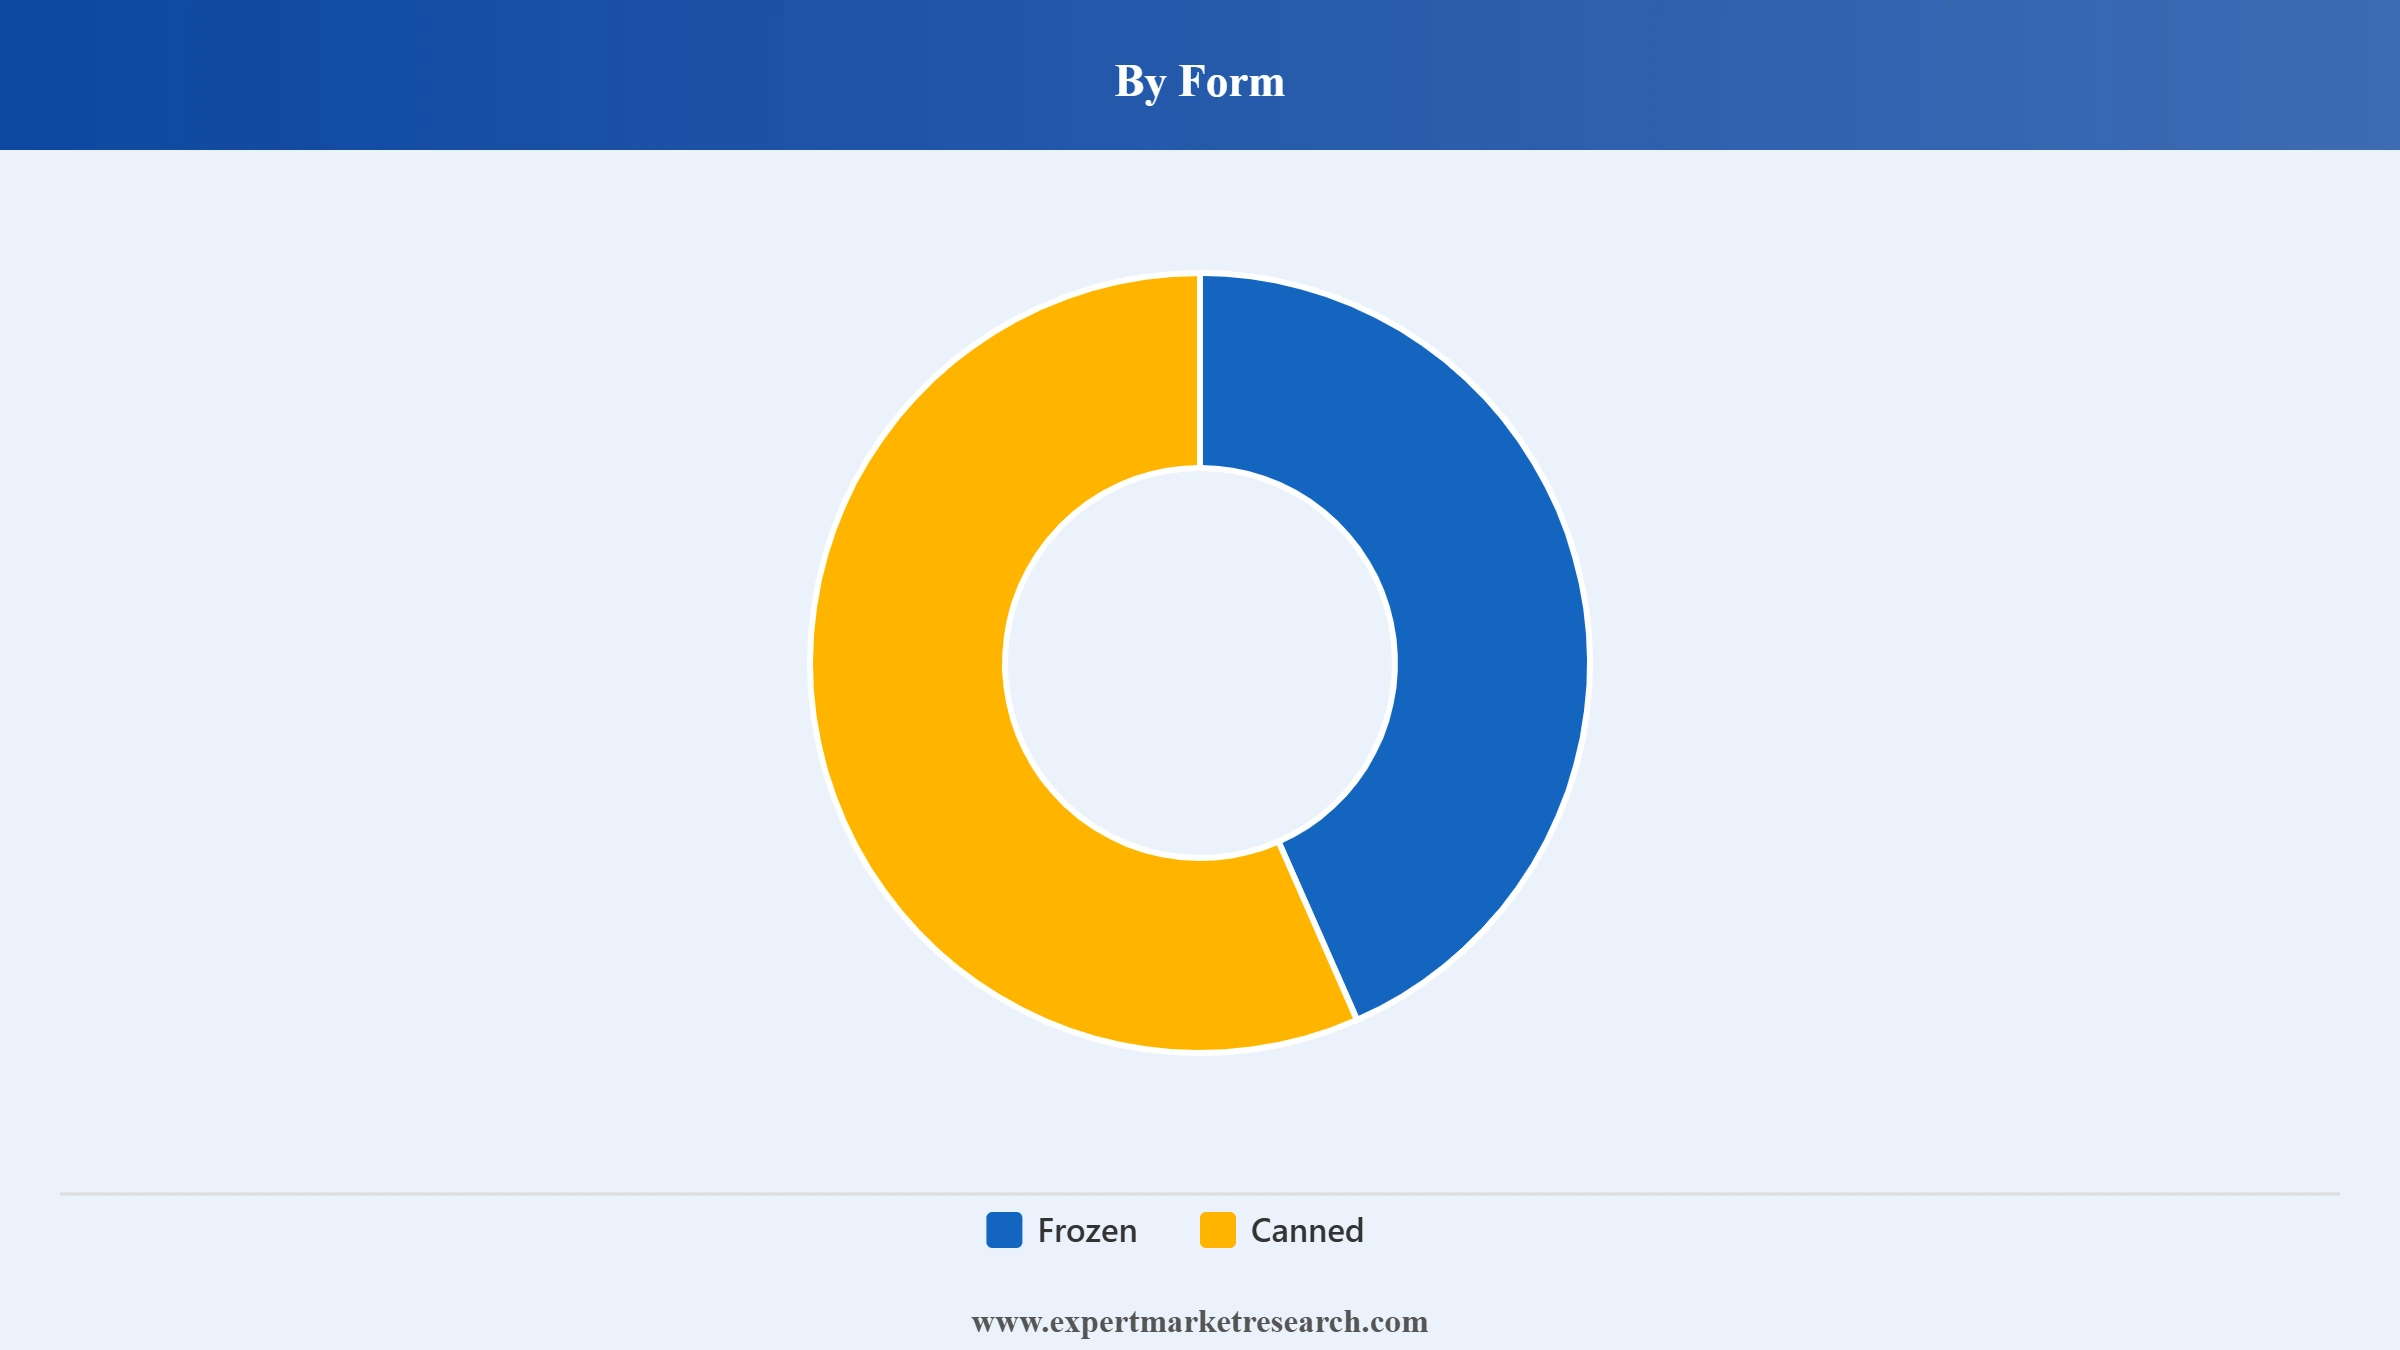
Market Breakup by Form
Key Insight: Frozen shrimp dominate the form segment with broad supermarket, hypermarket, and HoReCa distribution. Canned shrimp retain relevance in shelf stable retail, foodservice, and ready meal applications. Frozen continues to grow on the back of cold chain growth, premium value added breaded, marinated, and ready to cook formats, aided by leading global processors in Ecuador, Thailand, India, and Vietnam.
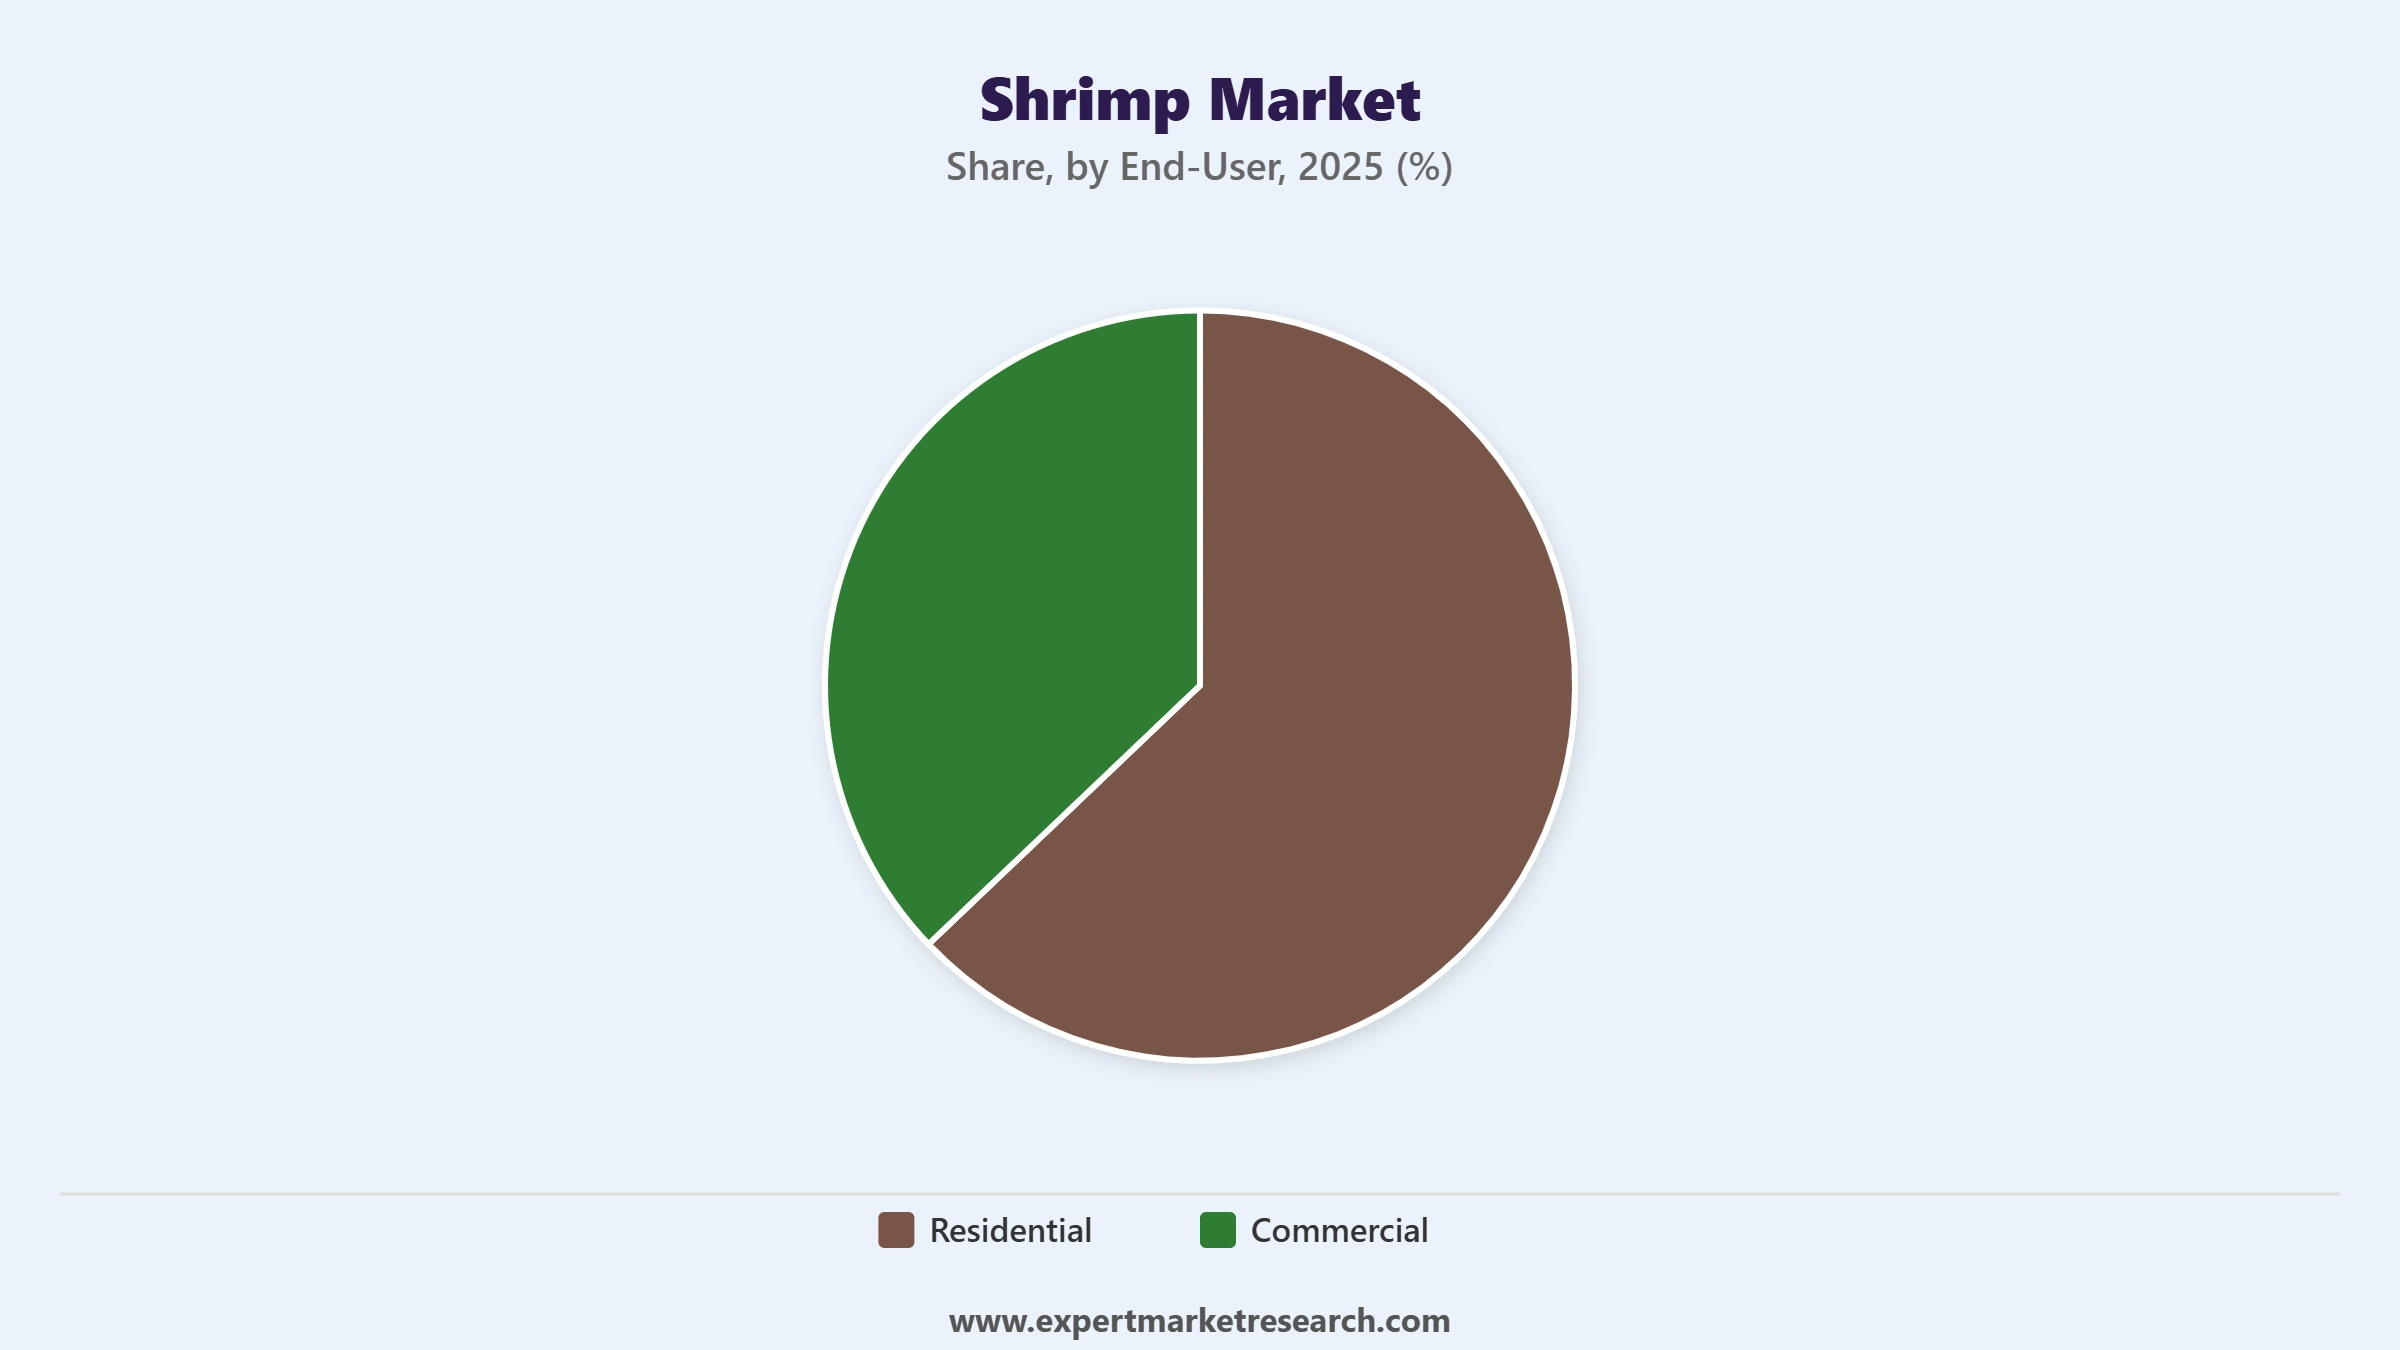
Market Breakup by End-User
Key Insight: Commercial end use leads the global shrimp market with hotels, restaurants, QSR, and institutional buyers driving large frozen and fresh shrimp volumes. Residential end use anchors modern retail mass household demand. Both segments are more and more specifying premium Penaeus monodon black tiger shrimp and Penaeus vannamei white shrimp from Ecuador, India, and Vietnam, aided by sustainability certifications and traceability programmes.
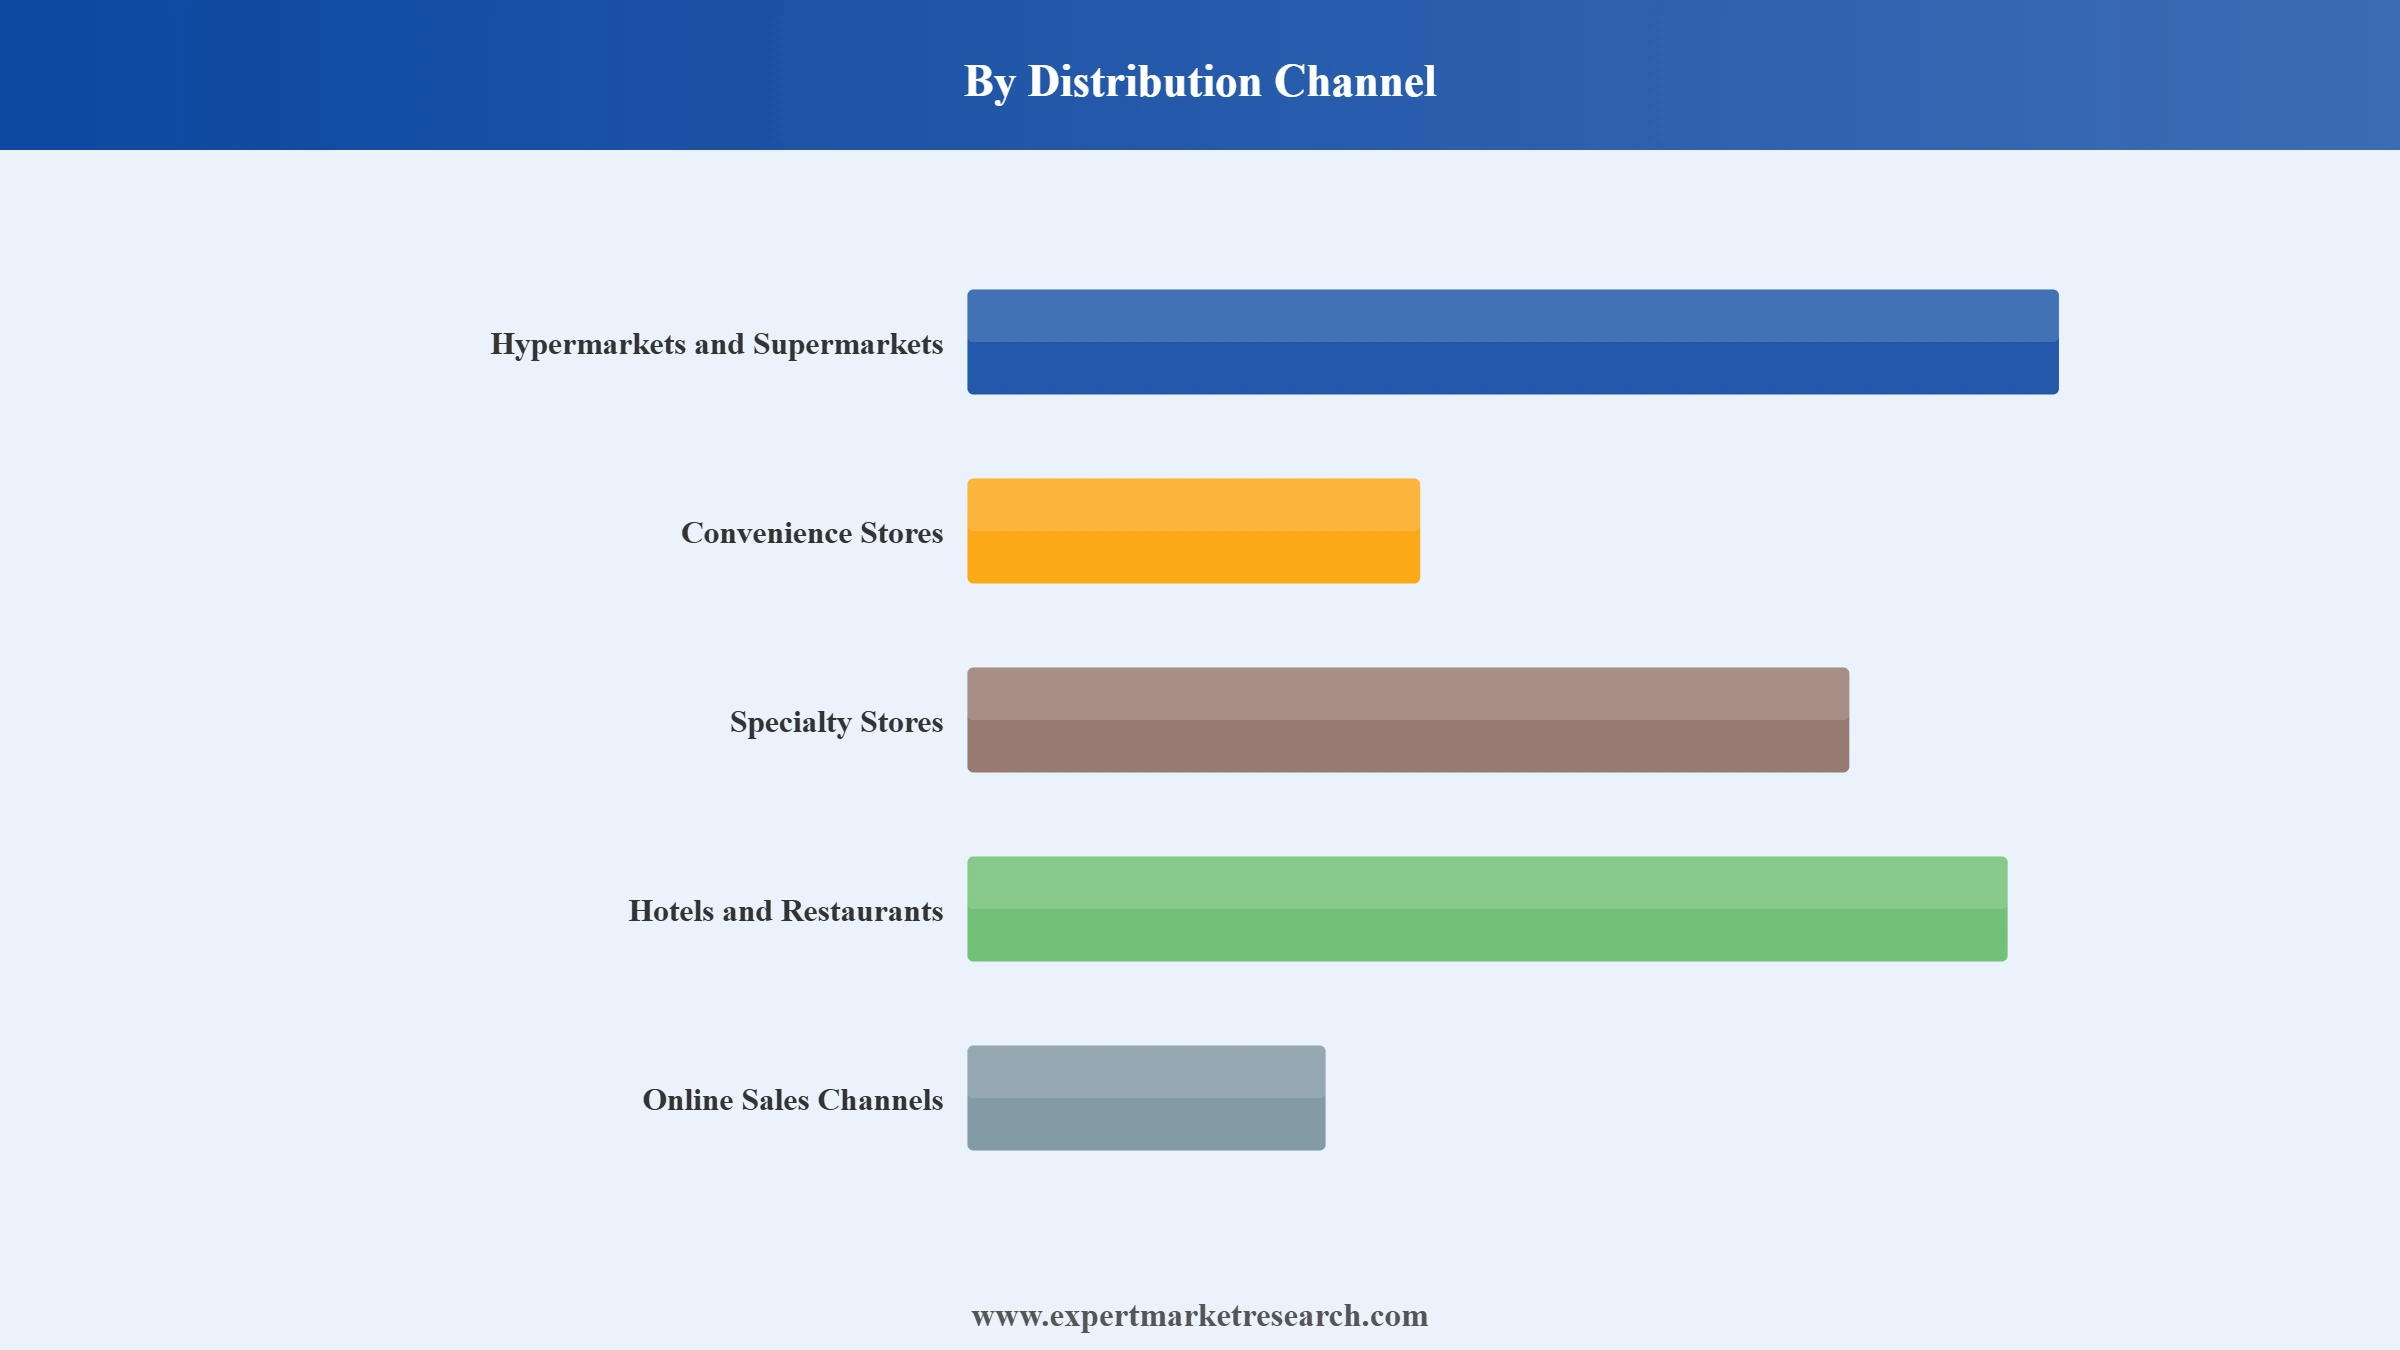
Market Breakup by Distribution Channel
Key Insight: Hypermarkets and supermarkets lead distribution with broad frozen shrimp assortments across mass and premium SKUs. Hotels and restaurants anchor commercial demand. Specialty seafood stores and convenience stores serve premium and impulse demand. Online sales channels are the fastest growing pool, aided by quick commerce, premium D2C seafood brands, and HoReCa procurement digitisation across global markets.
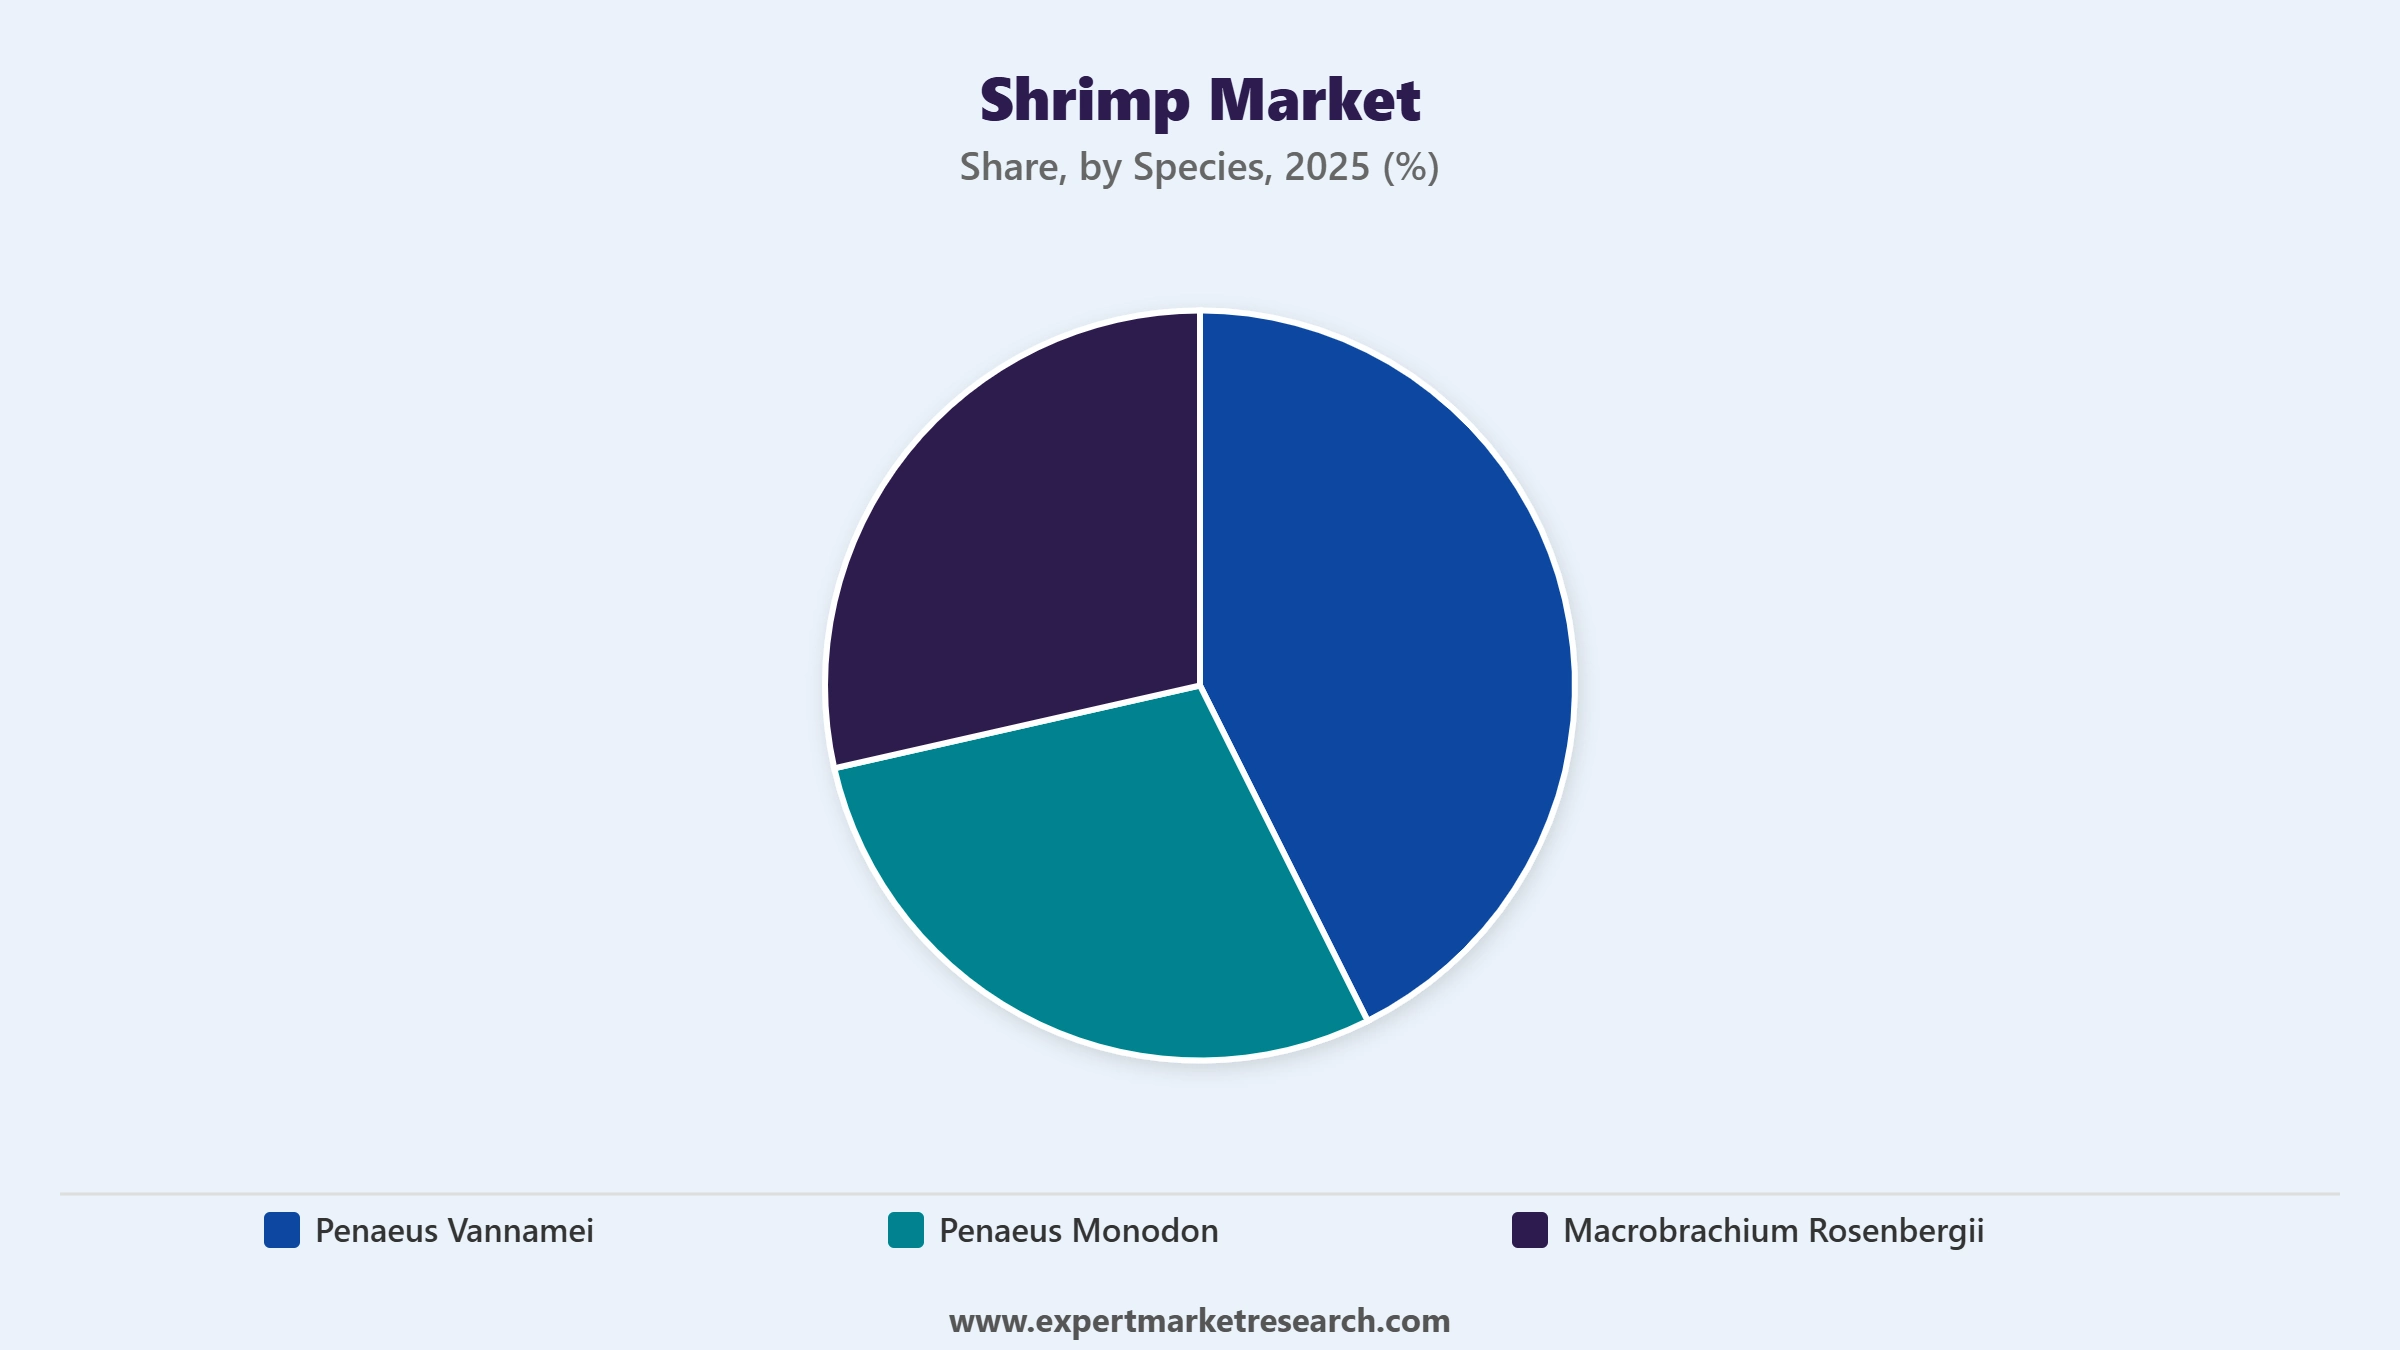
Market Breakup by Species
Key Insight: Penaeus vannamei dominates the species segment with mass aquaculture production in Ecuador, India, Vietnam, China, Indonesia, and Thailand. Penaeus monodon black tiger shrimp anchors premium pricing, with India exports rising sharply. Macrobrachium rosenbergii contributes incremental volumes in freshwater aquaculture. Species mix continues to evolve with biosecure farming, feed innovation, and premium export market demand.
Market Breakup by Product Category
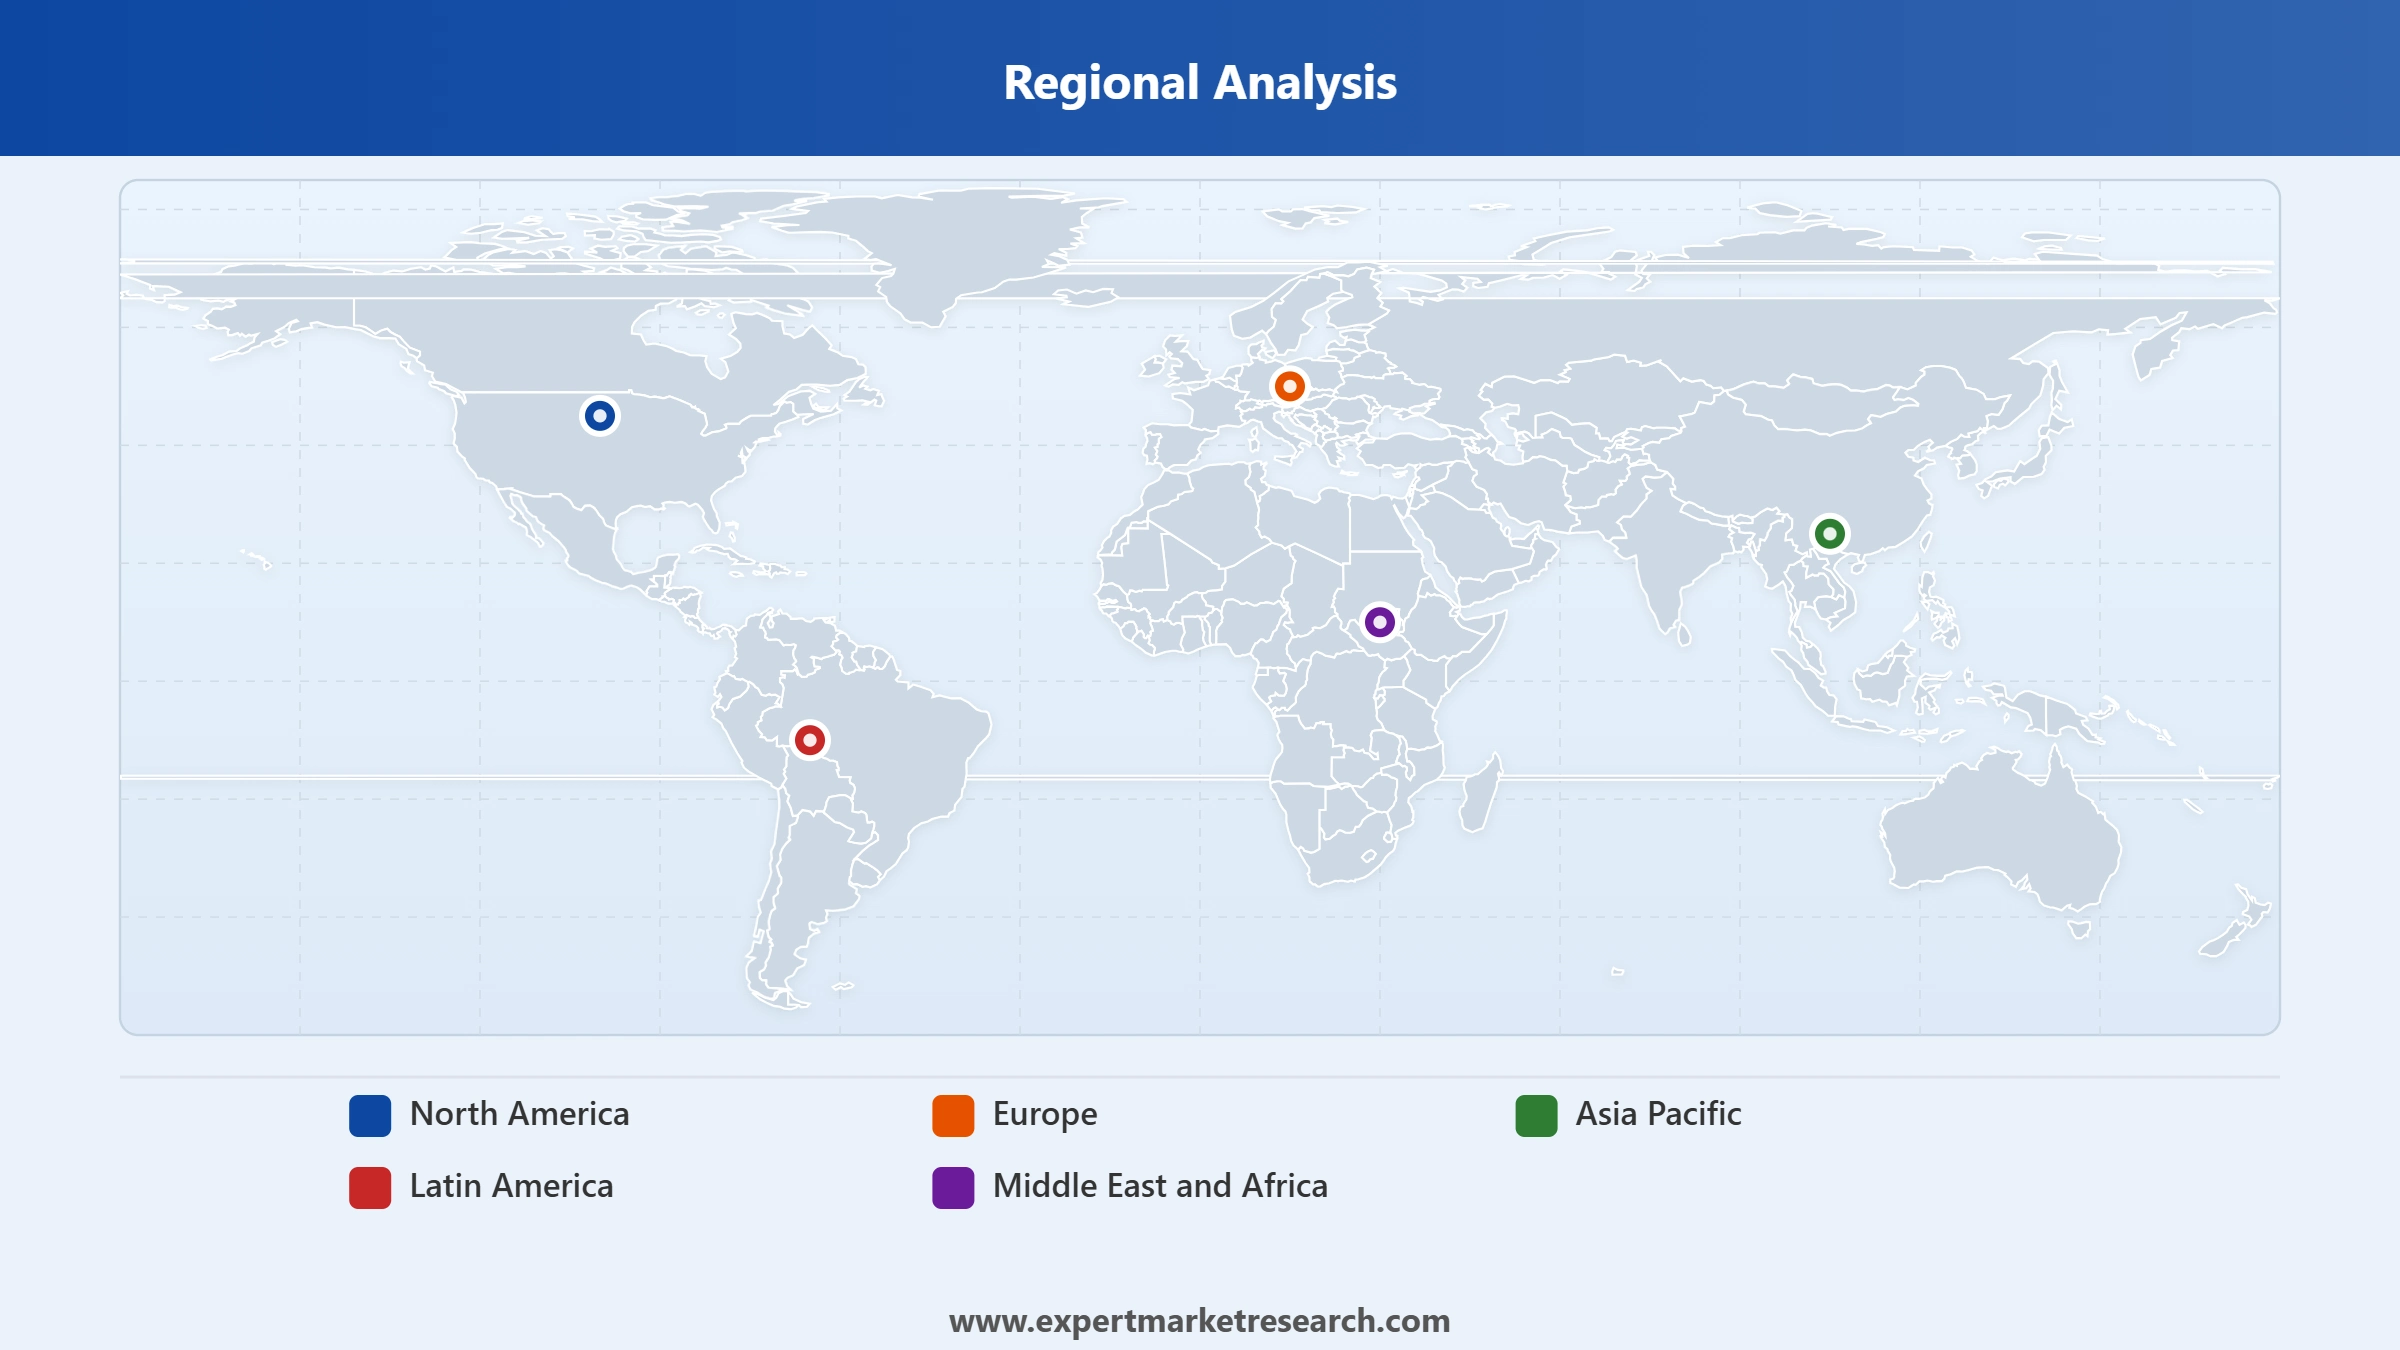
Market Breakup by Region
Key Insight: Asia Pacific dominates the global shrimp market on the back of India, Vietnam, China, Indonesia, and Thailand aquaculture and processing. Worth highlighting here is that latin America anchors Ecuador shrimp production, with rapid export volume growth to China, the US, and Europe. North America is anchored by mass retail and HoReCa frozen shrimp demand. Europe contributes through premium frozen and value added shrimp consumption. Middle East and Africa are emerging on hospitality and modern retail demand.


Read more about this report - REQUEST FREE SAMPLE COPY IN PDF
By Type, White Shrimp dominates the market due to Penaeus vannamei aquaculture in Ecuador, India, and Vietnam
White shrimp lead the global shrimp market on Penaeus vannamei aquaculture production in Ecuador, India, Vietnam, China, Indonesia, and Thailand. January 2026 Ecuador 276 million pounds export volume up 23 percent year on year illustrates the scale and momentum of Latin American white shrimp exports to global markets.
Pink shrimp anchor Mexican and Mediterranean wild capture and aquaculture, while brown shrimp lead Gulf of Mexico and North Sea wild capture. Other species including Macrobrachium rosenbergii contribute incremental volumes. February 2026 Thai Union USD 55 million Ecuador feed plant investment further supports global shrimp market growth across white shrimp aquaculture.
Read more about this report - REQUEST FREE SAMPLE COPY IN PDF
By Form, Frozen accounts for the dominant share of the market due to broad supermarket, hypermarket, and HoReCa distribution and cold chain availability
Frozen shrimp dominate the form segment, pointing to the essential role of cold chain logistics in enabling global shrimp trade from major producing nations in Ecuador, India, Thailand, and Vietnam to consuming markets across North America, Europe, Japan, and China. Mass supermarket and hypermarket frozen seafood assortments, HoReCa procurement, and the growth of premium value-added breaded, marinated, and ready-to-cook shrimp formats continue to expand the frozen segment's volume base.
Canned shrimp retain relevance in shelf-stable retail, foodservice, and ready-meal applications, especially in markets with limited cold chain infrastructure. The convenience of long shelf life and ambient storage supports canned shrimp's ongoing presence in mid-tier retail and institutional catering channels across emerging and developed markets alike.
Read more about this report - REQUEST FREE SAMPLE COPY IN PDF
By End-User, Commercial accounts for the dominant share of the market due to hotel, restaurant, QSR, and institutional buyer demand for large frozen and fresh shrimp volumes
Commercial end use leads the global shrimp market, with hotels, restaurants, quick-service restaurant chains, and institutional buyers such as airline caterers and corporate canteens driving large-volume procurement of frozen and fresh shrimp. The global growth of seafood-oriented dining, sushi and seafood chain proliferation, and premium hotel buffet programming continue to support commercial end-user demand across all major geographies.
Residential end use anchors mass retail household demand, aided by modern supermarket and hypermarket frozen shrimp assortments. Both segments are more and more specifying premium Penaeus monodon black tiger and Penaeus vannamei white shrimp from Ecuador, India, and Vietnam, with sustainability certifications and supply chain traceability programmes becoming a key selection criterion across both commercial and residential channels.
Read more about this report - REQUEST FREE SAMPLE COPY IN PDF
By Distribution Channel, Hypermarkets and Supermarkets account for the dominant share of the market due to broad frozen shrimp assortments across mass and premium SKUs
Hypermarkets and supermarkets lead distribution in the global shrimp market, providing broad frozen shrimp assortments across mass commodity and premium value-added SKUs. Their combination of wide cold chain infrastructure, high consumer foot traffic, and the ability to merchandise diverse shrimp varieties, sizes, and preparation formats makes them the primary household and retail distribution pathway across all major consuming markets.
Hotels and restaurants anchor commercial distribution demand, representing a worth noting volume pool for large-format frozen and fresh shrimp procurement. On balance, online sales channels are the fastest growing distribution pool, aided by quick commerce platforms, premium direct-to-consumer seafood brands, and the digitisation of HoReCa procurement. Specialty seafood stores and convenience stores serve premium and impulse demand segments.
Read more about this report - REQUEST FREE SAMPLE COPY IN PDF
By Species, Penaeus Vannamei accounts for the dominant share of the market due to mass aquaculture production
Penaeus vannamei dominates the global shrimp market with mass aquaculture production across Ecuador, India, Vietnam, China, Indonesia, and Thailand. April 2026 Avanti Feeds USD 3 million investment for a 10 percent stake in Thai Union Feedmill Ecuador illustrates how Indian companies are participating in Latin American Penaeus vannamei feed and aquaculture supply chain.
Penaeus monodon black tiger shrimp is the next worth noting species, with India exports rising nearly tenfold from 6,059 tons in 2020 to 58,221 tons in 2025. Macrobrachium rosenbergii contributes incremental volumes in freshwater aquaculture. Together these species support global shrimp market growth across mass and premium retail and HoReCa channels.
Read more about this report - REQUEST FREE SAMPLE COPY IN PDF
Asia Pacific dominates the market due to aquaculture production and processing capacity
Asia Pacific leads the global shrimp market on the back of India, Vietnam, China, Indonesia, and Thailand aquaculture production and processing capacity, with January 2026 India Penaeus monodon black tiger shrimp growth pointing to strong premium export growth and Andhra Pradesh and Tamil Nadu farm investments. Vietnam targets USD 11.5 billion fishing industry export turnover for 2026, aided by stabilising raw material sources and value added processing.
Latin America is the fastest growing region on Ecuador shrimp production, exemplified by the January 2026 Ecuador 276 million pounds export volume up 23 percent year on year and February 2026 Thai Union USD 55 million feed plant investment. North America is anchored by US and Canadian mass retail and HoReCa demand. Europe contributes through premium frozen consumption, while Middle East and Africa are emerging on hospitality demand, supporting global shrimp market growth.
Read more about this report - REQUEST FREE SAMPLE COPY IN PDF
The global shrimp market is fragmented with global integrated seafood majors, Ecuadorean and Asian aquaculture leaders, and large processors and exporters competing across white, pink, brown, and black tiger shrimp species. Competitive priorities revolve around aquaculture feed integration, biosecure farming, value added processing, and modern retail and HoReCa distribution.
Companies are differentiating through aquaculture feed investments, biosecure farming, processing scale, and global distribution. Strategic moves include the April 2026 Avanti Feeds stake in Thai Union Feedmill Ecuador, February 2026 Thai Union USD 55 million Ecuador feed plant announcement, and ongoing investments in India Penaeus monodon and Vietnam value added shrimp processing.
Founded in 1978 and headquartered in Bangkok, Thailand, the company is a leading global integrated agribusiness and food company with major shrimp aquaculture, feed, and processing operations across Thailand, Vietnam, India, China, and the United States, supplying value added frozen shrimp products to global retail, HoReCa, and industrial food customers.
Founded in 1990 and headquartered in Madrid, Spain, the company is a leading Spanish frozen seafood processor and importer with worth noting frozen shrimp portfolio sourced from Latin American, Asian, and African producers. Its operations supply Spanish, European, and select global retail, HoReCa, and food processing customers across premium and mass frozen shrimp SKUs.
Founded in 2002 and headquartered in Qingdao, China, the company is a Chinese seafood processor and exporter with worth noting frozen shrimp, fish, and value added seafood products. Its operations supply Chinese, US, EU, and Japanese retail, HoReCa, and food processing customers, with sourcing from Asian aquaculture suppliers and Chinese coastal processing.
Founded in 1981 and headquartered in Seattle, Washington, the company is a major US frozen seafood importer and processor with broad value added shrimp portfolio sourced globally. Its operations supply US retail, HoReCa, club store, and food processing customers across mass and premium frozen shrimp SKUs, with sustainability and traceability programmes.
Other leading companies in the market are Pacific Seafood, Santa Priscila, Thai Union Group PCL, Avanti Feeds Ltd., Clearwater Seafoods Inc., High Liner Foods Inc., Marine Harvest, Maruha Nichiro Corporation, Nippon Suisan Kaisha, Nordic Seafoods A/S, Surapon Foods, and Others.
*Please note that this is only a partial list; the complete list of key players is available in the full report. Additionally, the list of key players can be customized to better suit your needs.*
Discover the latest insights on the global shrimp market 2026 with our comprehensive report. Stay ahead of the curve with valuable data on product innovations, consumer demand, and top growth regions. Whether you are launching a new product or expanding your brand, this report gives you the clarity you need. Download your free sample now and discover the key opportunities in the thriving Global Shrimp.
Upto 15% Off
USD
$2999 $2699
$4839 $4355
$5999 $5099
$7259 $6170


*While we strive to always give you current and accurate information, the numbers depicted on the website are indicative and may differ from the actual numbers in the main report. At Expert Market Research, we aim to bring you the latest insights and trends in the market. Using our analyses and forecasts, stakeholders can understand the market dynamics, navigate challenges, and capitalize on opportunities to make data-driven strategic decisions.*
The global shrimp market attained a volume of 8.59 Million Tons in 2025.
The market is assessed to grow at a CAGR of 6.30% between 2026 and 2035.
The market is estimated to witness healthy growth in the forecast period of 2026-2035 to reach a volume of around 15.82 Million Tons by 2035.
The key drivers for the market include rising population, increasing demand from the food industry, growing disposable incomes, and the escalating demand for frozen shrimp products.
The rising health consciousness among the consumers and the growing awareness about the nutritious content of shrimp are the key trends in the market.
The major regions in the market are North America, Europe, the Asia Pacific, Latin America, and the Middle East and Africa.
The major species in the market are Penaeus Vannamei, Penaeus Monodon, and Macrobrachium Rosenbergii, among others.
The animal's shell is made of chitin, a thin yet stiff exoskeleton material. They do not belong to the family of fish because they lack an inner skeleton. They belong to the same family as crabs and lobsters and have ten legs.
Prawns and shrimp are very different animals. While both shrimp and prawns are decapods, or animals with 10 legs and an external skeleton, shrimp belong to the Pleocyemata suborder and prawns to the Dendrobranchiata suborder.
The major players in the market are Mazzetta Company, LLC, Apex Frozen Foods Ltd., Seaprimexco Vietnam, Liveris Afentoulis & Co., Grand Ocean Seafoods Co., Ltd, Charoen Pokphand Foods PCL, Grupo Iberica Congelados, S.A, Ocean More Foods Co., Limited, Aqua Star, Pacific Seafood, Santa Priscila, Thai Union Group PCL, Avanti Feeds Ltd., Clearwater Seafoods Inc., High Liner Foods Inc., Marine Harvest, Maruha Nichiro Corporation, Nippon Suisan Kaisha, Nordic Seafoods A/S, and Surapon Foods, among others.
The white shrimp segment is expected to be the leading segment in this market during the forecast period.
The Asia-Pacific region held the highest market share in 2026.
Rising seafood consumption, aquaculture advancements, and sustainability initiatives drive adoption.
The shrimp market is experiencing steady growth due to expanding global demand.
Explore our key highlights of the report and gain a concise overview of key findings, trends, and actionable insights that will empower your strategic decisions.
| REPORT FEATURES | DETAILS |
| Base Year | 2025 |
| Historical Period | 2019-2025 |
| Forecast Period | 2026-2035 |
| Scope of the Report |
Historical and Forecast Trends, Industry Drivers and Constraints, Historical and Forecast Market Analysis by Segment:
|
| Breakup by Type |
|
| Breakup by Form |
|
| Breakup by End-User |
|
| Breakup by Distribution Channel |
|
| Breakup by Species |
|
| Breakup by Product Category |
|
| Breakup by Region |
|
| Market Dynamics |
|
| Competitive Landscape |
|
| Companies Covered |
|
Datasheet
One User
USD 2,999
USD 2,699
tax inclusive*
Single User License
One User
USD 4,839
USD 4,355
tax inclusive*
Five User License
Five User
USD 5,999
USD 5,099
tax inclusive*
Corporate License
Unlimited Users
USD 7,259
USD 6,170
tax inclusive*
*Please note that the prices mentioned below are starting prices for each bundle type. Kindly contact our team for further details.*
Flash Bundle
Small Business Bundle
Growth Bundle
Enterprise Bundle
*Please note that the prices mentioned below are starting prices for each bundle type. Kindly contact our team for further details.*
Flash Bundle
Number of Reports: 3
20%
tax inclusive*
Small Business Bundle
Number of Reports: 5
25%
tax inclusive*
Growth Bundle
Number of Reports: 8
30%
tax inclusive*
Enterprise Bundle
Number of Reports: 10
35%
tax inclusive*
How To Order

Select License Type
Choose the right license for your needs and access rights.

Click on ‘Buy Now’
Add the report to your cart with one click and proceed to register.

Select Mode of Payment
Choose a payment option for a secure checkout. You will be redirected accordingly.
Strategic Solutions for Informed Decision-Making
Gain insights to stay ahead and seize opportunities.

Get insights & trends for a competitive edge.

Track prices with detailed trend reports.

Analyse trade data for supply chain insights.

Leverage cost reports for smart savings

Enhance supply chain with partnerships.

Connect For More Information
Our expert team of analysts will offer full support and resolve any queries regarding the report, before and after the purchase.
Our expert team of analysts will offer full support and resolve any queries regarding the report, before and after the purchase.
We employ meticulous research methods, blending advanced analytics and expert insights to deliver accurate, actionable industry intelligence, staying ahead of competitors.
Our skilled analysts offer unparalleled competitive advantage with detailed insights on current and emerging markets, ensuring your strategic edge.
We offer an in-depth yet simplified presentation of industry insights and analysis to meet your specific requirements effectively.


