

Consumer Insights
Uncover trends and behaviors shaping consumer choices today
Procurement Insights
Optimize your sourcing strategy with key market data
Industry Stats
Stay ahead with the latest trends and market analysis.
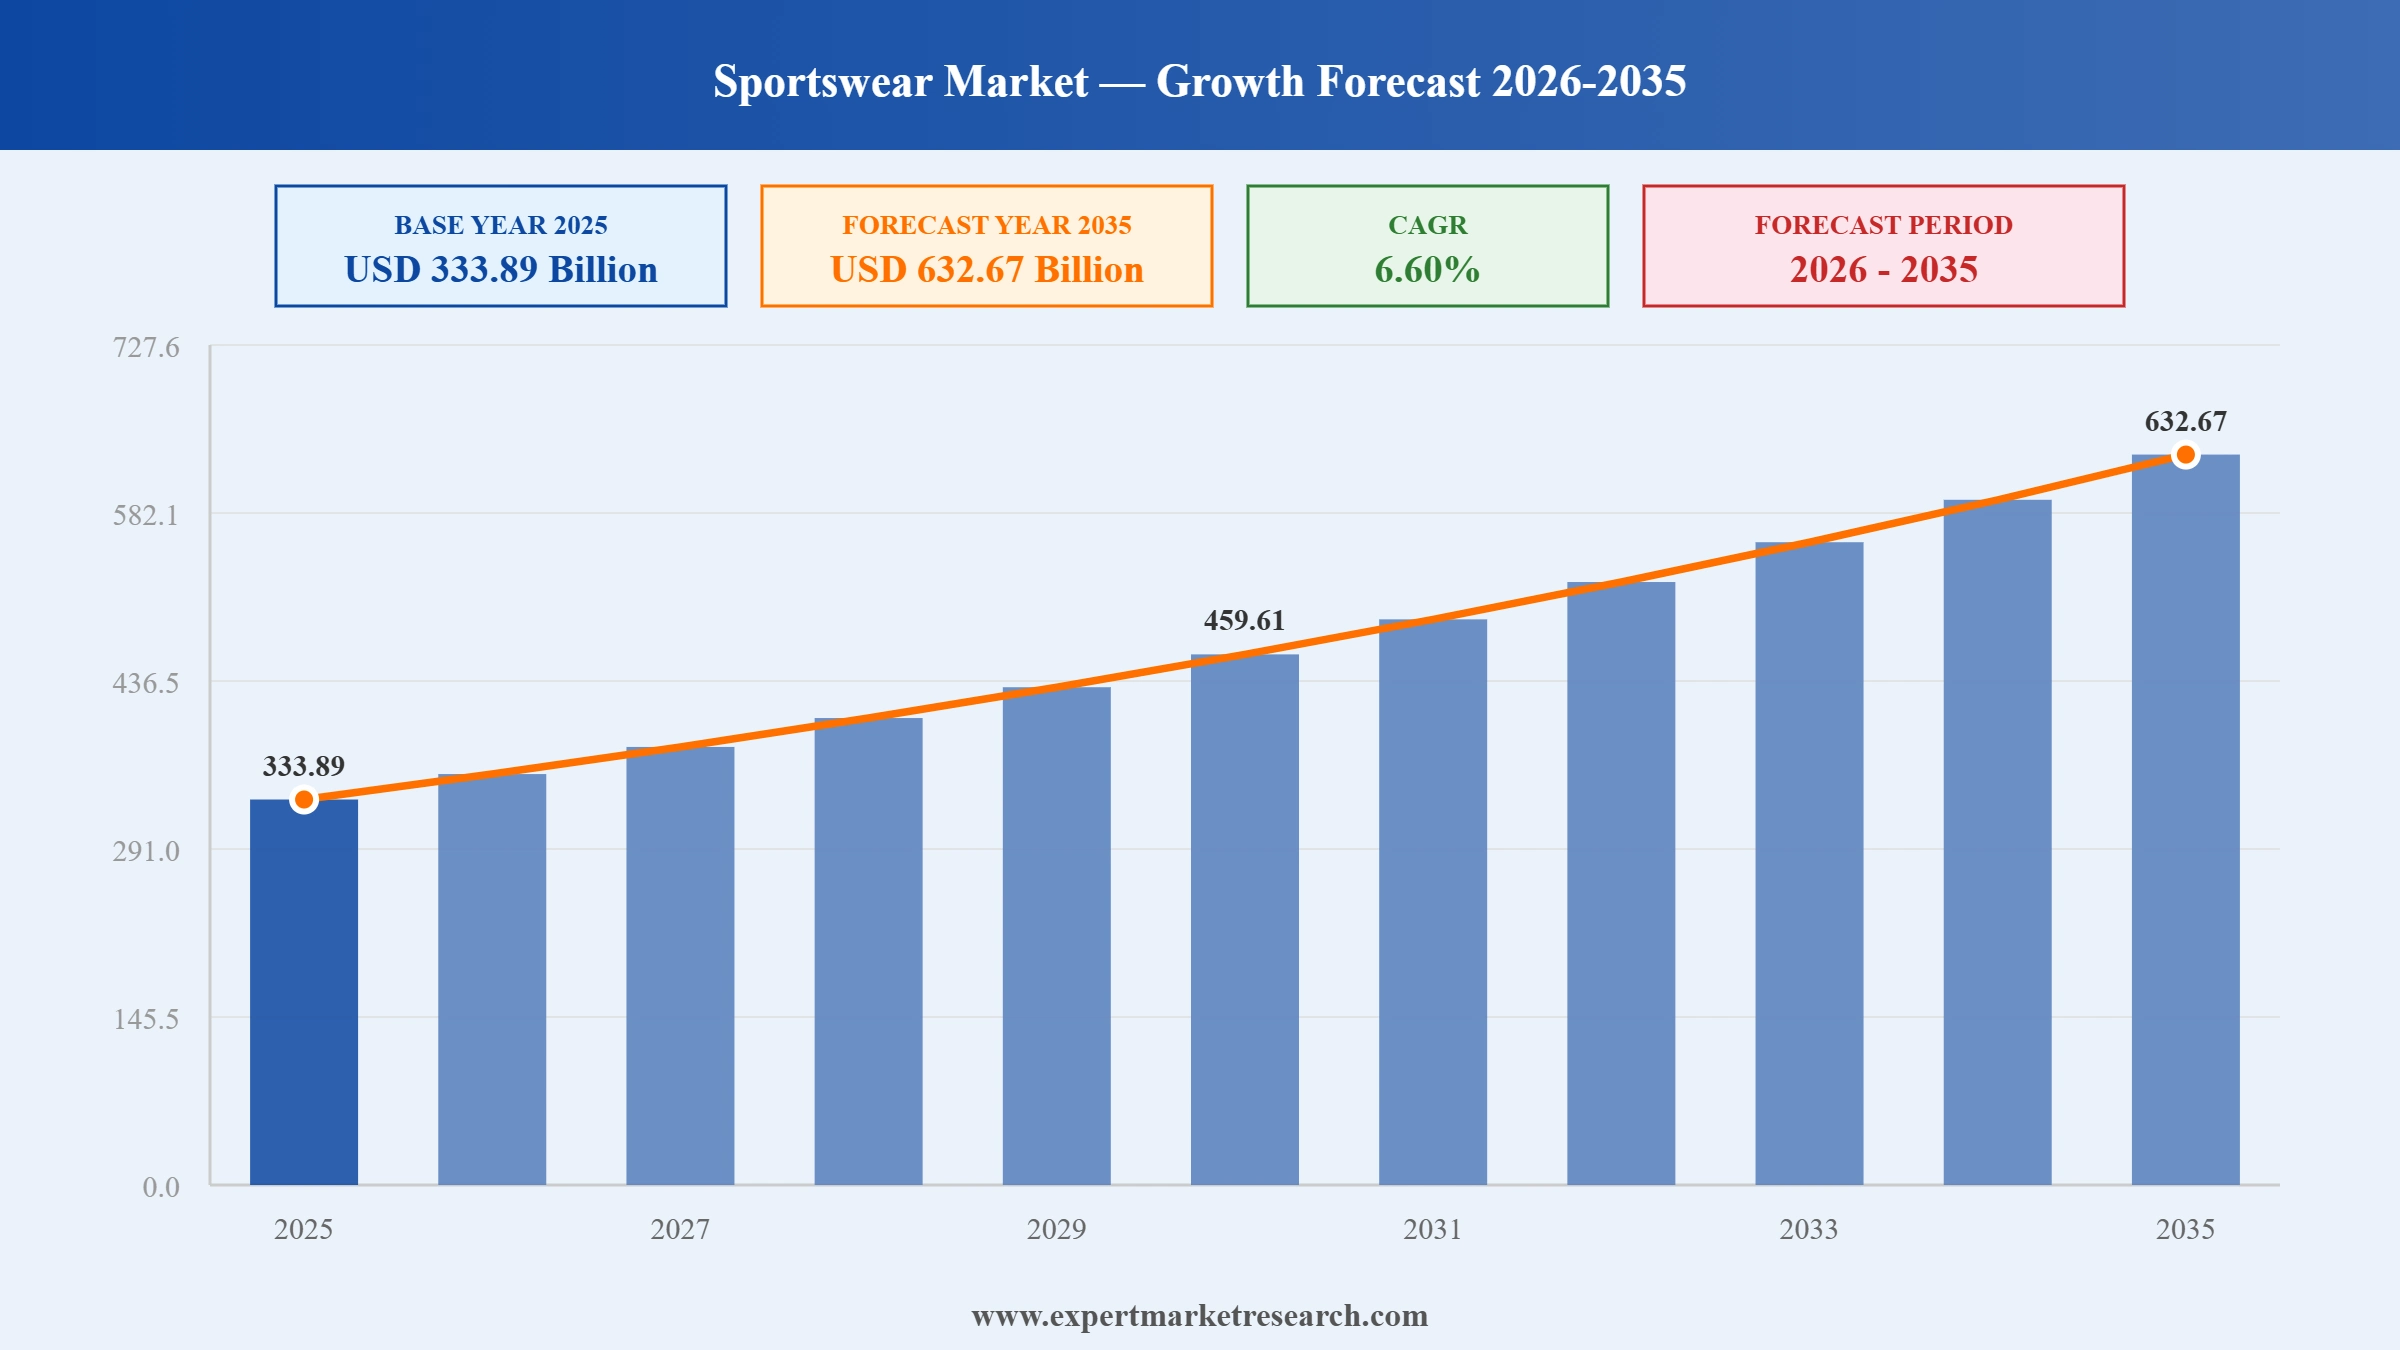
The global sportswear market reached a value of USD 333.89 Billion at 2025 and is projected to expand at a CAGR of around 6.60% during the forecast period of 2026-2035. With rising health consciousness and active lifestyle adoption across major global markets, the growing mainstream penetration of athleisure as an everyday fashion category, the rapid expansion of direct-to-consumer and e-commerce distribution channels, and increasing participation in both recreational and professional sports worldwide, the market is expected to reach USD 632.67 Billion by 2035.
Read more about this report - REQUEST FREE SAMPLE COPY IN PDF
| Global Sportswear Market Report Summary | Description | Value |
| Base Year | USD Billion | 2025 |
| Historical Period | USD Billion | 2019-2025 |
| Forecast Period | USD Billion | 2026-2035 |
| Market Size 2025 | USD Billion | 333.89 |
| Market Size 2035 | USD Billion | 632.67 |
| CAGR 2019-2025 | Percentage | XX% |
| CAGR 2026-2035 | Percentage | 6.60% |
| CAGR 2026-2035 - Market by Region | North America | 5.4% |
| CAGR 2026-2035 - Market by Country | Brazil | 6.9% |
| CAGR 2026-2035 - Market by Country | UK | 5.1% |
| CAGR 2026-2035 - Market by End User | Women | 7.1% |
| CAGR 2026-2035 - Market by End Use | Online | 9.4% |
| Market Share by Country | UK | 7.4% |
The sportswear market is being shaped by the convergence of athleisure fashion and performance-driven consumer demand, with buyers expecting products that work equally well during a workout and a casual outing. Leading brands are channelling investment into sustainable materials, digital-first retail strategies, and expansion into high-growth emerging markets. These dynamics are intensifying competition between global incumbents and fast-rising regional champions, compressing timelines for product innovation and market entry.
Lululemon Athletica extended its performance footwear range in March 2025, introducing running and training styles designed to compete directly with established athletic shoe brands. The expansion strengthens Lululemon's product diversification and broadens its competitive position in the higher-volume performance footwear segment of the sportswear market.
Adidas AG released a new performance collection in November 2024 built around advanced recycled polyester and ocean-plastic-derived materials across key apparel and footwear lines. The launch deepens Adidas's sustainability credentials while expanding its appeal among environmentally aware athletic consumers in North America, Europe, and Asia Pacific.
ANTA Sports Products Limited announced an accelerated international distribution expansion in July 2024, utilising its multi-brand portfolio including Arc'teryx and Fila Korea to enter new markets in Europe and North America. The move signals ANTA's ambition to grow its global sportswear presence well beyond its dominant Chinese domestic position.
Nike, Inc. revealed an AI-assisted product design programme in February 2024, integrating athlete biomechanical data with materials science to accelerate footwear innovation. The initiative underlines Nike's commitment to technological leadership and reinforces its position at the forefront of performance product development in the sportswear market.
The sportswear market is benefiting from a broad cultural shift toward athleisure, where activewear is worn in everyday non-sport settings. Lululemon's consistent double-digit revenue growth through 2024 demonstrates how lifestyle-driven sportswear adoption is expanding total market demand well beyond traditional sports participation occasions.
Demand for sustainable sportswear is accelerating sportswear market growth as consumers prioritise brands with credible environmental commitments. Adidas's Primegreen line, manufactured from recycled ocean plastic across thousands of SKUs, illustrates how sustainability has evolved from a differentiating feature into a baseline consumer expectation for leading global brands.
Direct-to-consumer and e-commerce platforms are fundamentally changing how sportswear brands reach buyers worldwide. Nike's digital sales consistently exceeded 25% of total company revenue in recent fiscal years, reflecting the channel's growing commercial importance across mobile-first consumer markets in Asia Pacific, North America, and Europe.
Rising female participation in fitness, running, and recreational sports is significantly broadening the women's global sportswear segment. Adidas and Puma both reported double-digit growth in women's apparel categories in 2024, confirming the segment's transition from secondary priority to commercially central across most major sportswear brands' product strategies.
Asia Pacific is the fastest-growing region in the sportswear market, with China, India, and Southeast Asia leading volume gains. ANTA Sports and Li Ning substantially expanded their domestic retail networks in 2024, capitalising on youth fitness culture growth and rising middle-class consumer spending on performance athletic goods.
The report of Expert Market Research's titled "Sportswear market Report and Forecast 2026-2035" offers a detailed analysis of the market based on the following segments:
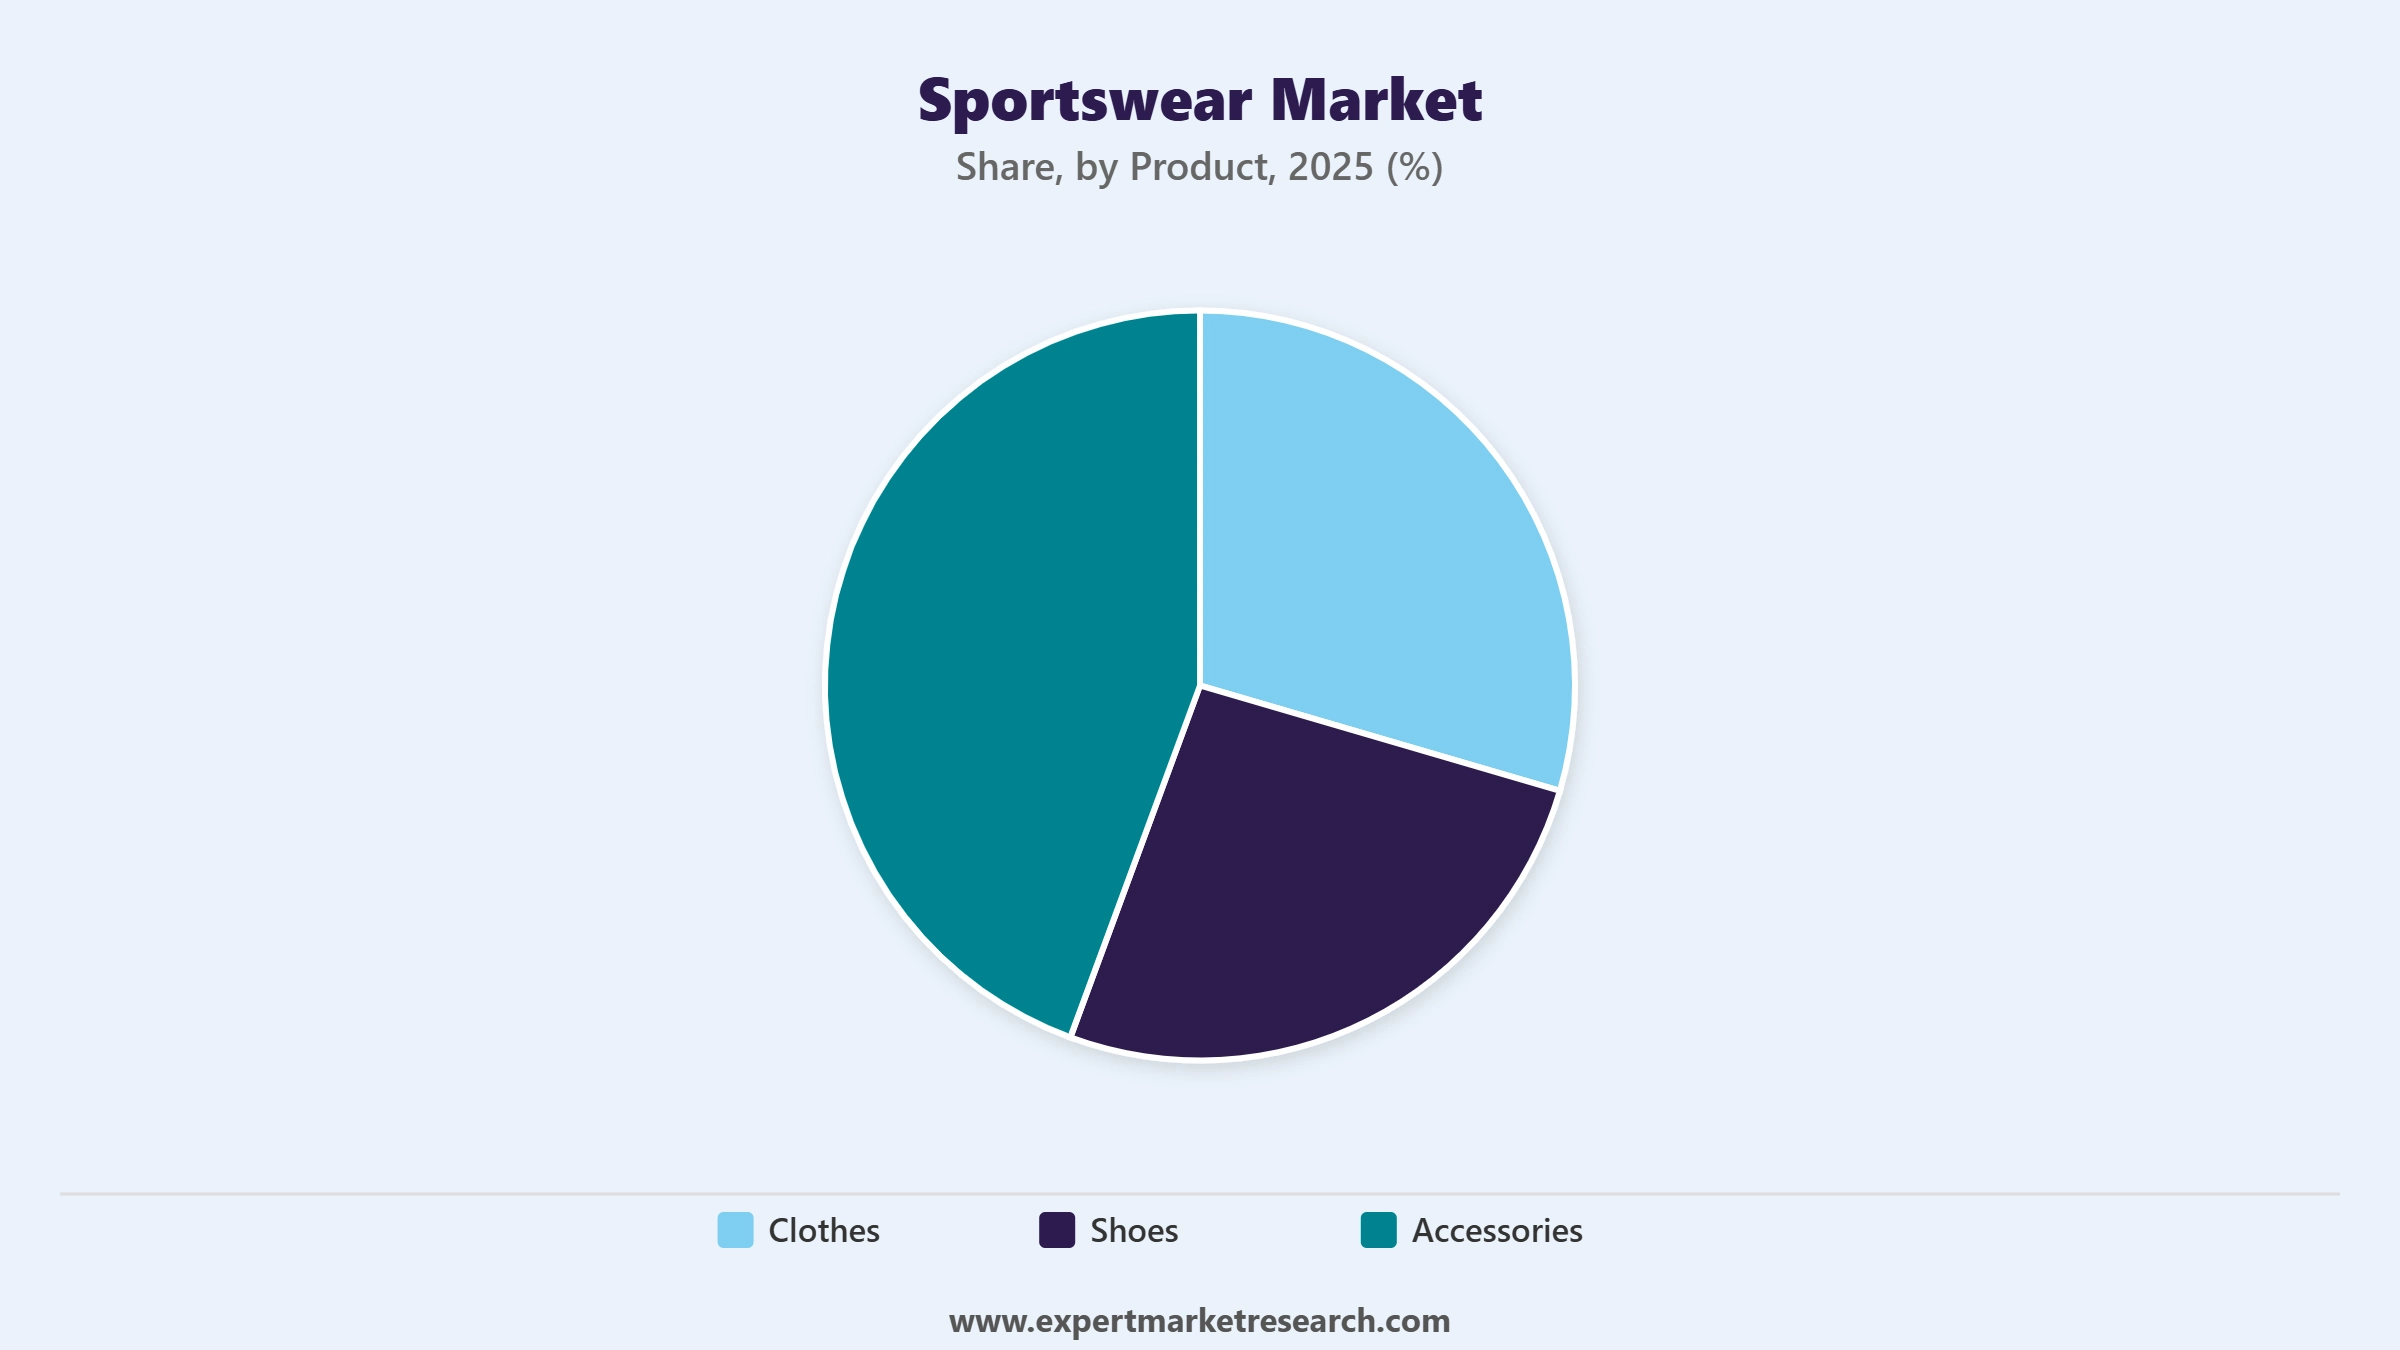
Market Breakup by Product
Key Insight: Clothes represent the dominant product category in the sportswear market, capturing the largest revenue share driven by widespread adoption of performance apparel across professional sports, gym-going, and everyday athleisure use. Brands such as Nike and Adidas generate the highest proportion of their apparel revenues from this segment. Shoes are the fastest-growing product type, propelled by continuous technology innovation in cushioning, energy return, and biomechanical design. Accessories, including sports bags and protective gear, support the category through complementary purchase occasions and brand extension strategies.
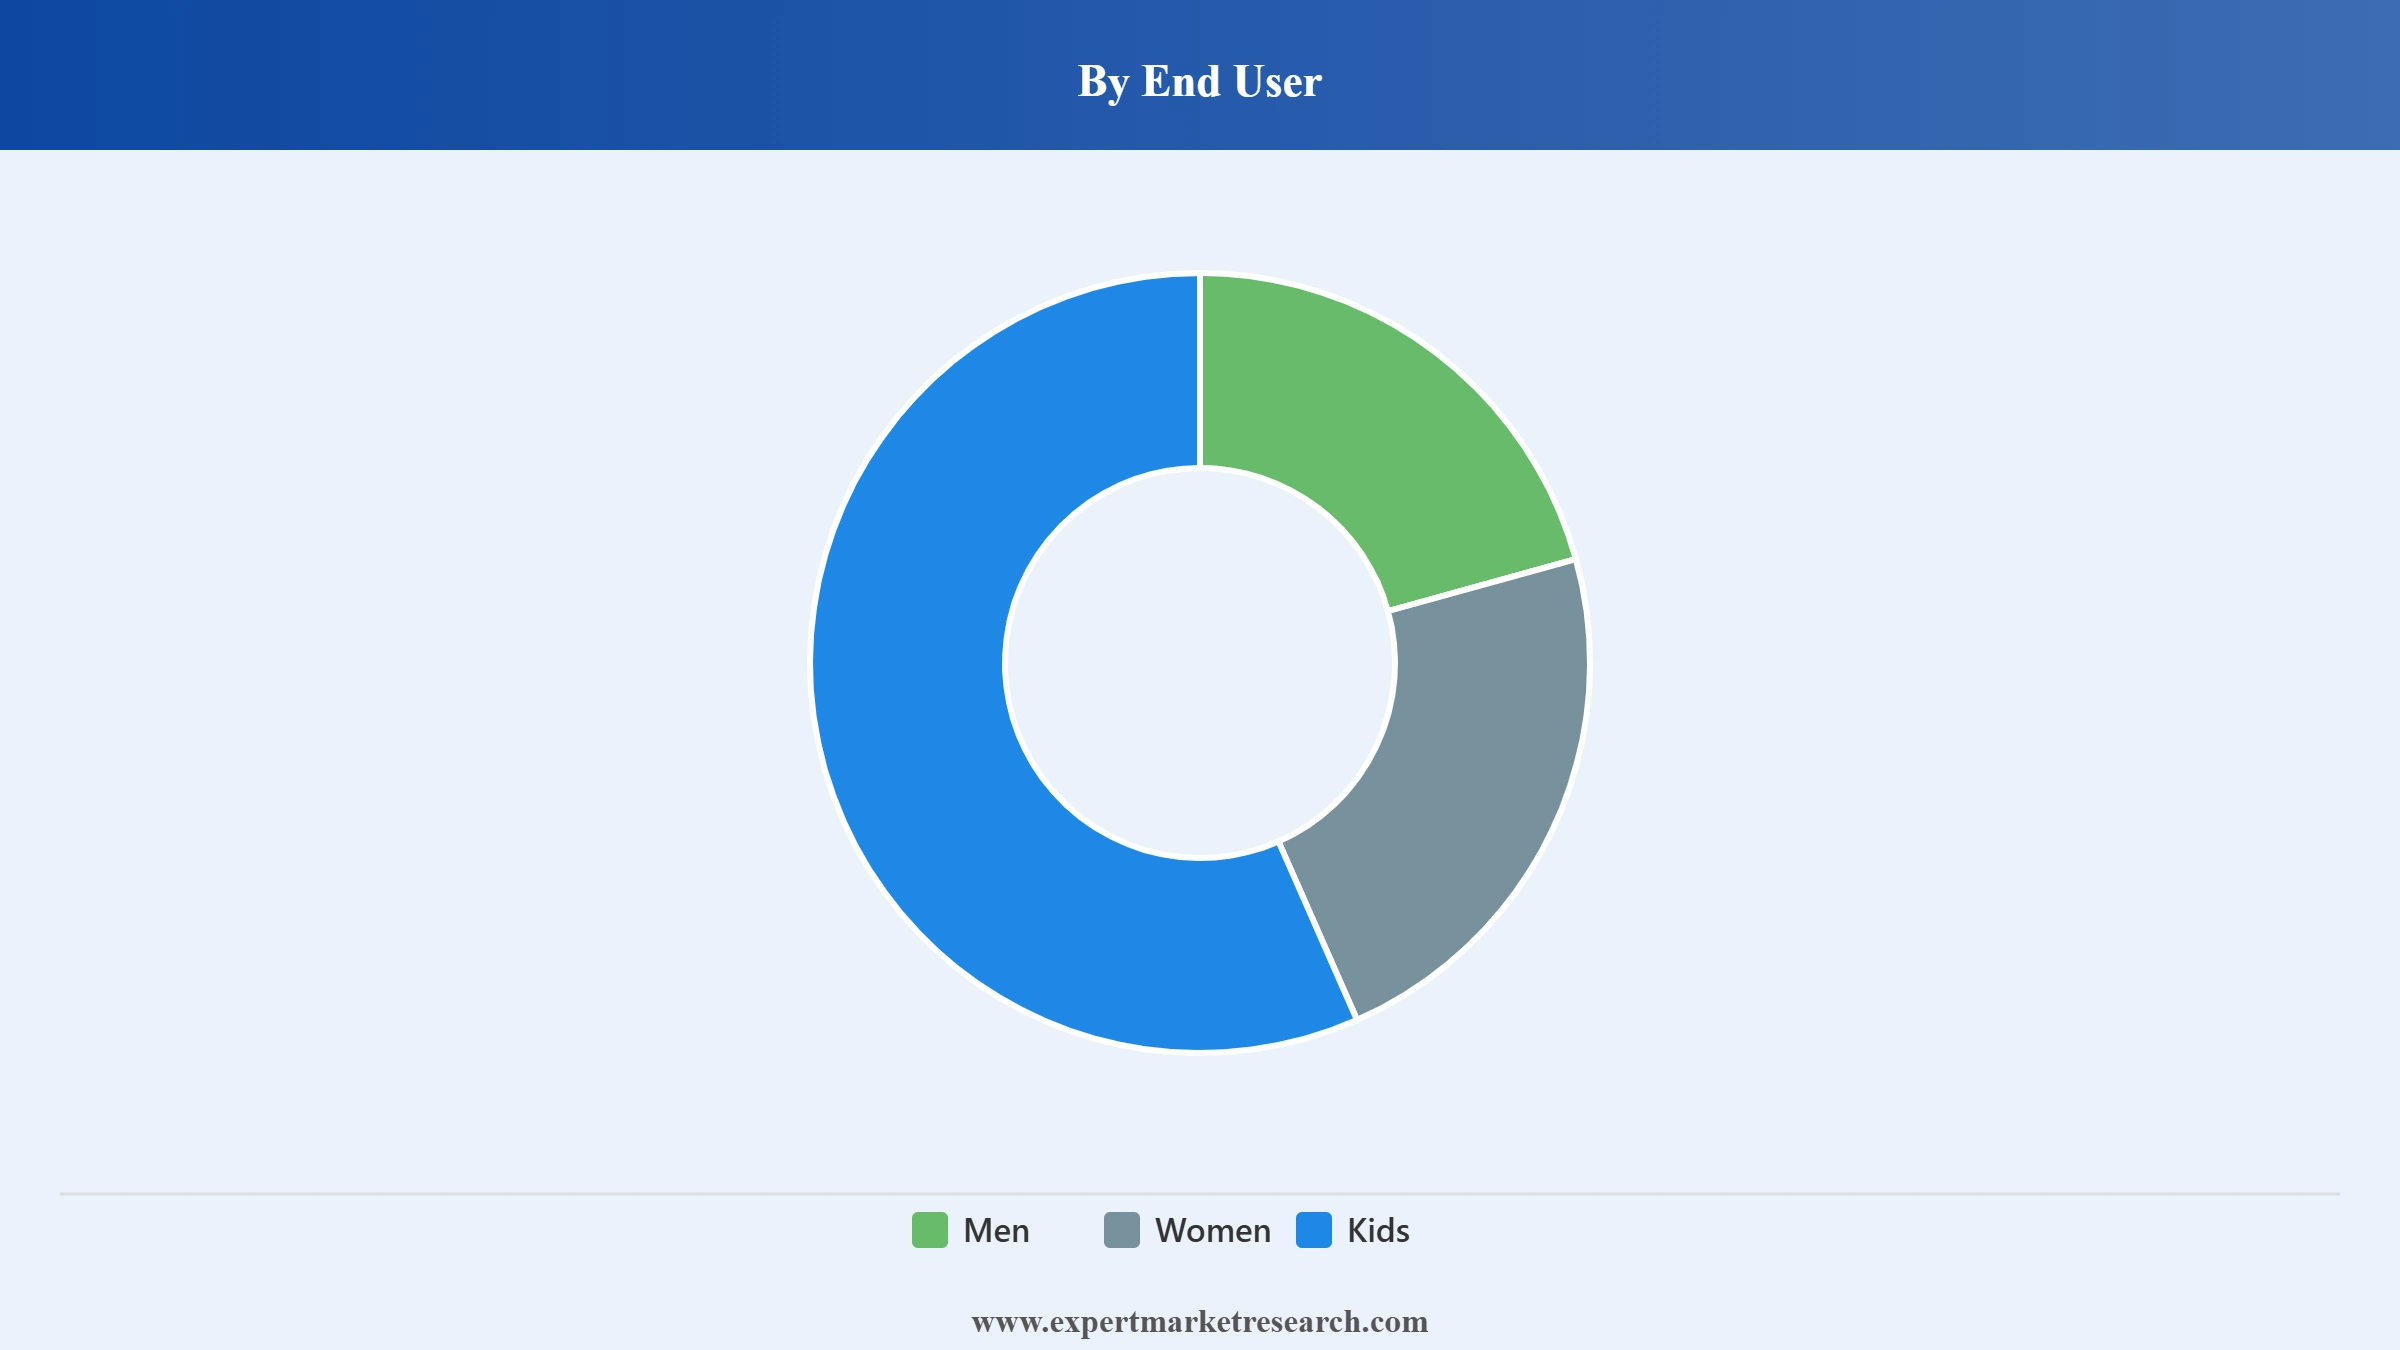
Market Breakup by End User
Key Insight: Men constitute the largest end-user segment in the sportswear market, driven by high participation in team sports, fitness activities, and the historical dominance of men's product lines across Nike, Adidas, and Puma. Women represent the highest-growth segment, with dedicated female product lines expanding rapidly as female participation in sports and fitness surges worldwide. Kids sportswear is growing steadily, supported by rising youth sports enrolment, school sports initiatives, and parents increasingly prioritising performance-oriented athletic apparel for children.
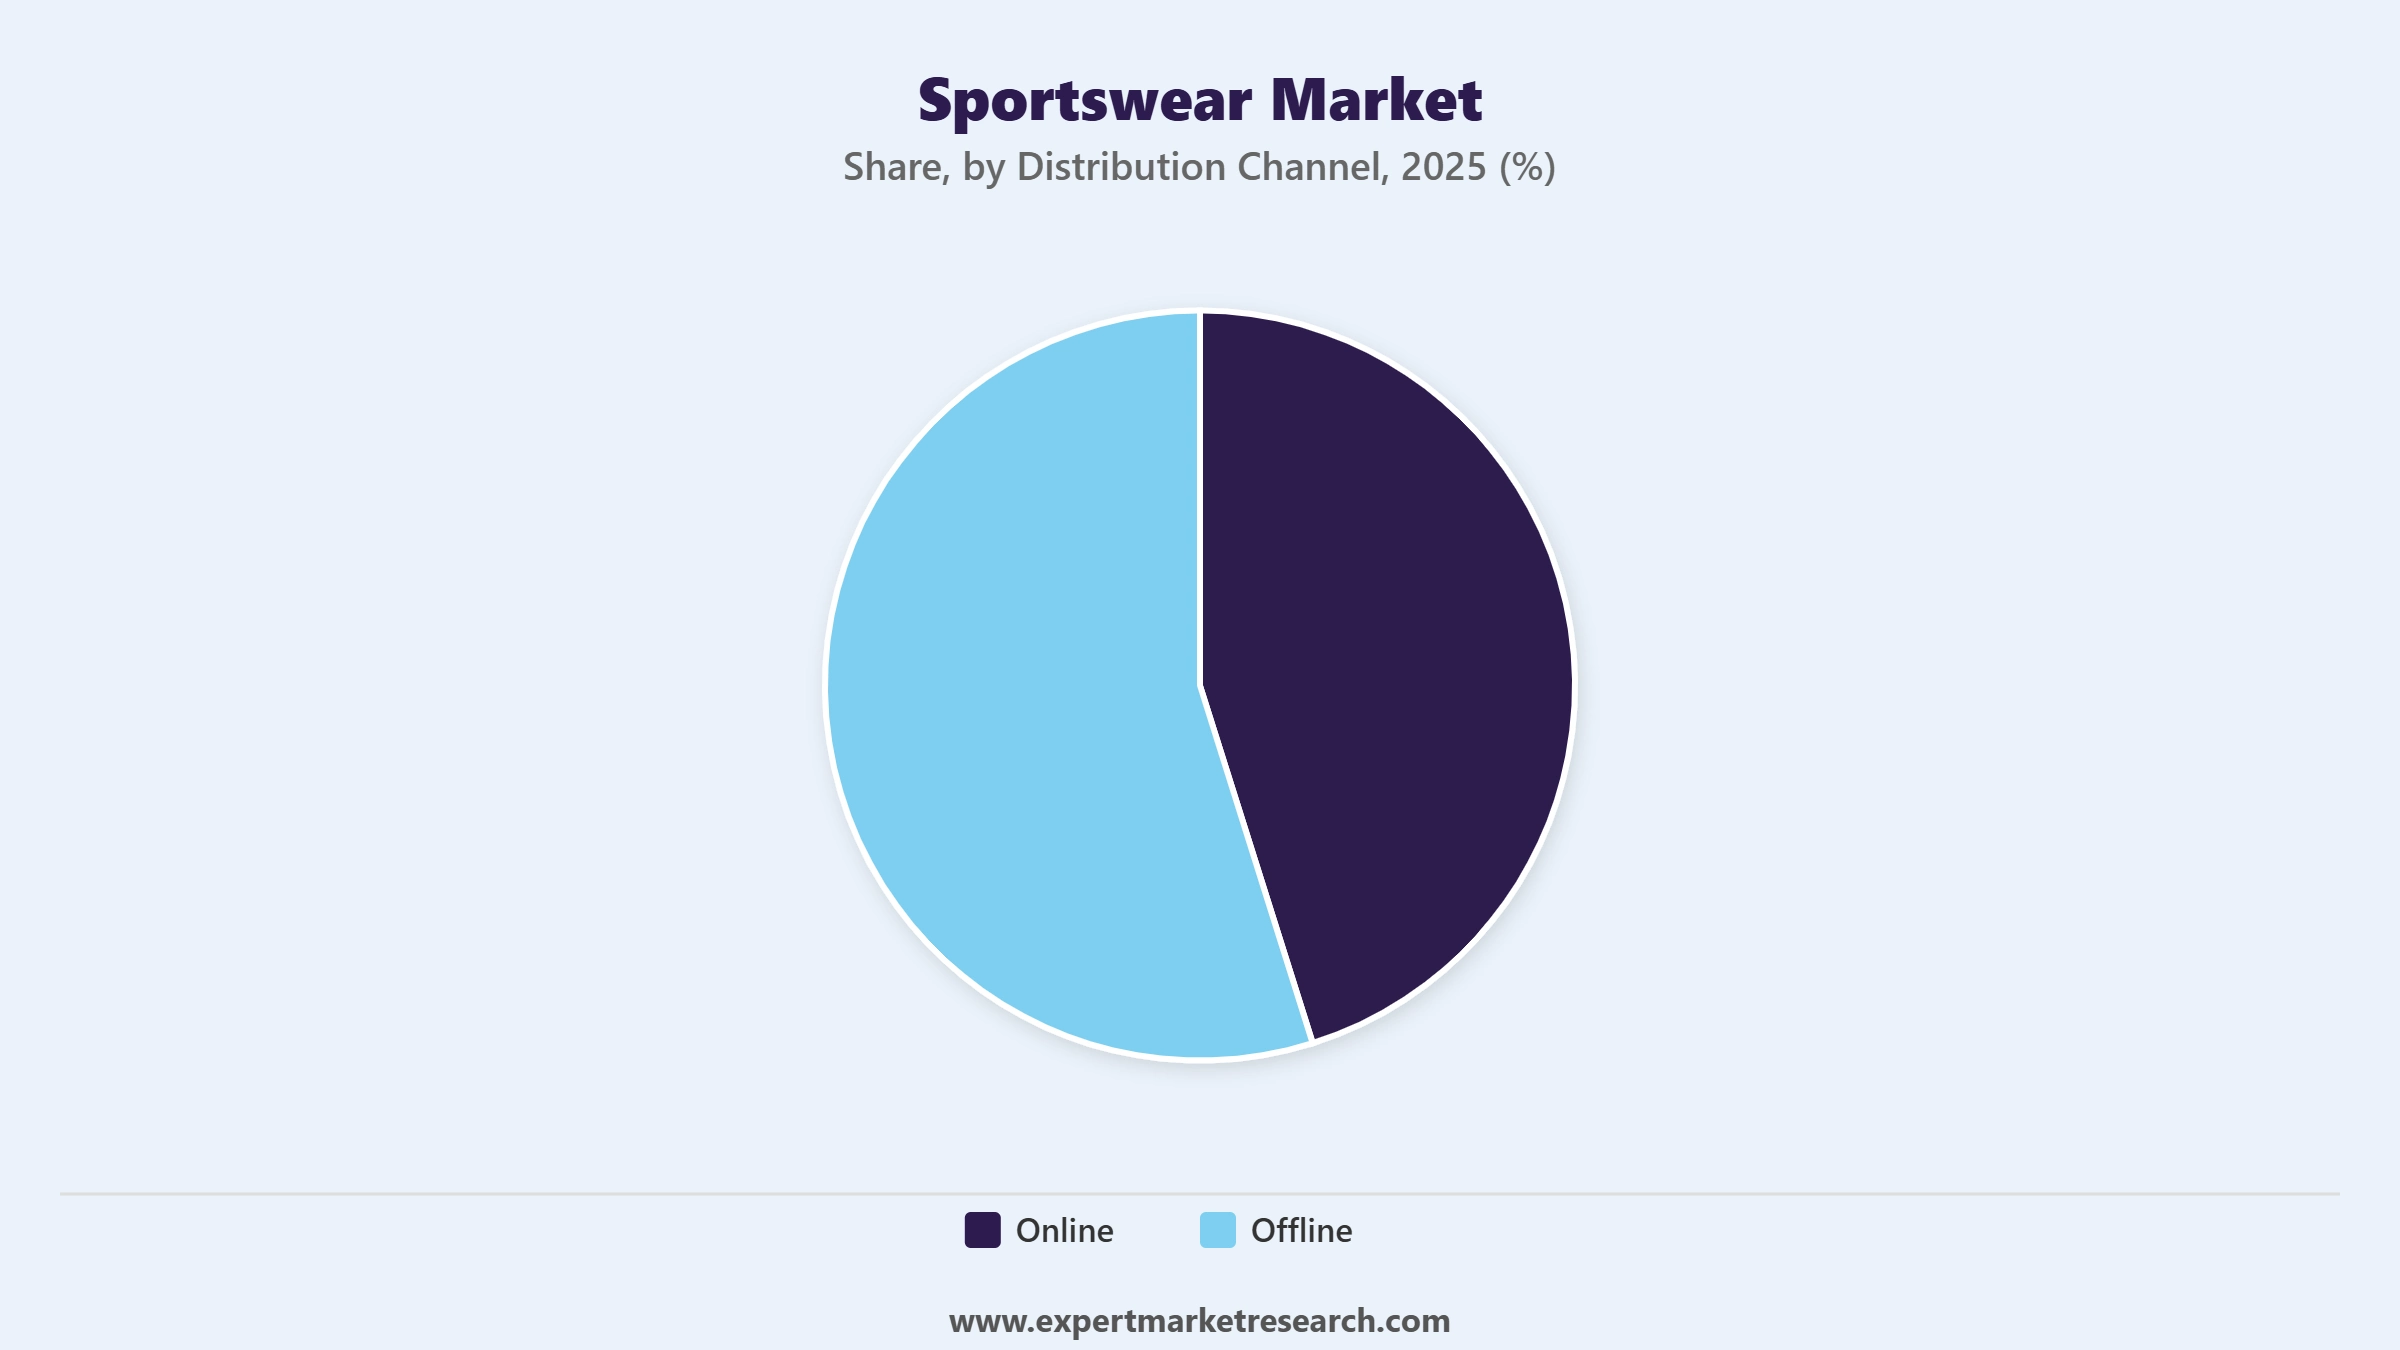
Market Breakup by Distribution Channel
Key Insight: Offline retail, encompassing branded stores, multi-brand sports retailers, and department stores, continues to hold the dominant distribution share in the sportswear market, providing the in-person experience critical for footwear fitting and apparel purchase decisions. Online channels are growing at a notably faster pace, driven by direct-to-consumer platform investments by Nike and Adidas, the expansion of global e-commerce marketplaces, and mobile-first shopping behaviour among younger consumers. The ongoing digital transformation of retail is gradually compressing offline share while elevating online revenue contribution year on year.
Market Breakup by Region
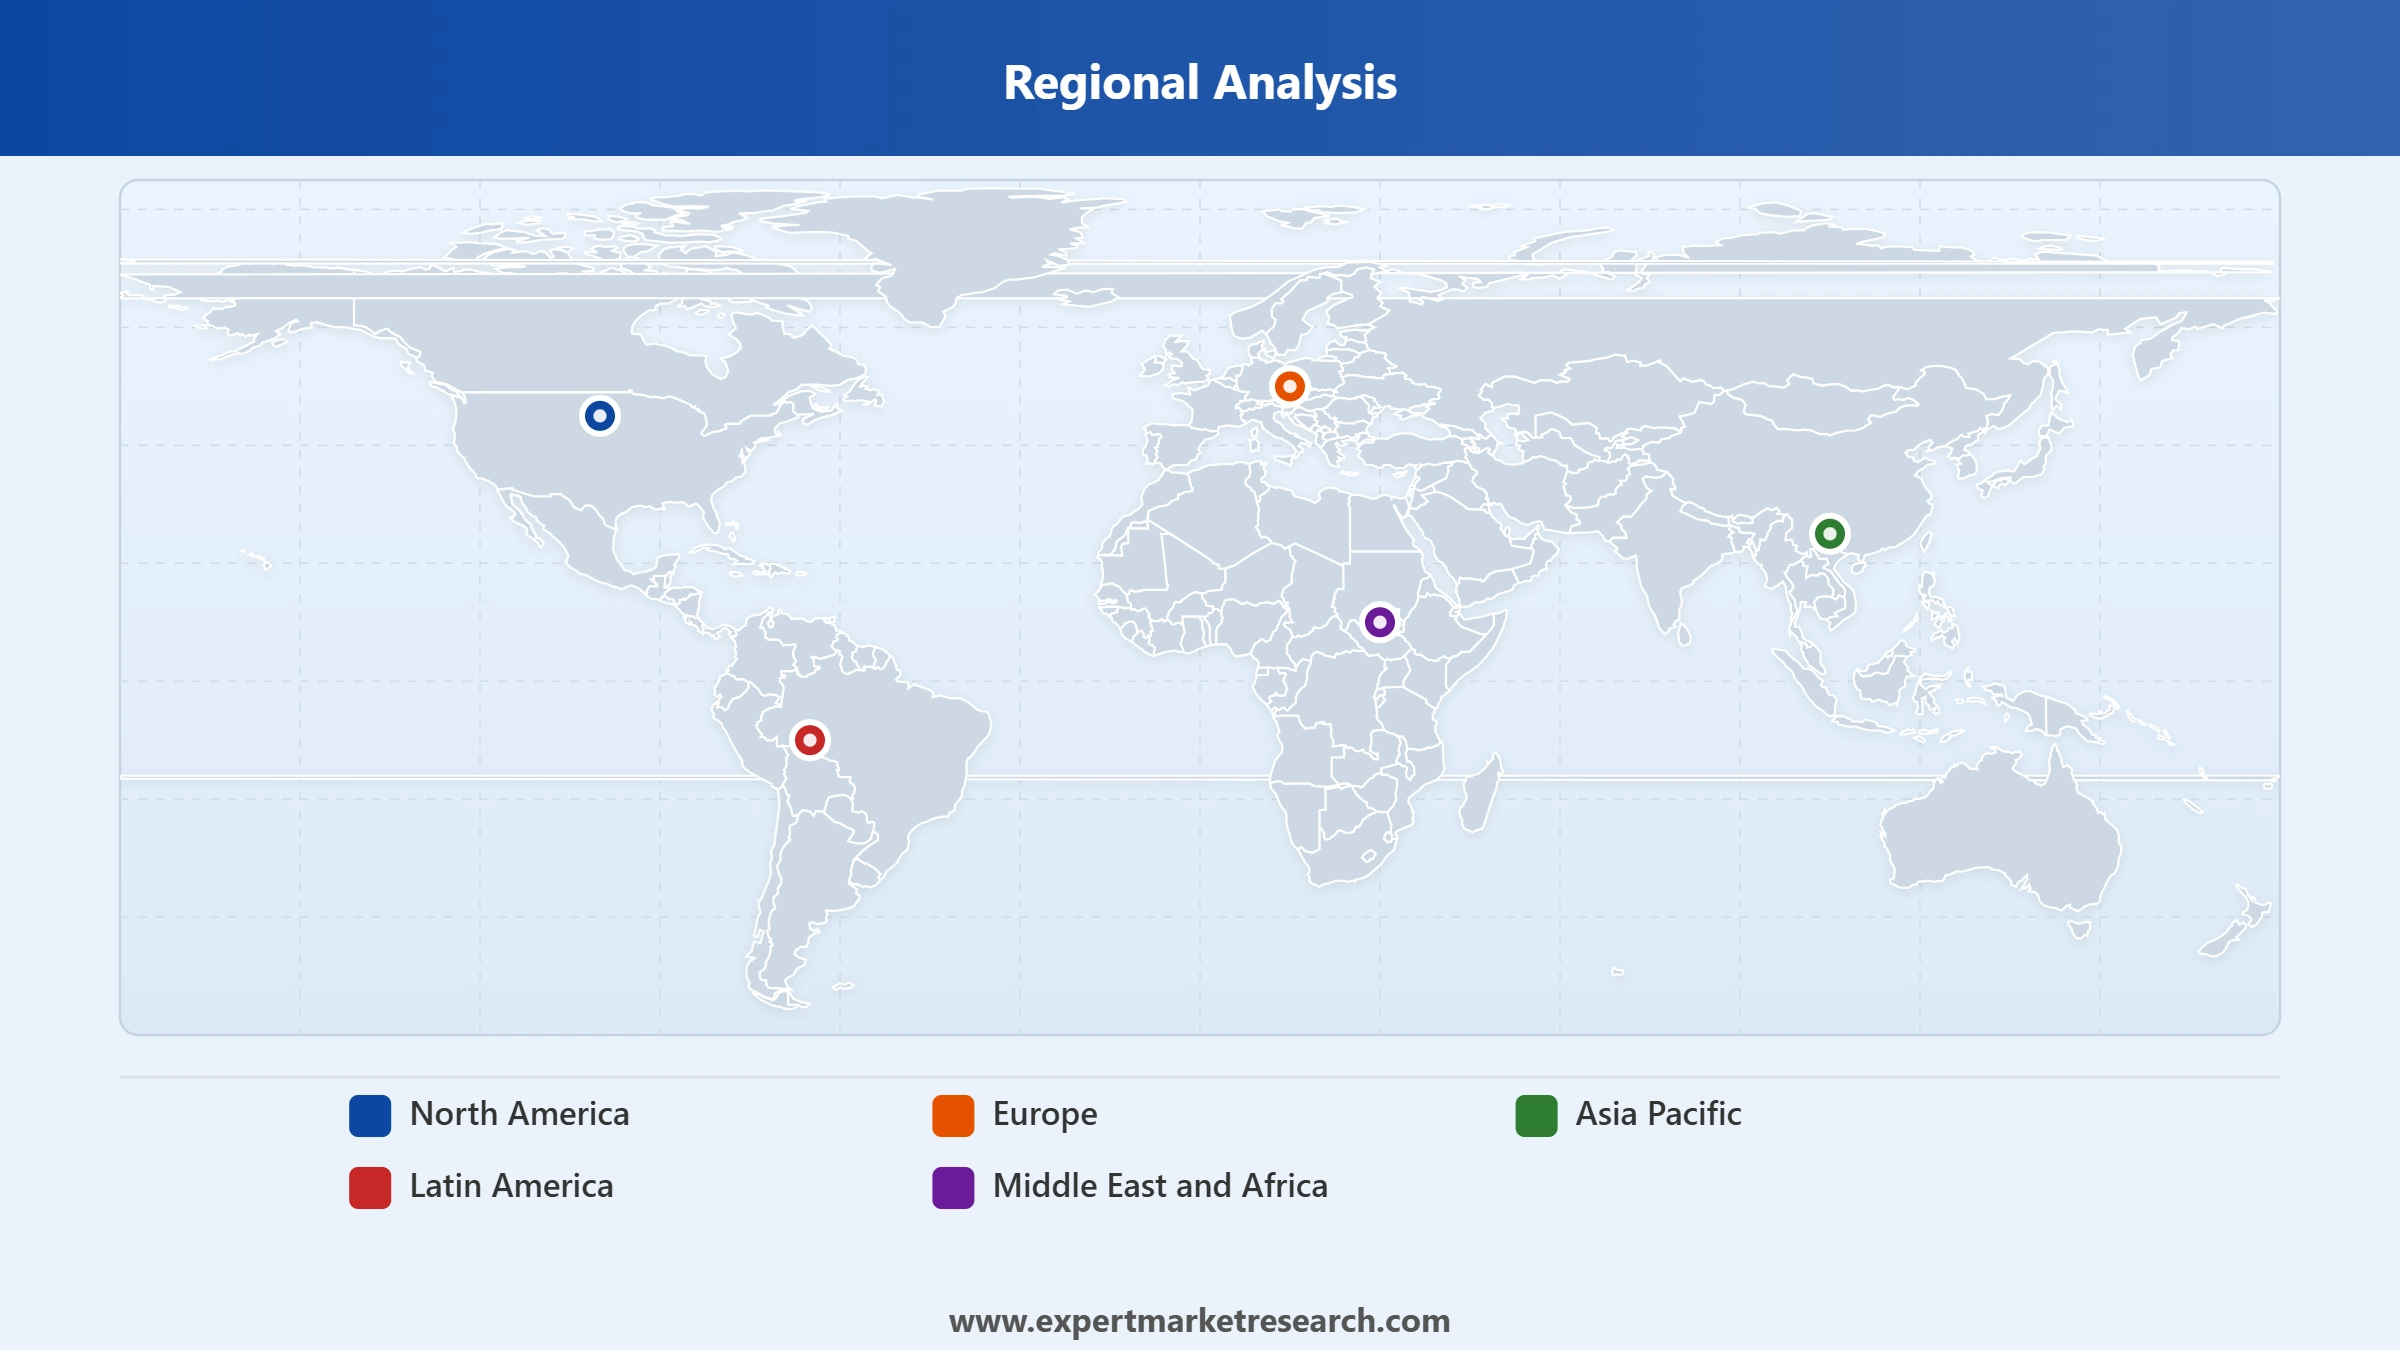
Key Insight: North America leads the sportswear market in revenue terms, underpinned by the headquarters presence of Nike, Under Armour, Columbia Sportswear, and Lululemon and strong per-capita sports participation. Asia Pacific is the fastest-growing region, driven by China and India's expanding middle classes, government-backed sports development programmes, and the rapid rise of regional champions ANTA Sports and Li Ning. Europe maintains a significant share, anchored by Adidas and Puma's heritage and strong football and outdoor sportswear demand. Latin America and the Middle East and Africa represent high-potential frontier growth markets.


Read more about this report - REQUEST FREE SAMPLE COPY IN PDF
By Product, clothes dominate the market due to widespread apparel adoption across sports and athleisure lifestyle segments
Clothes account for the largest share of the sportswear market, reflecting their universal application across professional athletics, gym-going, and everyday athleisure wear. Major sportswear companies including Nike, Adidas, and Puma generate the highest proportion of their overall revenues from performance apparel and lifestyle clothing. The continuing convergence of athletic and casual fashion, where consumers wear sportswear outside traditional sports contexts, has expanded the total addressable market for sportswear clothing well beyond its original core base.
Read more about this report - REQUEST FREE SAMPLE COPY IN PDF
Shoes represent the second-largest product category and hold the highest brand differentiation value in the global sportswear industry. Nike's footwear division consistently drives over 60% of the company's total revenue, illustrating the category's commercial centrality. Growing interest in running, basketball, and outdoor activities globally is sustaining strong footwear demand. Accessories are growing as complementary purchases increase alongside rising sports participation, with sports bags, protective equipment, and performance wearables all contributing incrementally to overall category growth through 2024.
By End User, men account for the dominant share of the market due to historically higher sports participation and sustained brand investment in men's product lines
Men constitute the largest end-user segment across the sportswear market, sustained by their higher participation rates in major team sports such as football, basketball, and cricket, as well as traditional dominance in gym and fitness footwear categories. Leading brands including Nike, Adidas, and Under Armour have historically allocated the majority of their performance product investment toward men's lines, supporting consistently high male consumer spend on sportswear across both premium and mid-market price points globally.
Read more about this report - REQUEST FREE SAMPLE COPY IN PDF
Women represent the fastest-growing end-user segment in the sportswear market, with Lululemon's rapid expansion serving as a defining illustration of this demographic shift. Growing female participation in running, yoga, fitness training, and team sports has driven dedicated women's product lines at every major sportswear brand. In 2024, Adidas and Puma both reported double-digit growth in women's apparel categories. Kids sportswear is also expanding, supported by youth sports enrolment growth and parents' increased readiness to invest in performance athletic gear for children.
By Distribution Channel, offline retail accounts for the dominant share of the market due to consumer preference for in-store brand experience and fit-critical purchase decisions
Offline retail channels, comprising branded flagship stores, multi-brand sports retailers such as Foot Locker and Decathlon, and department store sportswear sections, continue to hold the majority share of sportswear market distribution. The physicality of the purchase decision, particularly for footwear where fit and feel are critical, sustains strong in-store purchase preference globally. Major brands have invested significantly in premium flagship experiences in key cities to reinforce in-store engagement and brand perception among core consumer demographics.
Read more about this report - REQUEST FREE SAMPLE COPY IN PDF
Online channels are the fastest-growing distribution mode in the sportswear market, propelled by Nike's direct-to-consumer digital transformation and Adidas's substantial e-commerce platform investments. Nike's digital sales surpassed 25% of total company revenues in recent fiscal periods, demonstrating the commercial scale online sportswear distribution has reached. Mobile commerce growth across Asia Pacific, combined with the expansion of regional platforms such as Tmall Sports and Flipkart's sportswear category in India, is further accelerating online channel adoption through 2024 and beyond.
North America dominates the market due to leading brand headquarters concentration and high per-capita sports consumption culture
North America holds the largest regional share of the sportswear market, anchored by the headquarters presence of Nike, Under Armour, Columbia Sportswear, and Lululemon Athletica in the United States and Canada. The region's high per-capita sports participation, well-developed retail infrastructure, and strong athleisure consumption culture sustain consistent high-value demand. The United States accounts for the majority of North American sportswear revenue, with major sports leagues including the NFL, NBA, and MLB driving licensed apparel and footwear sales across a highly engaged and brand-loyal consumer base.
Read more about this report - REQUEST FREE SAMPLE COPY IN PDF
Asia Pacific is the fastest-growing regional market in global sportswear, with China and India leading volume expansion. ANTA Sports reported revenues exceeding CNY 70 billion in 2024, reflecting the scale of domestic sporting goods demand in China. India's sportswear segment is accelerating, supported by rising youth fitness culture and government-backed sports promotion programmes. In 2024, Puma and Nike both announced expanded retail and e-commerce investment in India, recognising its growing strategic importance and contribution to sportswear market growth through the forecast period.
The sporstwear market is highly competitive, dominated by a small group of large-scale global players led by Nike, Inc. and Adidas AG, who together command a substantial share of total market revenues. These brands compete on product innovation, athlete endorsement portfolios, and direct-to-consumer digital strategies. The remainder of the market is contested by global challengers including Puma SE and Lululemon Athletica, regional champions such as ANTA Sports and Li Ning, and specialist brands serving specific athletic categories and consumer demographics.
Competitive dynamics are increasingly shaped by sustainability credentials, digital retail capability, and speed-to-market in trend response. Brands that combine performance technology with broad lifestyle appeal are capturing the widest consumer base. Growing investment by Chinese brands in international expansion is adding a new competitive dimension, as ANTA and Li Ning move aggressively beyond domestic markets toward Europe and North America, testing the long-standing dominance of Western incumbents in high-value global sportswear segments.
Founded in 1964 and headquartered in Beaverton, Oregon, United States, Nike, Inc. is the world's largest sportswear company by revenue. Its portfolio spans footwear, performance apparel, and accessories across a broad range of sports and lifestyle categories. Nike's direct-to-consumer digital platforms, deep athlete endorsement network, and continuous innovation in performance materials form the cornerstone of its sustained global market leadership.
Founded in 1949 and headquartered in Herzogenaurach, Germany, Adidas AG is the world's second-largest sportswear manufacturer. Operating across footwear, apparel, and accessories, Adidas is known for its three-stripe identity and a broad portfolio spanning performance, lifestyle, and collaborative fashion collections. The company maintains strong market positions across Europe, North America, and Asia Pacific, supported by its sustainability-led product innovation strategy.
Founded in 1948 and headquartered in Herzogenaurach, Germany, Puma SE produces footwear, apparel, and accessories across football, running, motorsport, and lifestyle categories. Puma leverages high-profile athlete and celebrity partnerships to build brand relevance among younger consumers. The company has an established international retail presence with notable growth momentum in Asia Pacific and Latin America through its direct-to-consumer and wholesale channel strategies.
Founded in 1998 and headquartered in Vancouver, Canada, Lululemon Athletica Inc. is a premium athletic apparel brand best known for its yoga and fitness wear. The company has rapidly expanded its men's and footwear product lines and is executing aggressive international growth, particularly in China and Europe, as part of its Power of Three x2 strategy targeting significant revenue growth through the forecast period.
Other key players in the market are Under Armour Inc., ASICS Corporation, FILA Holdings Corp., Columbia Sportswear Company, Li Ning (China) Sports Goods Co., Ltd., ANTA Sports Products Limited, and Others.
*Please note that this is only a partial list; the complete list of key players is available in the full report. Additionally, the list of key players can be customized to better suit your needs.*
Gain a decisive edge in the sportswear market 2026 with our comprehensive research report. Packed with granular data across product categories, end-user demographics, distribution channels, and regional growth dynamics, this report gives you the clarity to act with confidence. Whether you are planning a new product launch, evaluating a geographic expansion, or reassessing your competitive positioning, download your free sample today and explore the opportunities shaping the future of global sportswear.
Paraguay Sportswear Market
Colombia Sportswear Market
Mexico Sportswear Market
Upto 15% Off
USD
$2499 $2249
$3999 $3599
$4999 $4249
$5999 $5099


*While we strive to always give you current and accurate information, the numbers depicted on the website are indicative and may differ from the actual numbers in the main report. At Expert Market Research, we aim to bring you the latest insights and trends in the market. Using our analyses and forecasts, stakeholders can understand the market dynamics, navigate challenges, and capitalize on opportunities to make data-driven strategic decisions.*
The market for sportswear reached a value of around USD 333.89 Billion in 2025.
The market is estimated to grow at a CAGR of 6.60% in the forecast period of 2026-2035.
The market is estimated to witness healthy growth in the forecast period of 2026-2035 to reach a value of around USD 632.67 Billion by 2035.
The increasing inclination of youth towards sporting activities, the rising prevalence of sports-related injuries, and the growing incorporation of fashion in sportswear are the major drivers of the market.
The key trends in the market include the growing innovations by the major market players aimed towards improving the quality of sportswear and increasing the influence of popular athletes across social media.
The major regions in the market are North America, Europe, the Asia Pacific, Latin America, and the Middle East and Africa.
The major end users of sportswear include men, women, and kids.
Nike, inc., Adidas AG, Puma SE, Lululemon Athletica Inc., Under Armour Inc., ASICS Corporation, FILA Holdings Corp., Columbia Sportswear Company, Li Ning (China) Sports Goods Co., Ltd., and ANTA Sports Products Limited, among others, are the key market players.
By Product, End User, Distribution Channel, and Region.
Explore our key highlights of the report and gain a concise overview of key findings, trends, and actionable insights that will empower your strategic decisions.
| REPORT FEATURES | DETAILS |
| Base Year | 2025 |
| Historical Period | 2019-2025 |
| Forecast Period | 2026-2035 |
| Scope of the Report |
Historical and Forecast Trends, Industry Drivers and Constraints, Historical and Forecast Market Analysis by Segment:
|
| Breakup by Product |
|
| Breakup by End User |
|
| Breakup by Distribution Channel |
|
| Breakup by Region |
|
| Market Dynamics |
|
| Competitive Landscape |
|
| Companies Covered |
|
Datasheet
One User
USD 2,499
USD 2,249
tax inclusive*
Single User License
One User
USD 3,999
USD 3,599
tax inclusive*
Five User License
Five User
USD 4,999
USD 4,249
tax inclusive*
Corporate License
Unlimited Users
USD 5,999
USD 5,099
tax inclusive*
*Please note that the prices mentioned below are starting prices for each bundle type. Kindly contact our team for further details.*
Flash Bundle
Small Business Bundle
Growth Bundle
Enterprise Bundle
*Please note that the prices mentioned below are starting prices for each bundle type. Kindly contact our team for further details.*
Flash Bundle
Number of Reports: 3
20%
tax inclusive*
Small Business Bundle
Number of Reports: 5
25%
tax inclusive*
Growth Bundle
Number of Reports: 8
30%
tax inclusive*
Enterprise Bundle
Number of Reports: 10
35%
tax inclusive*
How To Order

Select License Type
Choose the right license for your needs and access rights.

Click on ‘Buy Now’
Add the report to your cart with one click and proceed to register.

Select Mode of Payment
Choose a payment option for a secure checkout. You will be redirected accordingly.
Strategic Solutions for Informed Decision-Making
Gain insights to stay ahead and seize opportunities.

Get insights & trends for a competitive edge.

Track prices with detailed trend reports.

Analyse trade data for supply chain insights.

Leverage cost reports for smart savings

Enhance supply chain with partnerships.

Connect For More Information
Our expert team of analysts will offer full support and resolve any queries regarding the report, before and after the purchase.
Our expert team of analysts will offer full support and resolve any queries regarding the report, before and after the purchase.
We employ meticulous research methods, blending advanced analytics and expert insights to deliver accurate, actionable industry intelligence, staying ahead of competitors.
Our skilled analysts offer unparalleled competitive advantage with detailed insights on current and emerging markets, ensuring your strategic edge.
We offer an in-depth yet simplified presentation of industry insights and analysis to meet your specific requirements effectively.


