

Consumer Insights
Uncover trends and behaviors shaping consumer choices today
Procurement Insights
Optimize your sourcing strategy with key market data
Industry Stats
Stay ahead with the latest trends and market analysis.
The United States catering market was valued at USD 77.18 Billion in 2025. The industry is expected to grow at a CAGR of 6.20% during the forecast period of 2026-2035 to reach a value of USD 140.85 Billion by 2035.

The United States catering market is becoming a hub for automation, sustainability, and immersive customer experiences. The market is benefitting from the rebound in corporate travel, event tourism, and hybrid work models that demand flexible, on-site meal solutions. According to the U.S. Bureau of Labor Statistics, about 2.7 million openings are projected in the catering and food services segment, highlighting the surging demand.
Moreover, the USDA introduced the “Farm to School” grant worth USD 12.1 million, which indirectly supports local catering firms by integrating regionally sourced meals into institutional catering, especially in public schools and universities. This is pushing innovation in sustainable sourcing and menu design, particularly in Midwestern and coastal states.
Furthermore, automation in logistics is witnessing momentum in the United States catering market. Companies like Savory Technology and CaterBot AI have launched mobile food carts and AI-powered kitchen assistants, enhancing operational efficiency at scale. These shifts are enabling caterers to serve dynamic menus, real-time dietary customisation, and zero-waste packaging at high-volume events, especially in urban hubs like New York and Los Angeles.
Overall, the United States catering market is transitioning from a static B2B focus area to a value-driven, tech-integrated service model that blends convenience with health and customisation. From government-funded nutritional mandates to private sector smart kitchen innovations, the market is built around adaptability and experiential service formats.
Compound Annual Growth Rate
6.2%
Value in USD Billion
2026-2035
| United States Catering Market Report Summary | Description | Value |
| Base Year | USD Billion | 2025 |
| Historical Period | USD Billion | 2019-2025 |
| Forecast Period | USD Billion | 2026-2035 |
| Market Size 2025 | USD Billion | 77.18 |
| Market Size 2035 | USD Billion | 140.85 |
| CAGR 2019-2025 | Percentage | XX% |
| CAGR 2026-2035 | Percentage | 6.20% |
| CAGR 2026-2035 - Market by Region | New England | 8.0% |
| CAGR 2026-2035 - Market by Application | Corporate Catering | 6.9% |
| CAGR 2026-2035 - Market by Services | Inhouse | 6.8% |
In response to the growing demand from workplaces around the country, Dave's Hot Chicken and ezCater, the top food tech platform for United States workplaces, announced the opening of the fast-casual brand's first-ever catering program. Through the new relationship, businesses can easily order Dave's Hot Chicken from more than 200 of its locations for staff lunches, meetings, and events.
The first totally electric refrigerated catering truck for the aviation sector was introduced in North America by Mallaghan, a leading manufacturer of ground support equipment (GSE) worldwide.
By expanding its InReach offerings and footprint in the rapidly expanding, Sodexo announced plans to build its food model transformation with the acquisition of CRH Catering, a leading provider of convenience solutions and one of the biggest independent operators in the Mid-Atlantic region.
Renowned restaurateur and chef Daniel Boulud announced the opening of Cuisine Boulud New York, a brand-new culinary endeavour intended for conferences, galas, special events, corporate catering, and more. The new company was developed in collaboration with the LifeWorks Restaurant Group.
United States catering market players are integrating AI into kitchen workflows, scheduling, and menu optimisation. Startups like CaterAI are deploying predictive analytics to adjust menus based on guest profiles, event types, and weather forecasts, helping to minimise waste and enhance satisfaction. The USDA’s support for food technology innovation has accelerated funding for such tools. Notably, event caterers in California now offer real-time menu translations and allergen alerts via QR codes powered by AI backends. This evolution is driving productivity and personalisation across both corporate and social catering.
Customisation has taken a centre stage in the United States catering market as clients are demanding more allergen-free, gluten-free, and plant-based options. The FDA’s 2023 update on allergen labelling requirements has further compelled caterers to be transparent and innovative. Companies like Green Fork Catering and Plantein Events have begun offering full-service vegan wedding catering and corporate packages with regionally sourced ingredients. Innovative meal curation platforms that cater to nutritional sensitivities in bulk orders are disrupting traditional buffet norms and setting new standards in menu inclusivity.
A new generation of catering companies in the United States is partnering with cloud kitchens to manage high-volume, multi-location events. Firms like NextBite Events and Reef Catering offer virtual kitchen access to support brand activations and pop-up catering models. This is enabling nimble food delivery at conventions and hybrid workplaces without needing expansive preparation spaces. The 2024 National Restaurant Association report acknowledged these models as critical for scaling during peak seasons. These partnerships are reshaping logistics by allowing caterers to expand service zones while reducing overheads.
Environmental, Social, and Governance (ESG) standards are gaining traction in the United States catering market. Players like BetterBanquet and Loop Events now offer zero-waste packages, biodegradable serveware, and carbon accounting for every event served. New York's Department of Environmental Protection is funding pilot projects that reward caterers for compostable packaging and food donation protocols. These sustainability-first models appeal strongly to corporate clients in finance, law, and technology sectors who must align internal ESG goals with supplier conduct.
Companies in the United States catering market are now curating full experiences including live cooking, AR-enhanced plating, and immersive thematic dining. These innovations are less about scale and more about brand storytelling. Companies like Thomas Oliver's Gourmet Catering and Compass Group offer services that fit into wider event narratives, whether it is a sustainability-themed gala or a metaverse-themed product launch. From edible branding and scent-based ambience to interactive chef stations and sensory food mapping, caterers are transforming meals into marketing moments. This approach is particularly popular in product unveilings, fashion events, and high-profile corporate retreats where food is used to amplify brand emotion and audience engagement.
Read more about this report - REQUEST FREE SAMPLE COPY IN PDF
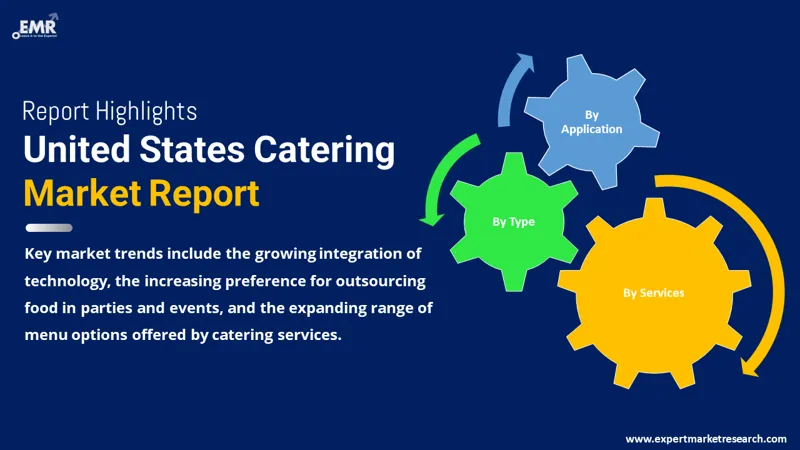
The EMR’s report titled “United States Catering Market Report and Forecast 2026-2035” offers a detailed analysis of the market based on the following segments:
Market Breakup by Type
Key Insight: While contractual catering drives institutional stability, non-contractual setups are fuelling innovation and event-driven growth, boosting the overall catering demand in the United States. Contractual players thrive on consistency, integrating smart compliance and centralised procurement for scale. Non-contractual providers, however, are disrupting norms by adapting quickly to changing themes, geographies, and client moods. The former excels in volume and regulation-heavy sectors, while the latter dominates in influencer and brand-forward spaces.
Market Breakup by Services
Key Insight: As per the United States catering market report, the inhouse catering segment is sustaining its dominance by ensuring full control, often embedded in structured ecosystems like universities and corporate campuses. Meanwhile, outsourced services are fast becoming a go-to option for agile, hybrid companies seeking quick solutions. Inhouse solutions focus on quality and consistency. Outsourced models rely on flexibility, local diversity, and tech-driven operations. Both formats are thriving due to their ability to plug into broader employee experience strategies and operational efficiencies.
Market Breakup by Application
Key Insight: Corporate catering dominates the United States catering industry as this application offers volume and stability, with health and retention being core the KPIs. This application offers healthy options, and showcases professionalism, nurturing a positive work environment and employee health. Social event catering, on the other hand, thrives on creativity and trend-sensitivity. It provides a unique, convenient experience with varied menus and professional service, improving the ambience.
Market Breakup by Region
Key Insight: The United States catering market spans across the New England, Mideast, Great Lakes, Plains, Southeast, Southwest, Rocky Mountain, Far West. The Far West region leads the market with innovation, blending sustainability and technology seamlessly into high-end catering. Southeast is gaining momentum through volume, cultural diversity, and government support. Each region brings unique growth levers such as policy support, demographic diversity, and business migration patterns.
| CAGR 2026-2035 - Market by | Region |
| New England | 8.0% |
| Mideast | 6.7% |
| Great Lakes | XX% |
| Plains | XX% |
| Others | XX% |
By Type, the Contractual Segment Accounts for the Largest Market Share
The contractual segment dominates the United States catering market, especially in institutional settings like education, defence, and healthcare. Giants like Aramark and Compass Group maintain multi-year service agreements with federal institutions and large corporates. These contracts provide predictable revenue streams and allow scale advantages through bulk procurement. Moreover, integration of smart-kitchen infrastructure and health tracking in these environments is giving caterers scope to become long-term wellness partners.
The non-contractual catering market in the United States is scaling fast, propelled by gig economy demands and pop-up events. Independent caterers and mid-sized players are capturing B2B opportunities in startup offsites, influencer events, and brand activations. Platforms like ezCater and CaterCow allow businesses to book vetted local caterers for one-off engagements with customisation options. This flexibility is key for sectors like entertainment and digital media that prefer theme-driven, seasonal events over long-term catering contracts. Furthermore, non-contractual caterers are leading innovation in AR-enhanced dining and location-based food delivery, making them agile and experiential.
By Services, the Inhouse Segment Occupies a Substantial Share of the Market
The inhouse segment is largely adding to the United States catering market value with high demand from large-scale establishments such as universities, airports, and business parks. These set-ups enable complete control over food quality, logistics, and compliance. For example, universities like MIT and Stanford run their own catering services to integrate sustainability, nutrition, and experiential learning into food delivery. Moreover, corporate companies like Google and Microsoft are now equipping inhouse caterers with digital inventory systems and real-time feedback platforms to adjust offerings daily. Furthermore, as employee wellness becomes core to workplace design, inhouse services are being rebranded as ‘nutrition programs,’ helping HR teams align food with retention strategies.
The outsourced segment is gaining ground in the United States catering market, via mid-sized enterprises and co-working hubs that seek flexibility without operational burdens. Catering firms like Off The Grid and ZeroCater offer outsourced services powered by dashboards that allow real-time budget, menu, and delivery tracking. Startups especially in the healthtech and fintech sectors are opting for subscription-based outsourced food models as a perk for hybrid teams. These caterers also facilitate localisation, allowing firms to serve regional flavours without in-house capacity.
By Application, Corporate Catering Registers the Bigger Market Share
Corporate catering dominates the United States catering market revenue share, evolving from basic lunches to culture-driven culinary engagement. Major tech firms like Google and Salesforce have reinvented on-site dining as a wellness and community-building strategy. Caterers are now integrating health analytics, cultural theming, and even DEI-based menu planning. Corporate clients are seeking custom, rotational menus, wellness-focused dishes, and AI-based feedback tools. The market also observes a growing demand for low-carbon, locally sourced food, often benchmarked against ESG metrics. This segment is also experimenting with hybrid event catering, supporting offsite team meetings and virtual food deliveries simultaneously.
The social events segment which includes weddings to micro-influencer parties, is witnessing a fast-paced growth in the United States catering market share. Modern clients expect customisation across dietary, cultural, and visual dimensions. Firms like HauteChefs and Poppyseed Events are offering 3D menu previews and interactive tastings via AR. QR-coded feedback loops and zero-waste returns are appealing to eco-conscious end consumers.


By Region, Far West Registers the Dominant Position in the Market
Demand in the Far West catering market is largely boosted by California as most of the tech giants and entertainment houses are based here. With 83,501 eating and drinking establishments in California as of 2022, contributing to an estimated USD 135.8 billion in sales, the market witnesses an increasing inclination towards sustainability, technology integration, and experiential formats. Events in cities like San Francisco and Los Angeles have given rise to carbon-neutral catering with AR interfaces and blockchain traceability. California’s aggressive composting and zero-waste laws incentivise caterers to rethink packaging and sourcing.
The Southeast region, encompassing states like Georgia and Florida, is seeing a rapid rise in catering demand due to growing tourism, corporate relocation, and cultural events. Cities like Atlanta and Miami have grown immensely popular for hybrid catering, mixing Southern cuisine with modern presentation formats. The influx of fintech and media companies in this belt is also boosting demand for high-end, tech-integrated catering services.
The United States catering players are rapidly adapting through technology adoption, regional menu curation, and service diversification. Firms like Compass Group, Aramark, and Guckenheimer are focusing on AI-driven logistics, smart inventory tools, and ESG-aligned packaging. Emerging firms are seizing opportunities in influencer events, cloud kitchen tie-ups, and AR-enabled plating. There is a noticeable shift towards subscription catering for workplaces and co-working hubs.
Moreover, M&A activity is picking up, especially around health-focused and digital-first caterers. United States catering companies are leveraging government-backed food sustainability grants and labour reskilling schemes to innovate offerings. With clients increasingly seeking data transparency, real-time feedback loops, and customisation at scale, competitive edge for B2B companies lies in agility, sustainability, and storytelling.
Sodexo, founded in 1966, stands as a prominent global entity in quality-of-life services, with its headquarters situated in France. Offering a diverse array of services spanning catering, facilities management, and employee benefits, Sodexo operates across 64 nations, delivering inventive solutions that enhance the well-being of individuals and institutions worldwide.
Compass Group PLC, established in 1941, emerged as a multinational leader in contract food service and support services, with its headquarters based in the United Kingdom. Spanning sectors such as healthcare, education, and business, Compass Group delivers catering, facility management, and workplace solutions across more than 45 countries, serving millions daily with exceptional hospitality.
ISS A/S, with its inception dating back to 1901, represents a global powerhouse in facility services, with its roots grounded in Denmark. Spanning operations across 60 countries, ISS provides an extensive range of services encompassing catering, cleaning, property services, and workplace management, catering to diverse sectors such as healthcare, education, and corporate clients on a global scale.
Founded in 1959, Aramark, a leading global provider of food, facilities, and uniform services, operates across various sectors, including education, healthcare, sports, and leisure. With a strong presence in 19 countries, the company is renowned for delivering innovative solutions that enhance the overall customer experience. Aramark's comprehensive range of services encompasses dining, catering, facility management, and uniform supply, serving millions of individuals daily.
*Please note that this is only a partial list; the complete list of key players is available in the full report. Additionally, the list of key players can be customized to better suit your needs.*
Other key players in the market are San Francisco Catering Company (Fresh Pulp Holding LLC), Tres LA Group, Thomas’s Catering, Elaine Bell Catering, and DJ's California Catering, among others.
Explore the latest trends shaping the United States Catering Market 2026-2035 with our in-depth report. Gain strategic insights, future forecasts, and key market developments that can help you stay competitive. Download a free sample report or contact our team for customized consultation on United States Catering Market Trends 2026.
In-Flight Catering Service Market
Brazil Catering Services Market
Catering Equipment Market
Catering Services Market
Inflight Catering Market
Upto 15% Off
USD
$4399 $3959
$2999 $2699
$5599 $4759
$6659 $5660


*While we strive to always give you current and accurate information, the numbers depicted on the website are indicative and may differ from the actual numbers in the main report. At Expert Market Research, we aim to bring you the latest insights and trends in the market. Using our analyses and forecasts, stakeholders can understand the market dynamics, navigate challenges, and capitalize on opportunities to make data-driven strategic decisions.*
In 2025, the United States catering market reached an approximate value of USD 77.18 Billion.
The market is projected to grow at a CAGR of 6.20% between 2026 and 2035.
The revenue generated from the catering market is expected to reach USD 140.85 Billion in 2035.
Key strategies driving the market include embedding AI, local sourcing, and ESG metrics into operations while forming partnerships with tech firms, cloud kitchens, and cultural institutions to enhance service reach and thematic culinary storytelling.
The catering market is categorised according to its type, which includes contractual and non-contractual.
The key players in the United States catering market, according to the report, are Sodexo, Compass Group PLC, ISS A/S, Aramark, San Francisco Catering Company (Fresh Pulp Holding LLC), Tres LA Group, Thomas’s Catering, Elaine Bell Catering, and DJ's California Catering, among others.
Based on the services, the catering market is divided into in-house and outsource.
The major areas include New England, Mideast, Great Lakes, Plains, Southeast, Southwest, Rocky Mountain, and Far West.
The key challenges are labour shortages, strict food safety regulations, and high last-mile delivery costs. Additionally, maintaining menu diversity while ensuring profitability under inflationary pressures challenges both startups and large players.
Explore our key highlights of the report and gain a concise overview of key findings, trends, and actionable insights that will empower your strategic decisions.
| REPORT FEATURES | DETAILS |
| Base Year | 2025 |
| Historical Period | 2019-2025 |
| Forecast Period | 2026-2035 |
| Scope of the Report |
Historical and Forecast Trends, Industry Drivers and Constraints, Historical and Forecast Market Analysis by Segment:
|
| Breakup by Type |
|
| Breakup by Services |
|
| Breakup by Application |
|
| Breakup by Region |
|
| Market Dynamics |
|
| Competitive Landscape |
|
| Companies Covered |
|
Single User License
One User
USD 4,399
USD 3,959
tax inclusive*
Datasheet
One User
USD 2,999
USD 2,699
tax inclusive*
Five User License
Five User
USD 5,599
USD 4,759
tax inclusive*
Corporate License
Unlimited Users
USD 6,659
USD 5,660
tax inclusive*
*Please note that the prices mentioned below are starting prices for each bundle type. Kindly contact our team for further details.*
Flash Bundle
Small Business Bundle
Growth Bundle
Enterprise Bundle
*Please note that the prices mentioned below are starting prices for each bundle type. Kindly contact our team for further details.*
Flash Bundle
Number of Reports: 3
20%
tax inclusive*
Small Business Bundle
Number of Reports: 5
25%
tax inclusive*
Growth Bundle
Number of Reports: 8
30%
tax inclusive*
Enterprise Bundle
Number of Reports: 10
35%
tax inclusive*
How To Order

Select License Type
Choose the right license for your needs and access rights.

Click on ‘Buy Now’
Add the report to your cart with one click and proceed to register.

Select Mode of Payment
Choose a payment option for a secure checkout. You will be redirected accordingly.
Strategic Solutions for Informed Decision-Making
Gain insights to stay ahead and seize opportunities.

Get insights & trends for a competitive edge.

Track prices with detailed trend reports.

Analyse trade data for supply chain insights.

Leverage cost reports for smart savings

Enhance supply chain with partnerships.

Connect For More Information
Our expert team of analysts will offer full support and resolve any queries regarding the report, before and after the purchase.
Our expert team of analysts will offer full support and resolve any queries regarding the report, before and after the purchase.
We employ meticulous research methods, blending advanced analytics and expert insights to deliver accurate, actionable industry intelligence, staying ahead of competitors.
Our skilled analysts offer unparalleled competitive advantage with detailed insights on current and emerging markets, ensuring your strategic edge.
We offer an in-depth yet simplified presentation of industry insights and analysis to meet your specific requirements effectively.


