

Consumer Insights
Uncover trends and behaviors shaping consumer choices today
Procurement Insights
Optimize your sourcing strategy with key market data
Industry Stats
Stay ahead with the latest trends and market analysis.
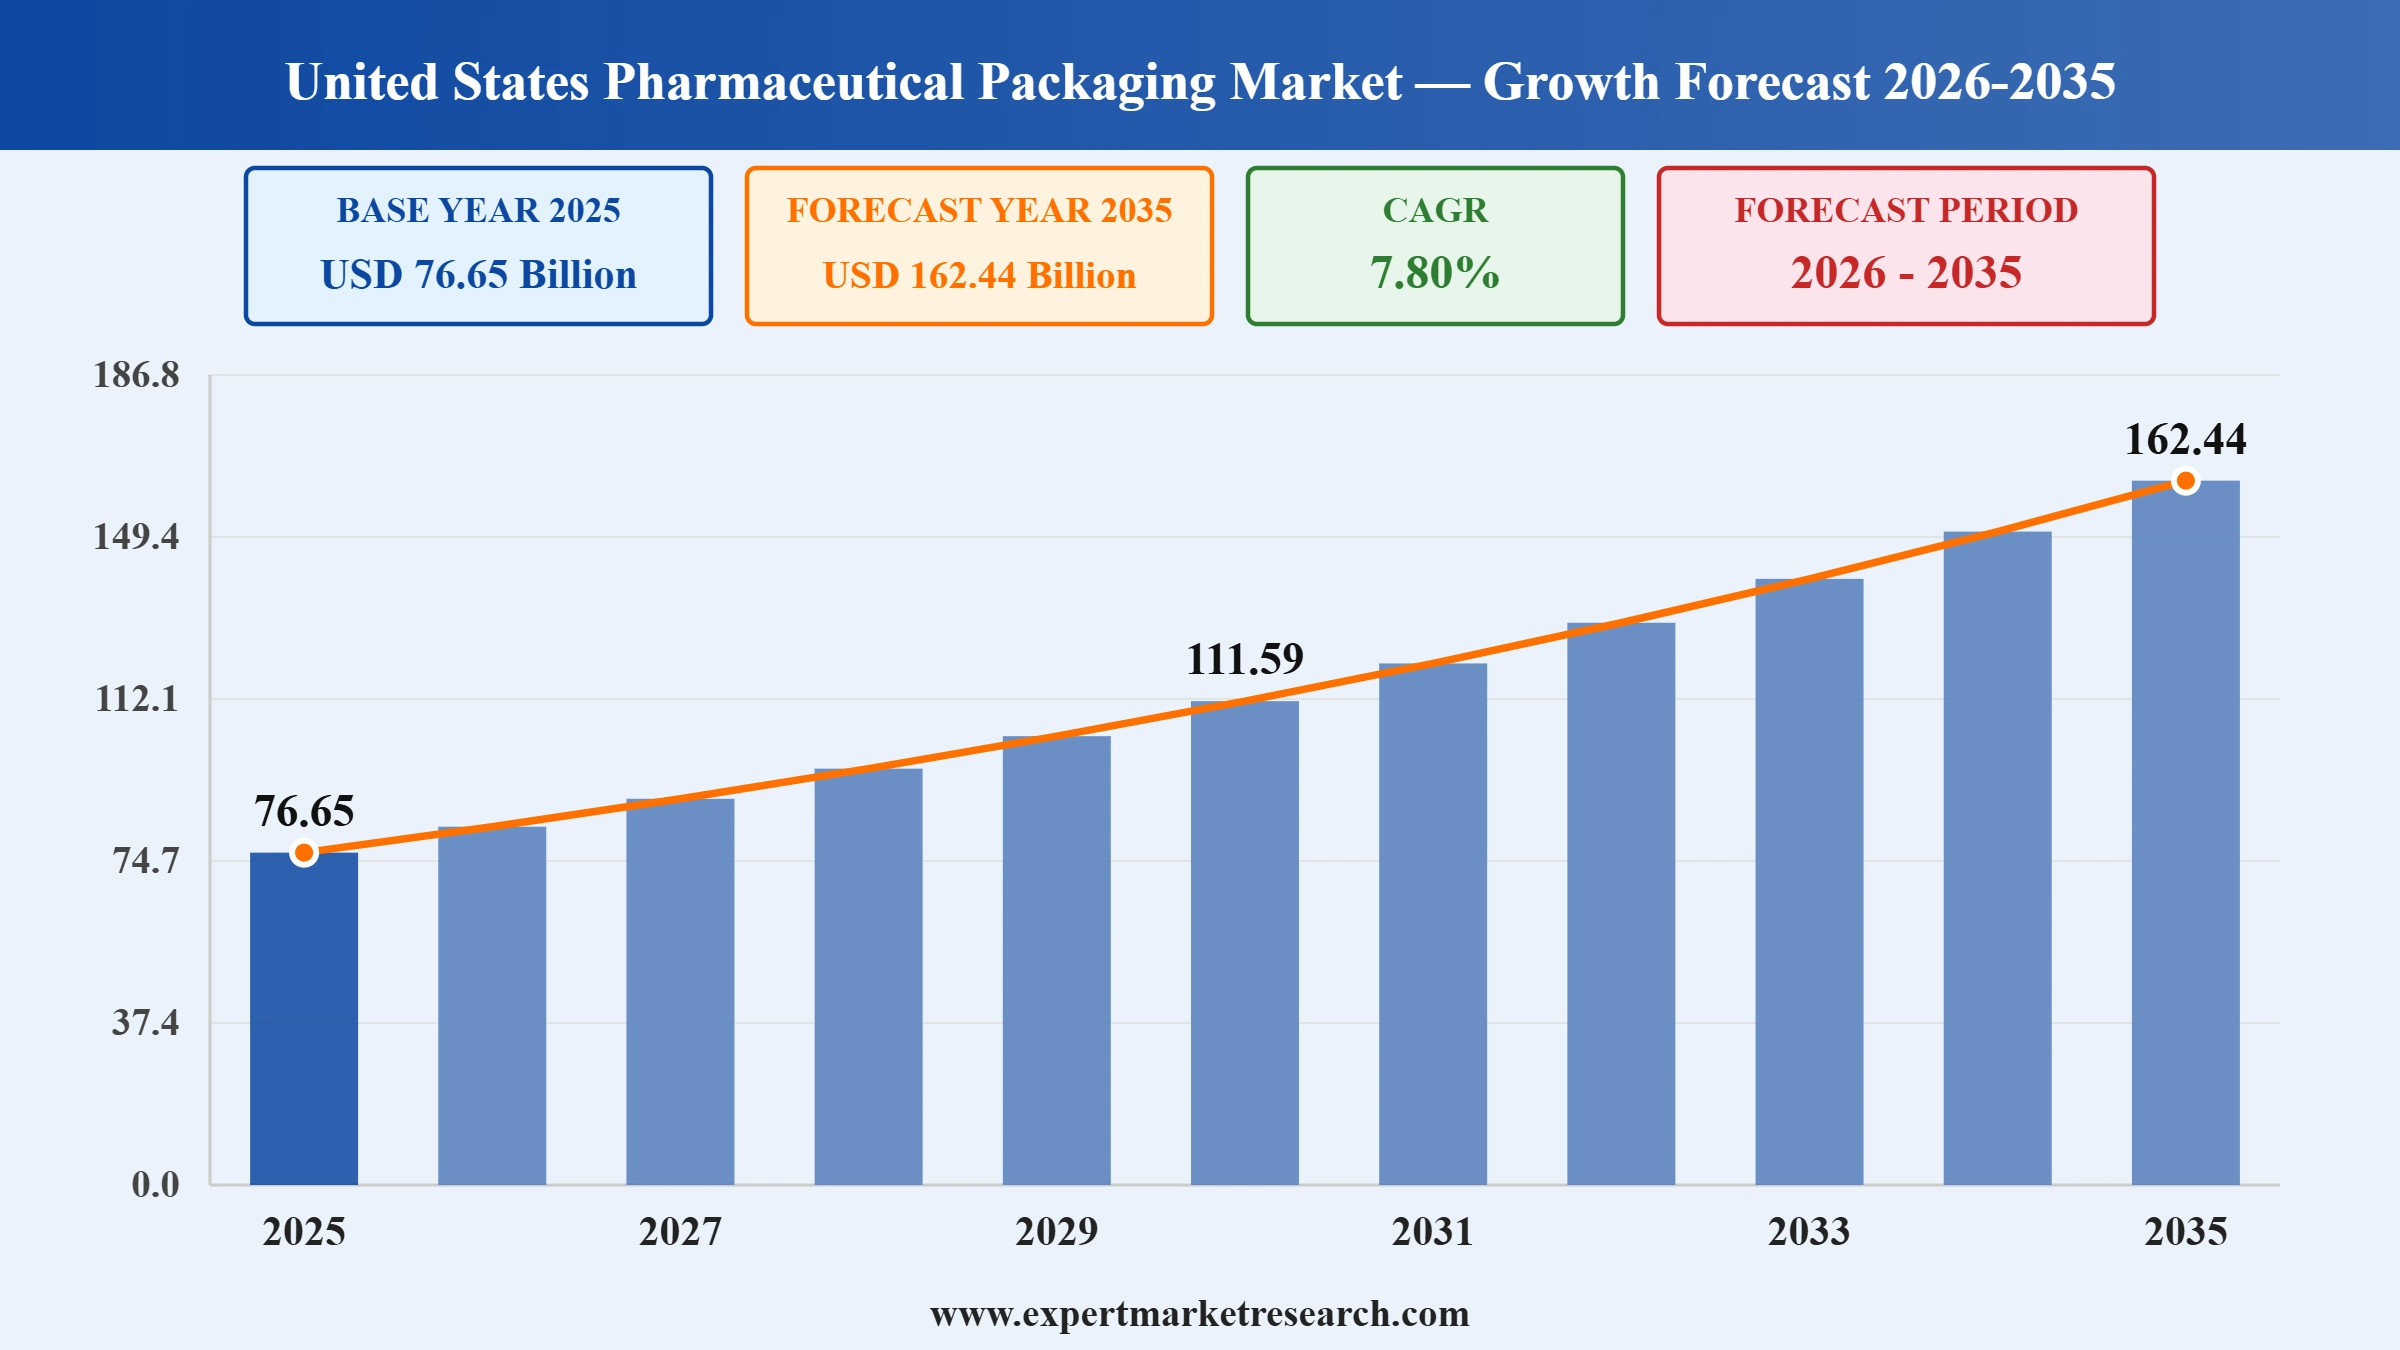
The United States pharmaceutical packaging market size reached around USD 76.65 Billion in 2025. The market is projected to grow at a CAGR of 7.80% between 2026 and 2035, reaching almost USD 162.44 Billion by 2035.
Read more about this report - REQUEST FREE SAMPLE COPY IN PDF
The United States pharmaceutical packaging market covers the containers, closures, and protective materials used to store, protect, identify, and deliver drug products. It spans primary packaging in direct contact with the drug, such as vials, blisters, and prefilled syringes, along with secondary and tertiary packaging for distribution.
Packaging must preserve stability, ensure sterility, support compliance, and deter tampering. The United States pharmaceutical packaging market reached around USD 76.65 billion in 2025 and is projected to reach almost USD 162.44 billion by 2035, growing at a CAGR of 7.80% between 2026 and 2035.
Read more about this report - REQUEST FREE SAMPLE COPY IN PDF
Product and material innovation have become some of the key United States pharmaceutical packaging market trends. The development of cyclic olefin polymers (COPs) has become an important breakthrough for the market. Since COPs and copolymers are mainly composed of hydrogen and carbon, they are extremely non-reactive and durable. They resemble the optical properties of glass and can be carved into different designs easily. They have good a leachable profile and have the potential to withstand different sterilisation techniques (such as steam and radiation sterilisation). This makes them an appealing choice for many healthcare companies.
As wearable drug devices witness a surge in consumer demand, the use of inert packaging materials which provide high moisture protection and increase their shelf life is expected to witness significant growth. Moreover, transparent packaging solutions with low adsorption rates are expected to become increasingly popular over the forecast period.
Read more about this report - REQUEST FREE SAMPLE COPY IN PDF
The evolving standards of drug packaging and distribution in the United States are expected to prompt major companies to enhance operational efficiencies by deploying intelligent robots and machines to detect faulty packaging material and replace it with another piece. This is expected to propel the United States pharmaceutical packaging market expansion in the coming years.
"United States Pharmaceutical Packaging Market Report and Forecast 2026-2035" offers a detailed analysis of the market based on the following segments:
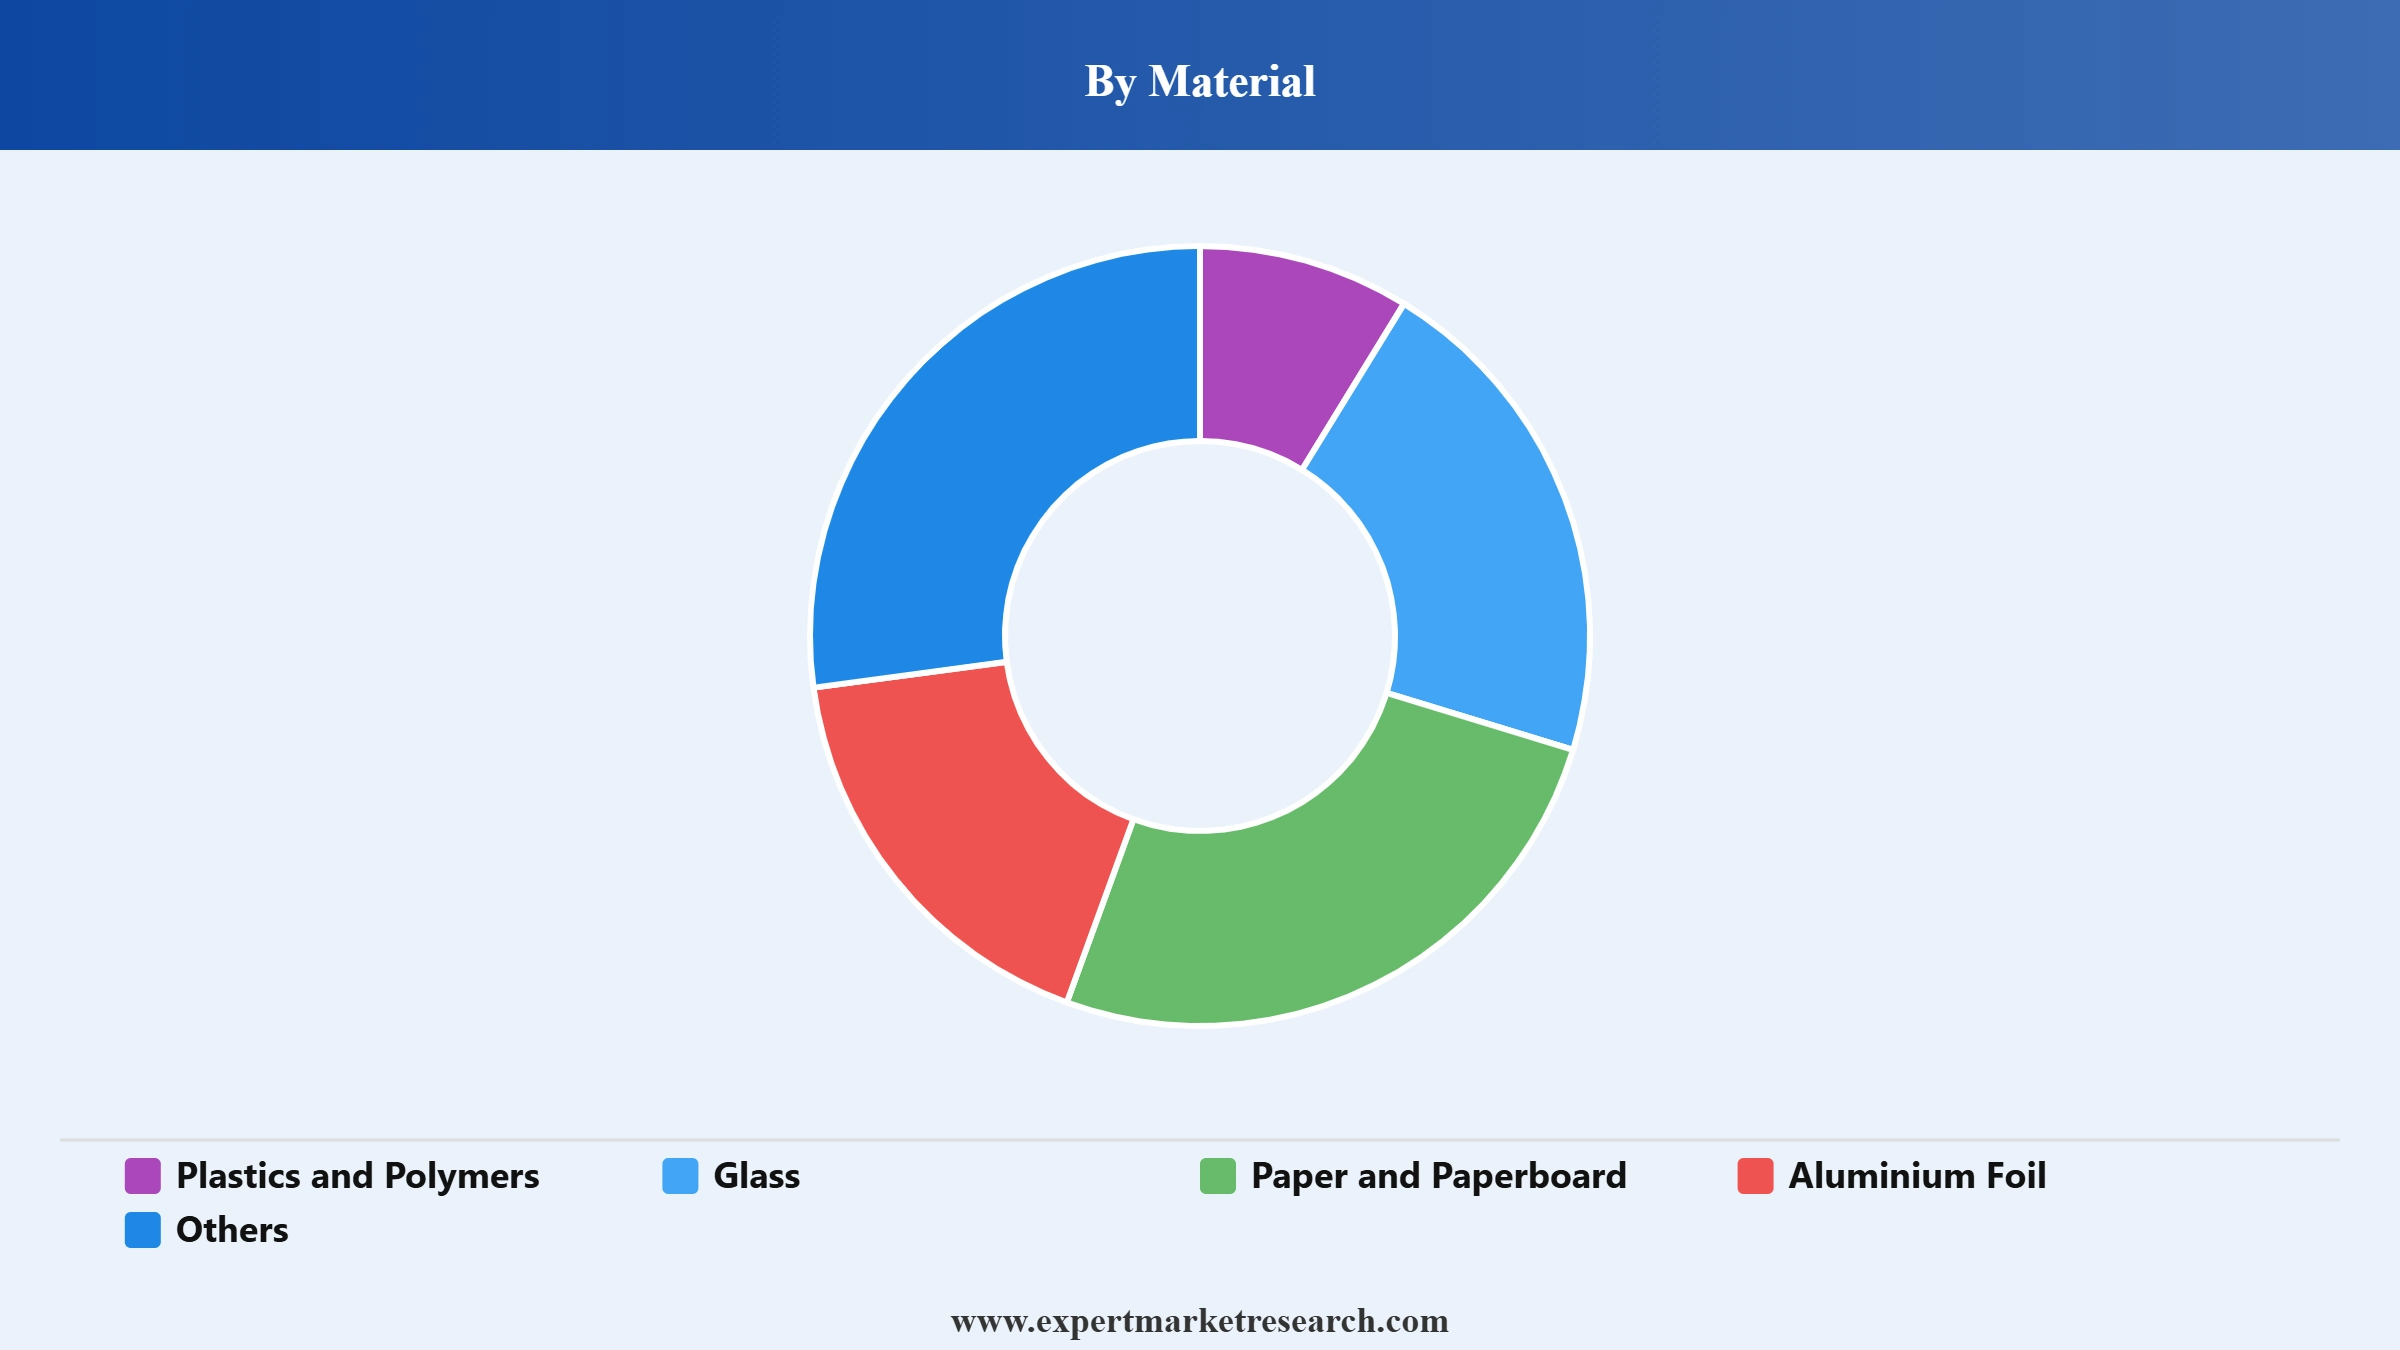
Market Breakup by Materials
Key Insight: Plastics and polymers account for the largest share of the United States pharmaceutical packaging market, valued for versatility, low weight, and barrier performance across bottles, blisters, and closures, while glass remains essential for injectables and biologics that require chemical inertness, and aluminium foil and paper and paperboard support blister lidding, labelling, and secondary packaging.
Market Breakup by Product Type
Key Insight: Plastic bottles and blister packing hold significant shares, reflecting the dominance of oral solid-dose drugs distributed through retail and mail-order pharmacy, while parenteral containers such as vials and prefilled syringes are among the fastest-growing product types on the back of biologics and injectable therapies, and closures and labels remain critical to compliance, tamper evidence, and serialisation.
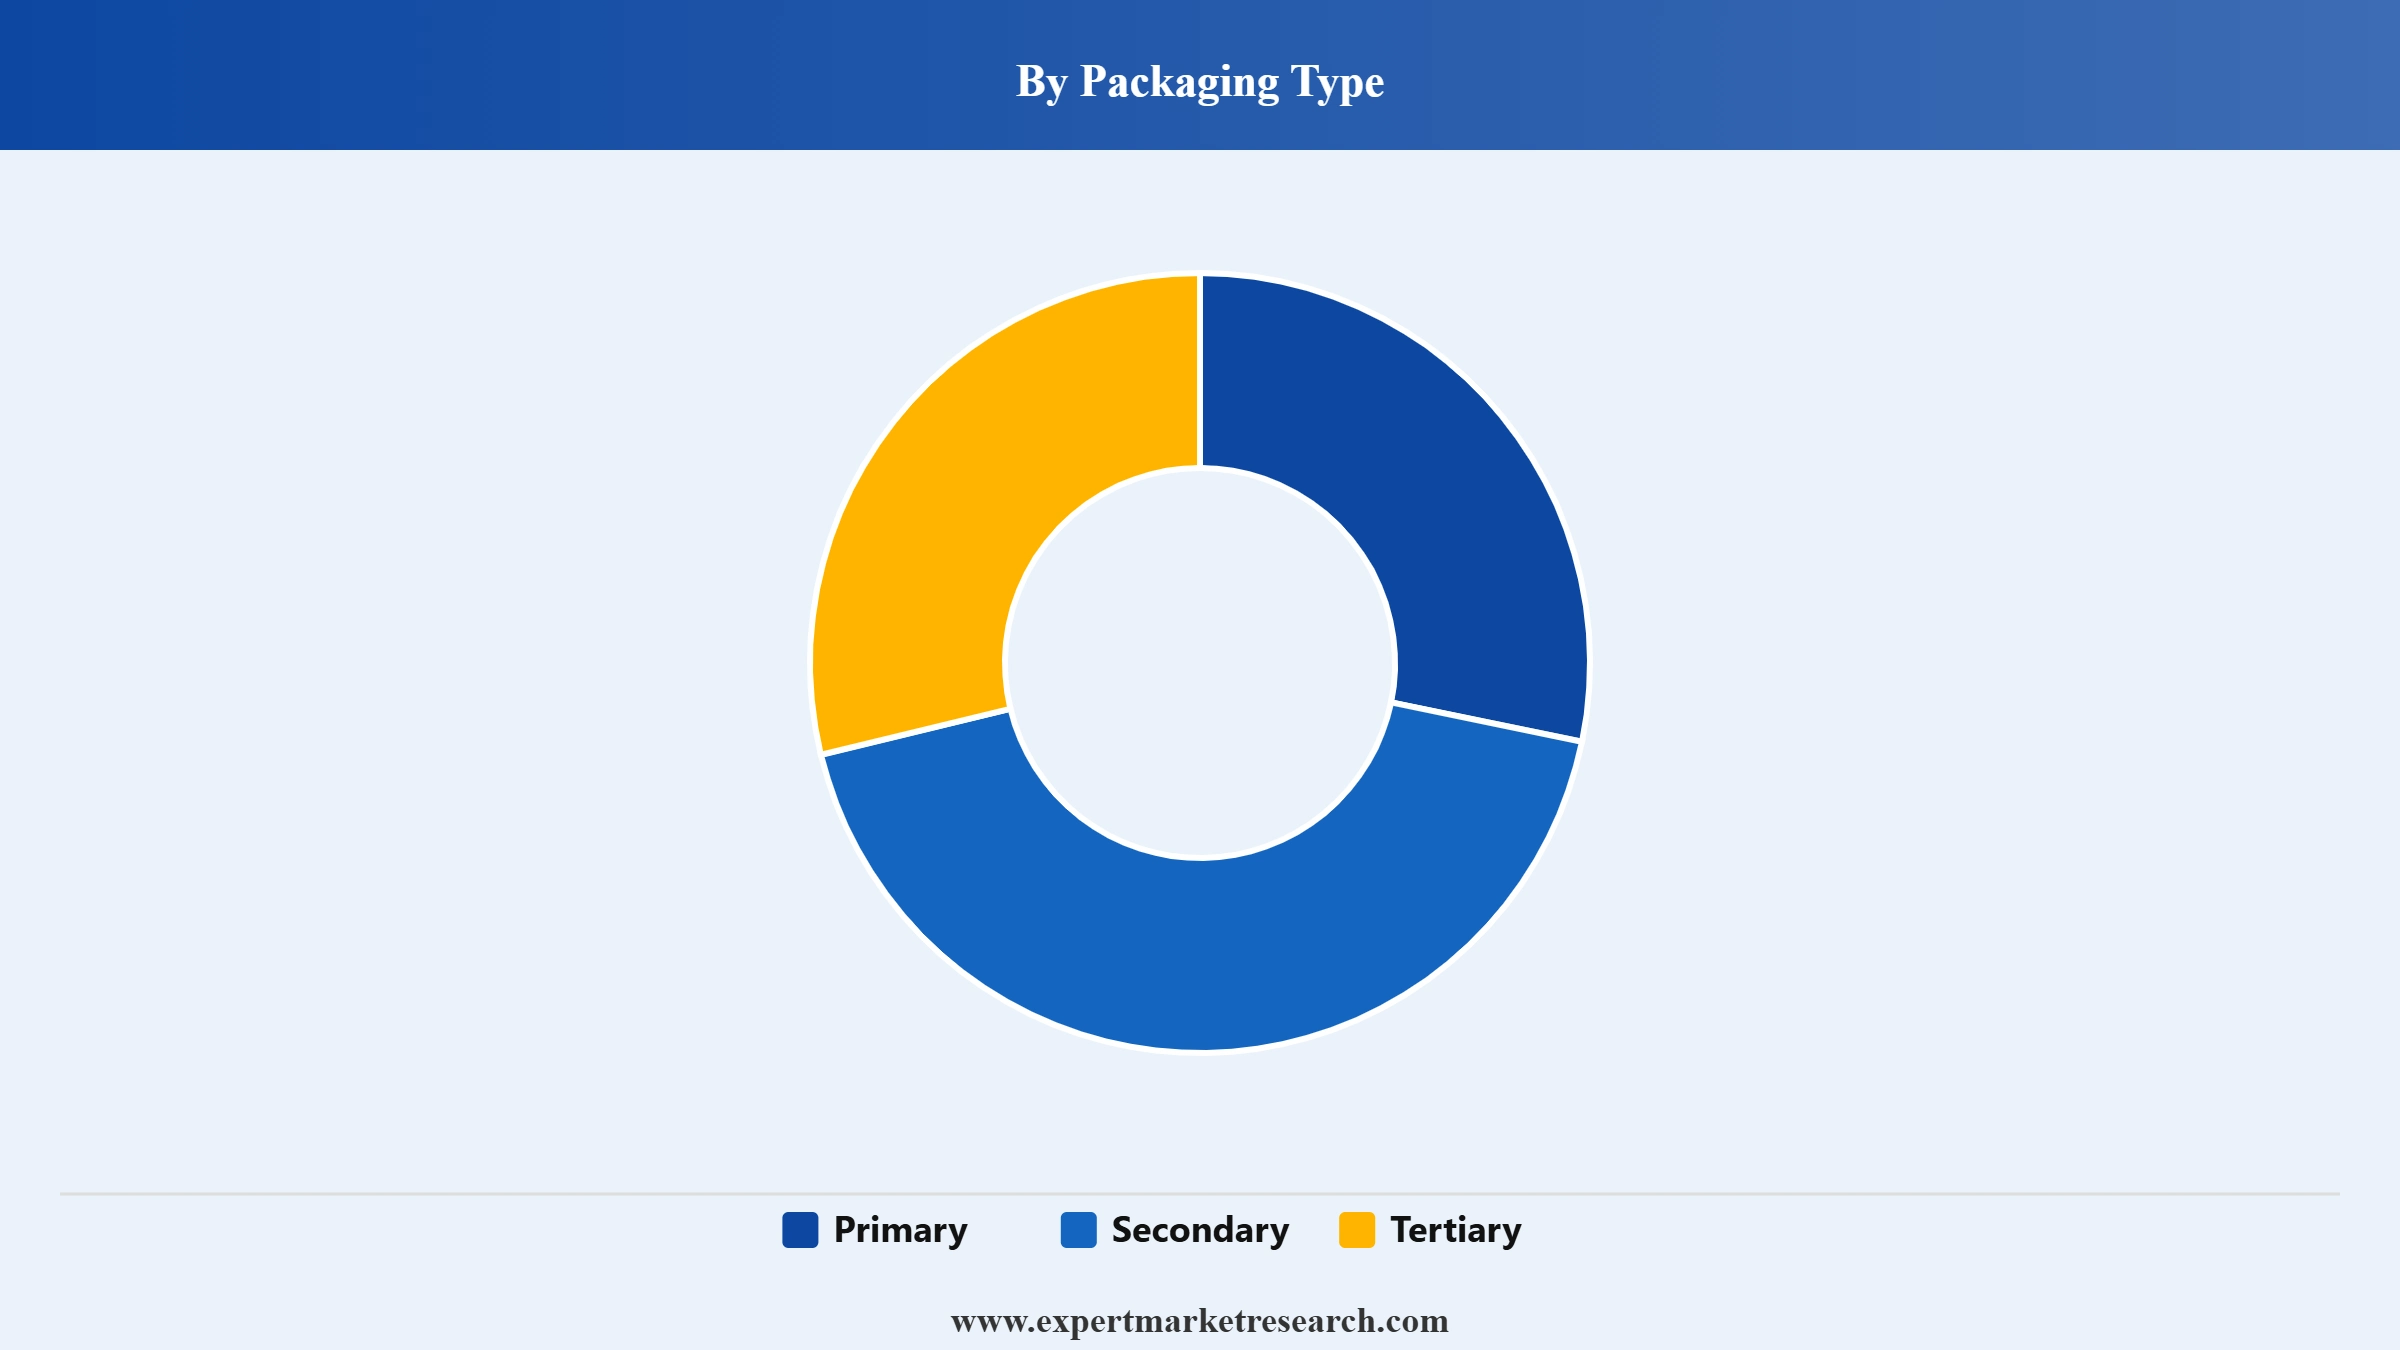
Market Breakup by Packaging Type
Key Insight: Primary packaging represents the largest value share, as it is in direct contact with the drug and must meet the strictest sterility, barrier, and compatibility standards, while secondary packaging is central to serialisation, branding, and tamper evidence under the Drug Supply Chain Security Act, and tertiary packaging supports bulk distribution and temperature-controlled logistics.
Market Breakup by Drug Delivery Mode
Key Insight: Oral drug packaging holds the leading share, supported by the high volume of tablets and capsules in the United States, while injectable packaging is the fastest-growing mode, driven by biologics, biosimilars, and GLP-1 therapies delivered through prefilled syringes and autoinjectors, and topical and other modes sustain steady demand across dermatological and specialty products.
Market Breakup by End Use
Key Insight: Pharmaceutical manufacturing accounts for the largest end-use share, as drug makers integrate primary packaging into production and regulatory filings, while contract packaging is expanding rapidly on the back of outsourcing and reshoring of United States drug production, and retail and institutional pharmacy support demand for unit-dose, adherence, and dispensing packaging.
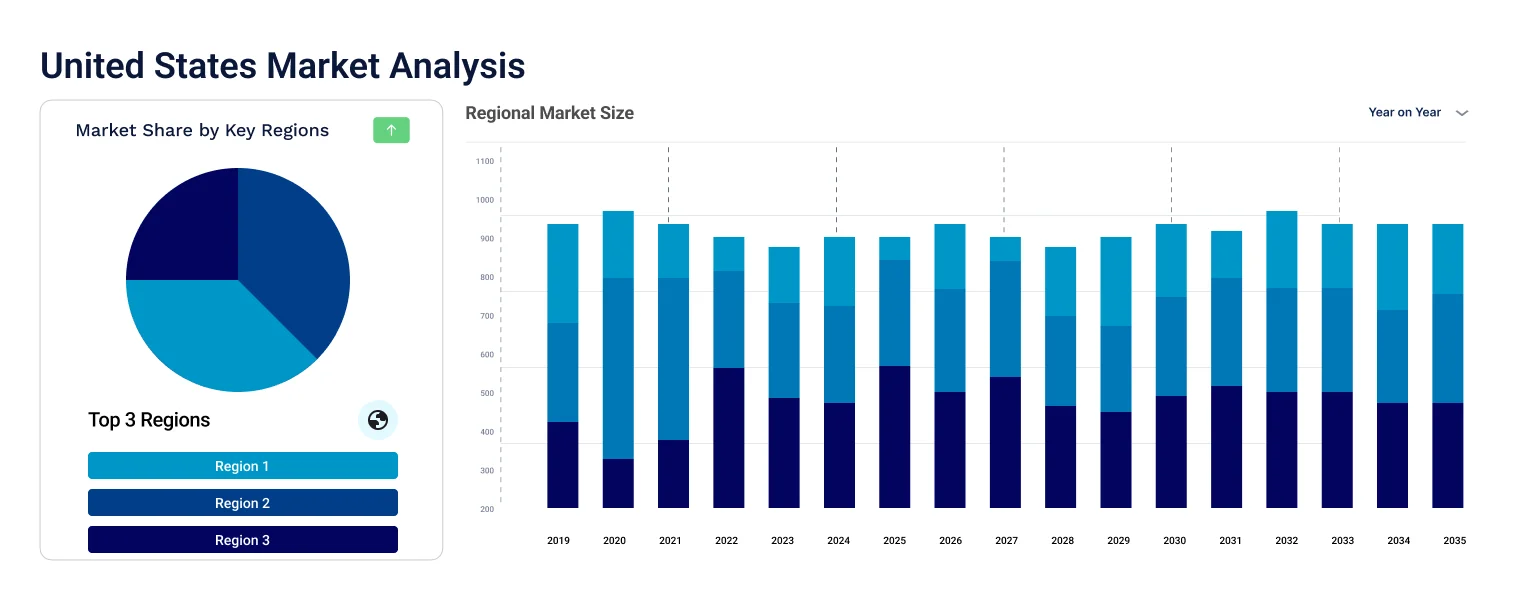
Market Breakup by Region
Key Insight: The Far West and Northeast are among the key regional markets, supported by concentrations of pharmaceutical manufacturing, biotechnology clusters, and contract packaging capacity, while the Great Lakes and Southeast contribute steady demand from established manufacturing and distribution networks, and other regions grow more gradually in line with local production and pharmacy activity.
Read more about this report - REQUEST FREE SAMPLE COPY IN PDF
The United States pharmaceutical packaging market is stratified by how close each supplier sits to the drug itself. Specialist primary packaging and drug-delivery firms compete on regulatory validation, extractables performance, and device engineering, where switching costs are high because any material change can trigger drug refiling. Broad packaging converters compete across secondary and specialty formats, while healthcare distribution and automation players serve pharmacy and unit-dose packaging. The key players are analysed below on their material and device capabilities, regulatory validation, and end-market focus.
Regulatory complexity and cost are the central challenges. Container closure systems must pass extensive stability, extractables, and leachables testing, and any material change can require regulatory refiling, which raises cost and lengthens development timelines. Serialisation compliance under DSCSA adds further operational and capital demands.
Sustainability and materials pressure act as restraints. Pharmaceutical packaging relies heavily on multi-material and single-use plastics that are difficult to recycle, and sustainability goals often conflict with the sterility, barrier, and compliance requirements that limit material substitution. Supply chain reliability for medical-grade glass and polymers is an added constraint.
Biologics, smart packaging, and reshoring present the clearest opportunities. Growth in injectables, prefilled devices, and cold chain supports premium packaging demand, while connected and smart packaging aids adherence and traceability. Reshoring of United States drug manufacturing and contract packaging further expands domestic demand.


Upto 15% Off
USD
$2499 $2249
$3999 $3599
$4999 $4249
$5999 $5099


*While we strive to always give you current and accurate information, the numbers depicted on the website are indicative and may differ from the actual numbers in the main report. At Expert Market Research, we aim to bring you the latest insights and trends in the market. Using our analyses and forecasts, stakeholders can understand the market dynamics, navigate challenges, and capitalize on opportunities to make data-driven strategic decisions.*
The market was valued at nearly USD 76.65 Billion in 2025.
The market is projected to grow at a CAGR of 7.80% between 2026 and 2035.
The market is assessed to witness a healthy growth in the forecast period to reach around USD 162.44 Billion in 2035.
The different materials used in pharmaceutical packaging include plastics and polymers, glass, paper and paperboard, and aluminium foil, among others.
The different product types in the market include plastic bottles, speciality bags, parenteral container, blister packing, closures, and labels, among others.
The different end uses of pharmaceutical packaging are pharma manufacturing, contract packaging, retail pharmacy, and institutional pharmacy.
The major regions in the market include New England, Mideast, Great Lakes, Plains, Southeast, Southwest, Rocky Mountain, and Far West.
The key market players are Amcor Plc, Sonoco Products Co., Sealed Air Corp., Schott AG, Winpak Ltd., WestRock Co., Omnicell Inc., AptarGroup, Inc., Cardinal Health Inc., and McKesson Corp., among others.
Explore our key highlights of the report and gain a concise overview of key findings, trends, and actionable insights that will empower your strategic decisions.
| REPORT FEATURES | DETAILS |
| Base Year | 2025 |
| Historical Period | 2019-2025 |
| Forecast Period | 2026-2035 |
| Scope of the Report |
Historical and Forecast Trends, Industry Drivers and Constraints, Historical and Forecast Market Analysis by Segment:
|
| Breakup by Material |
|
| Breakup by Product Type |
|
| Breakup by Packaging Type |
|
| Breakup by Drug Delivery Mode |
|
| Breakup by End Use |
|
| Breakup by Region |
|
| Market Dynamics |
|
| Competitive Landscape |
|
| Companies Covered |
|
Datasheet
One User
USD 2,499
USD 2,249
tax inclusive*
Single User License
One User
USD 3,999
USD 3,599
tax inclusive*
Five User License
Five User
USD 4,999
USD 4,249
tax inclusive*
Corporate License
Unlimited Users
USD 5,999
USD 5,099
tax inclusive*
*Please note that the prices mentioned below are starting prices for each bundle type. Kindly contact our team for further details.*
Flash Bundle
Small Business Bundle
Growth Bundle
Enterprise Bundle
*Please note that the prices mentioned below are starting prices for each bundle type. Kindly contact our team for further details.*
Flash Bundle
Number of Reports: 3
20%
tax inclusive*
Small Business Bundle
Number of Reports: 5
25%
tax inclusive*
Growth Bundle
Number of Reports: 8
30%
tax inclusive*
Enterprise Bundle
Number of Reports: 10
35%
tax inclusive*
How To Order

Select License Type
Choose the right license for your needs and access rights.

Click on ‘Buy Now’
Add the report to your cart with one click and proceed to register.

Select Mode of Payment
Choose a payment option for a secure checkout. You will be redirected accordingly.
Strategic Solutions for Informed Decision-Making
Gain insights to stay ahead and seize opportunities.

Get insights & trends for a competitive edge.

Track prices with detailed trend reports.

Analyse trade data for supply chain insights.

Leverage cost reports for smart savings

Enhance supply chain with partnerships.

Connect For More Information
Our expert team of analysts will offer full support and resolve any queries regarding the report, before and after the purchase.
Our expert team of analysts will offer full support and resolve any queries regarding the report, before and after the purchase.
We employ meticulous research methods, blending advanced analytics and expert insights to deliver accurate, actionable industry intelligence, staying ahead of competitors.
Our skilled analysts offer unparalleled competitive advantage with detailed insights on current and emerging markets, ensuring your strategic edge.
We offer an in-depth yet simplified presentation of industry insights and analysis to meet your specific requirements effectively.




