

Consumer Insights
Uncover trends and behaviors shaping consumer choices today
Procurement Insights
Optimize your sourcing strategy with key market data
Industry Stats
Stay ahead with the latest trends and market analysis.
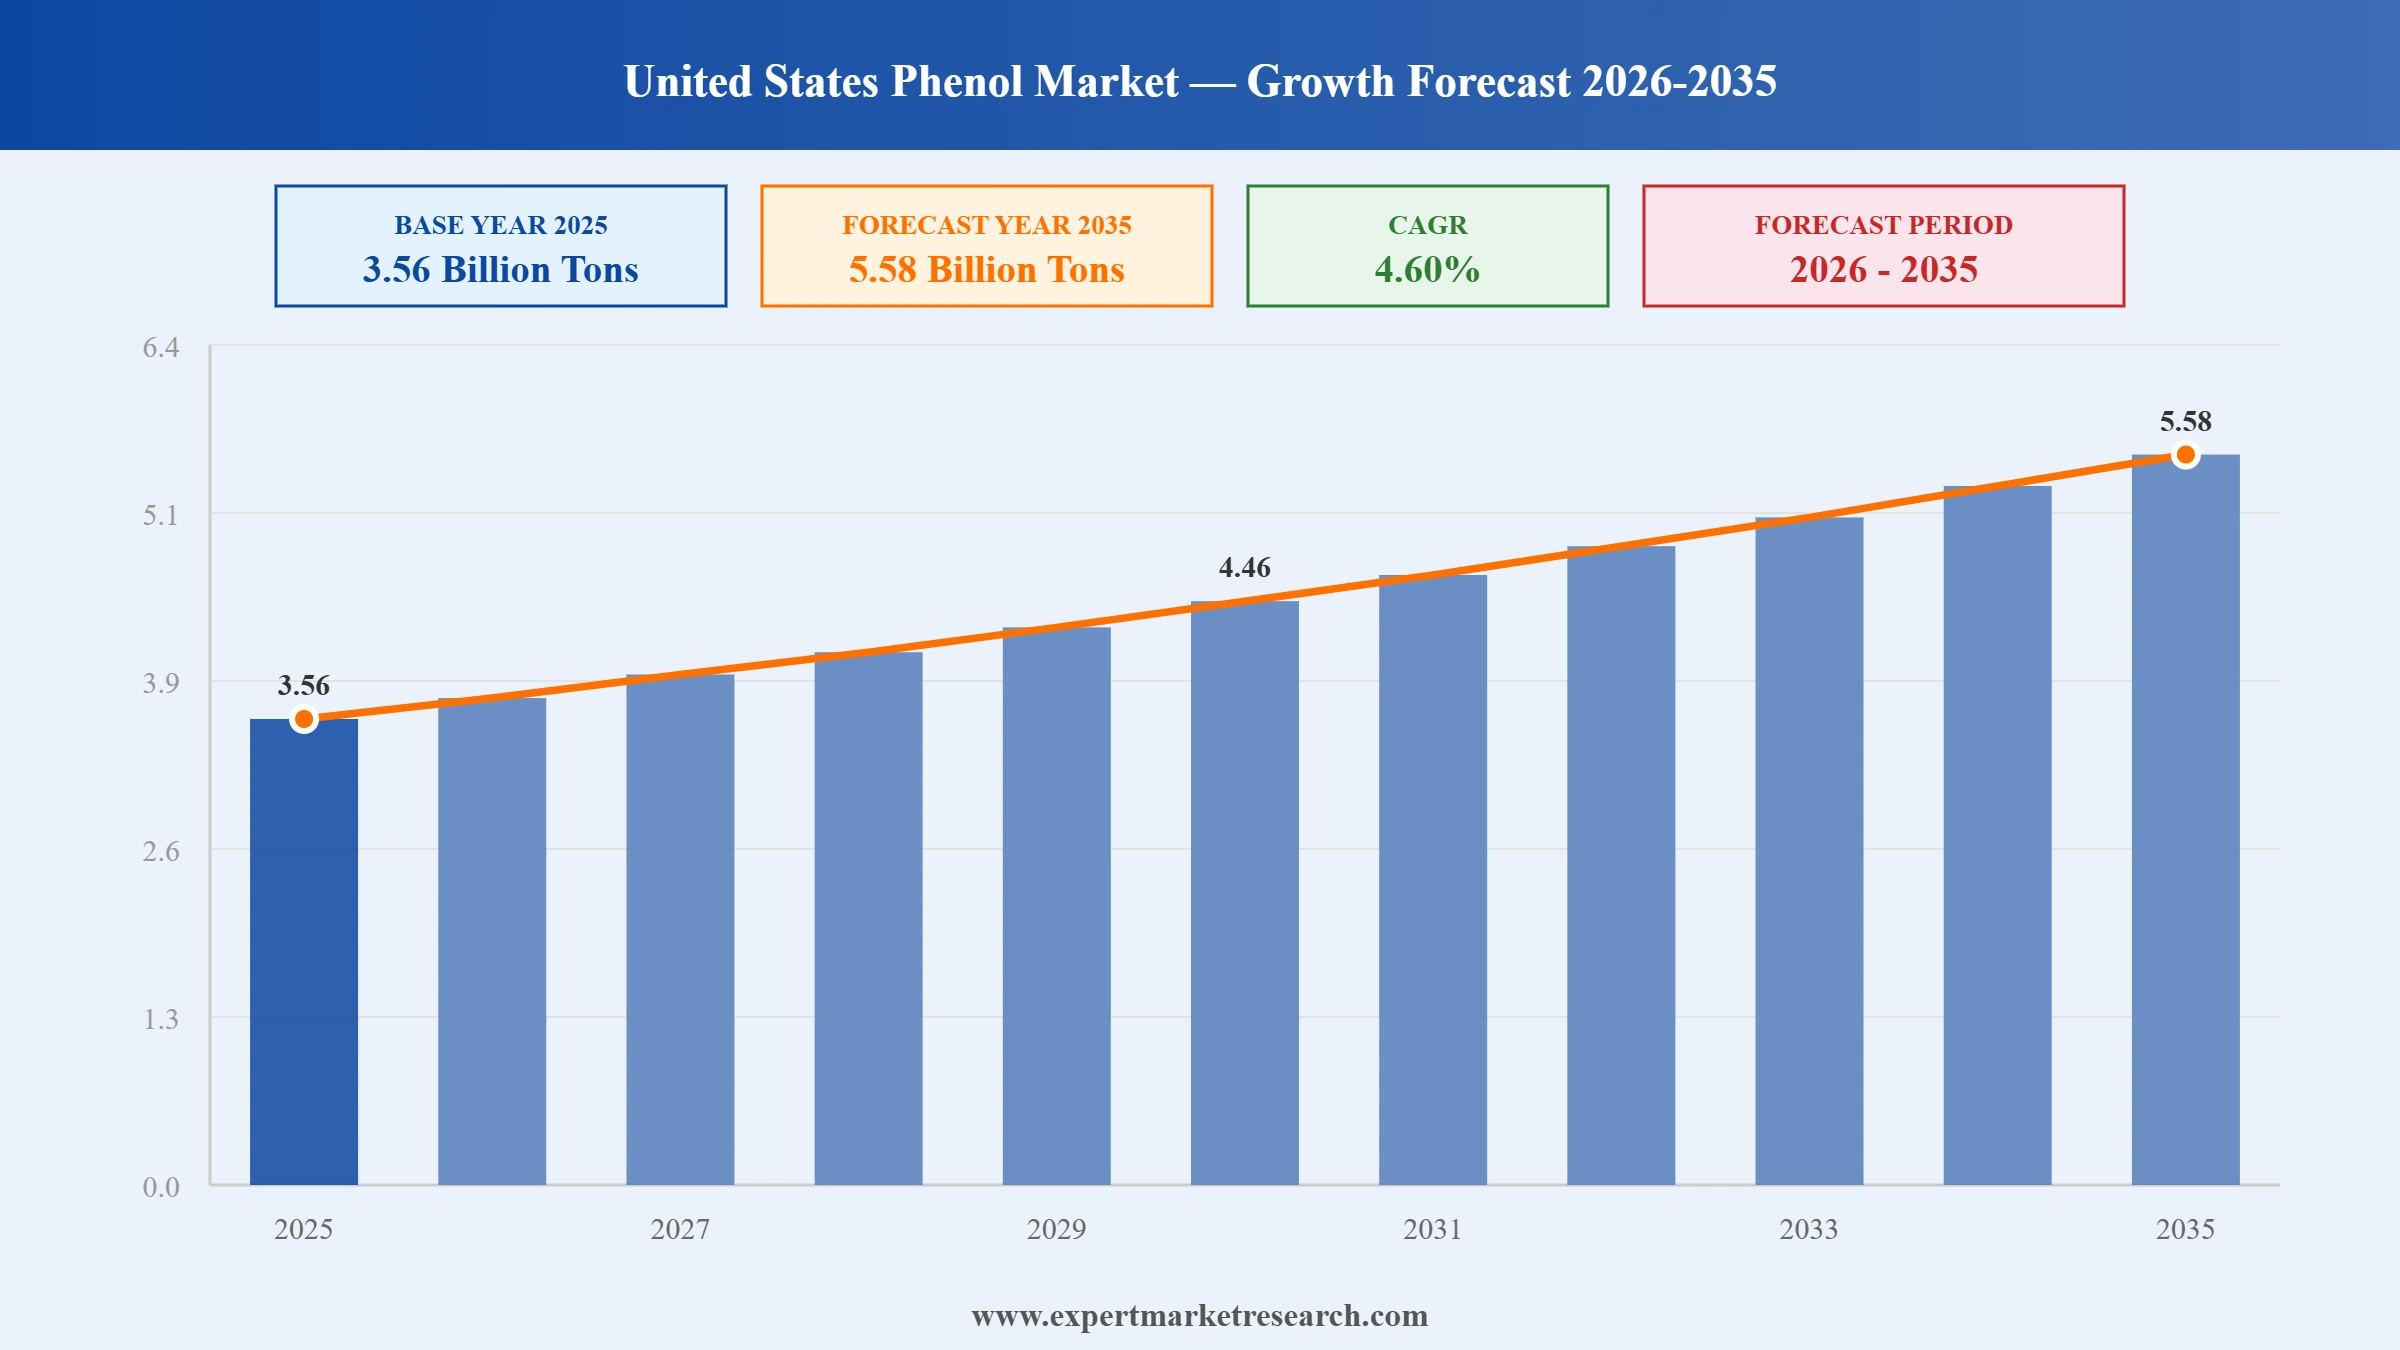
The United States phenol market attained a volume of 3.56 Billion Tons in 2025. The market is further projected to grow at a CAGR of 4.60% between 2026 and 2035, reaching a volume of 5.58 Billion Tons by 2035.
As per industry reports, the phenol price in the United States increased to 1,030 USD per metric ton in April 2019, representing a 7% rise.
Phenol is an aromatic organic compound derived from benzene, with global demand amounting to about 12 million metric tons in 2022.
BPA leads the United States phenol market share as it represents nearly half of global phenol consumption, with major end-use markets in polycarbonate and epoxy resins.
Read more about this report - REQUEST FREE SAMPLE COPY IN PDF
| United States Phenol Market Report Summary | Description | Value |
| Base Year | Billion Tons | 2025 |
| Historical Period | Billion Tons | 2019-2025 |
| Forecast Period | Billion Tons | 2026-2035 |
| Market Size 2025 | Billion Tons | 3.56 |
| Market Size 2035 | Billion Tons | 5.58 |
| CAGR 2019-2025 | Percentage | XX% |
| CAGR 2026-2035 | Percentage | 4.60% |
| CAGR 2026-2035 - Market by Region | Far West | 5.3% |
| CAGR 2026-2035 - Market by Region | Southwest | 4.7% |
| CAGR 2026-2035 - Market by Application | Phenolic Resins | 4.4% |
| CAGR 2026-2035 - Market by End-User | Electronics | 5.1% |
| 2025 Market Share by Region | New England | 8.0% |
The increasing demand for phenol in various industries such as plastics, composites, and laminates is driving the market growth. For instance, phenol is used in the production of phenolic resins, which are widely used in the manufacturing of plywood, laminated beams, and flooring panels. The growing construction activities around the world are expected to boost the demand for phenolic resins, thereby driving the United States phenol market growth.
The use of phenol as a disinfectant and cleaner for electronic devices and machinery parts is fuelling the market growth. The increasing usage of phenols in everyday products such as mouthwash, disinfectants, inks, liquid detergents, and floor cleaners is also contributing to the market’s expansion. For instance, Lysol, a well-known brand of disinfectants, uses phenol as a key ingredient in its products.
The increasing demand for phenol and phenol derivatives from chemical and pharmaceutical sectors is expected to accelerate the United States phenol market share. phenol is used as a feedstock for a wide range of compounds and derivatives. For instance, phenol is used in the production of aspirin, paracetamol, and other painkillers.
Read more about this report - REQUEST FREE SAMPLE COPY IN PDF
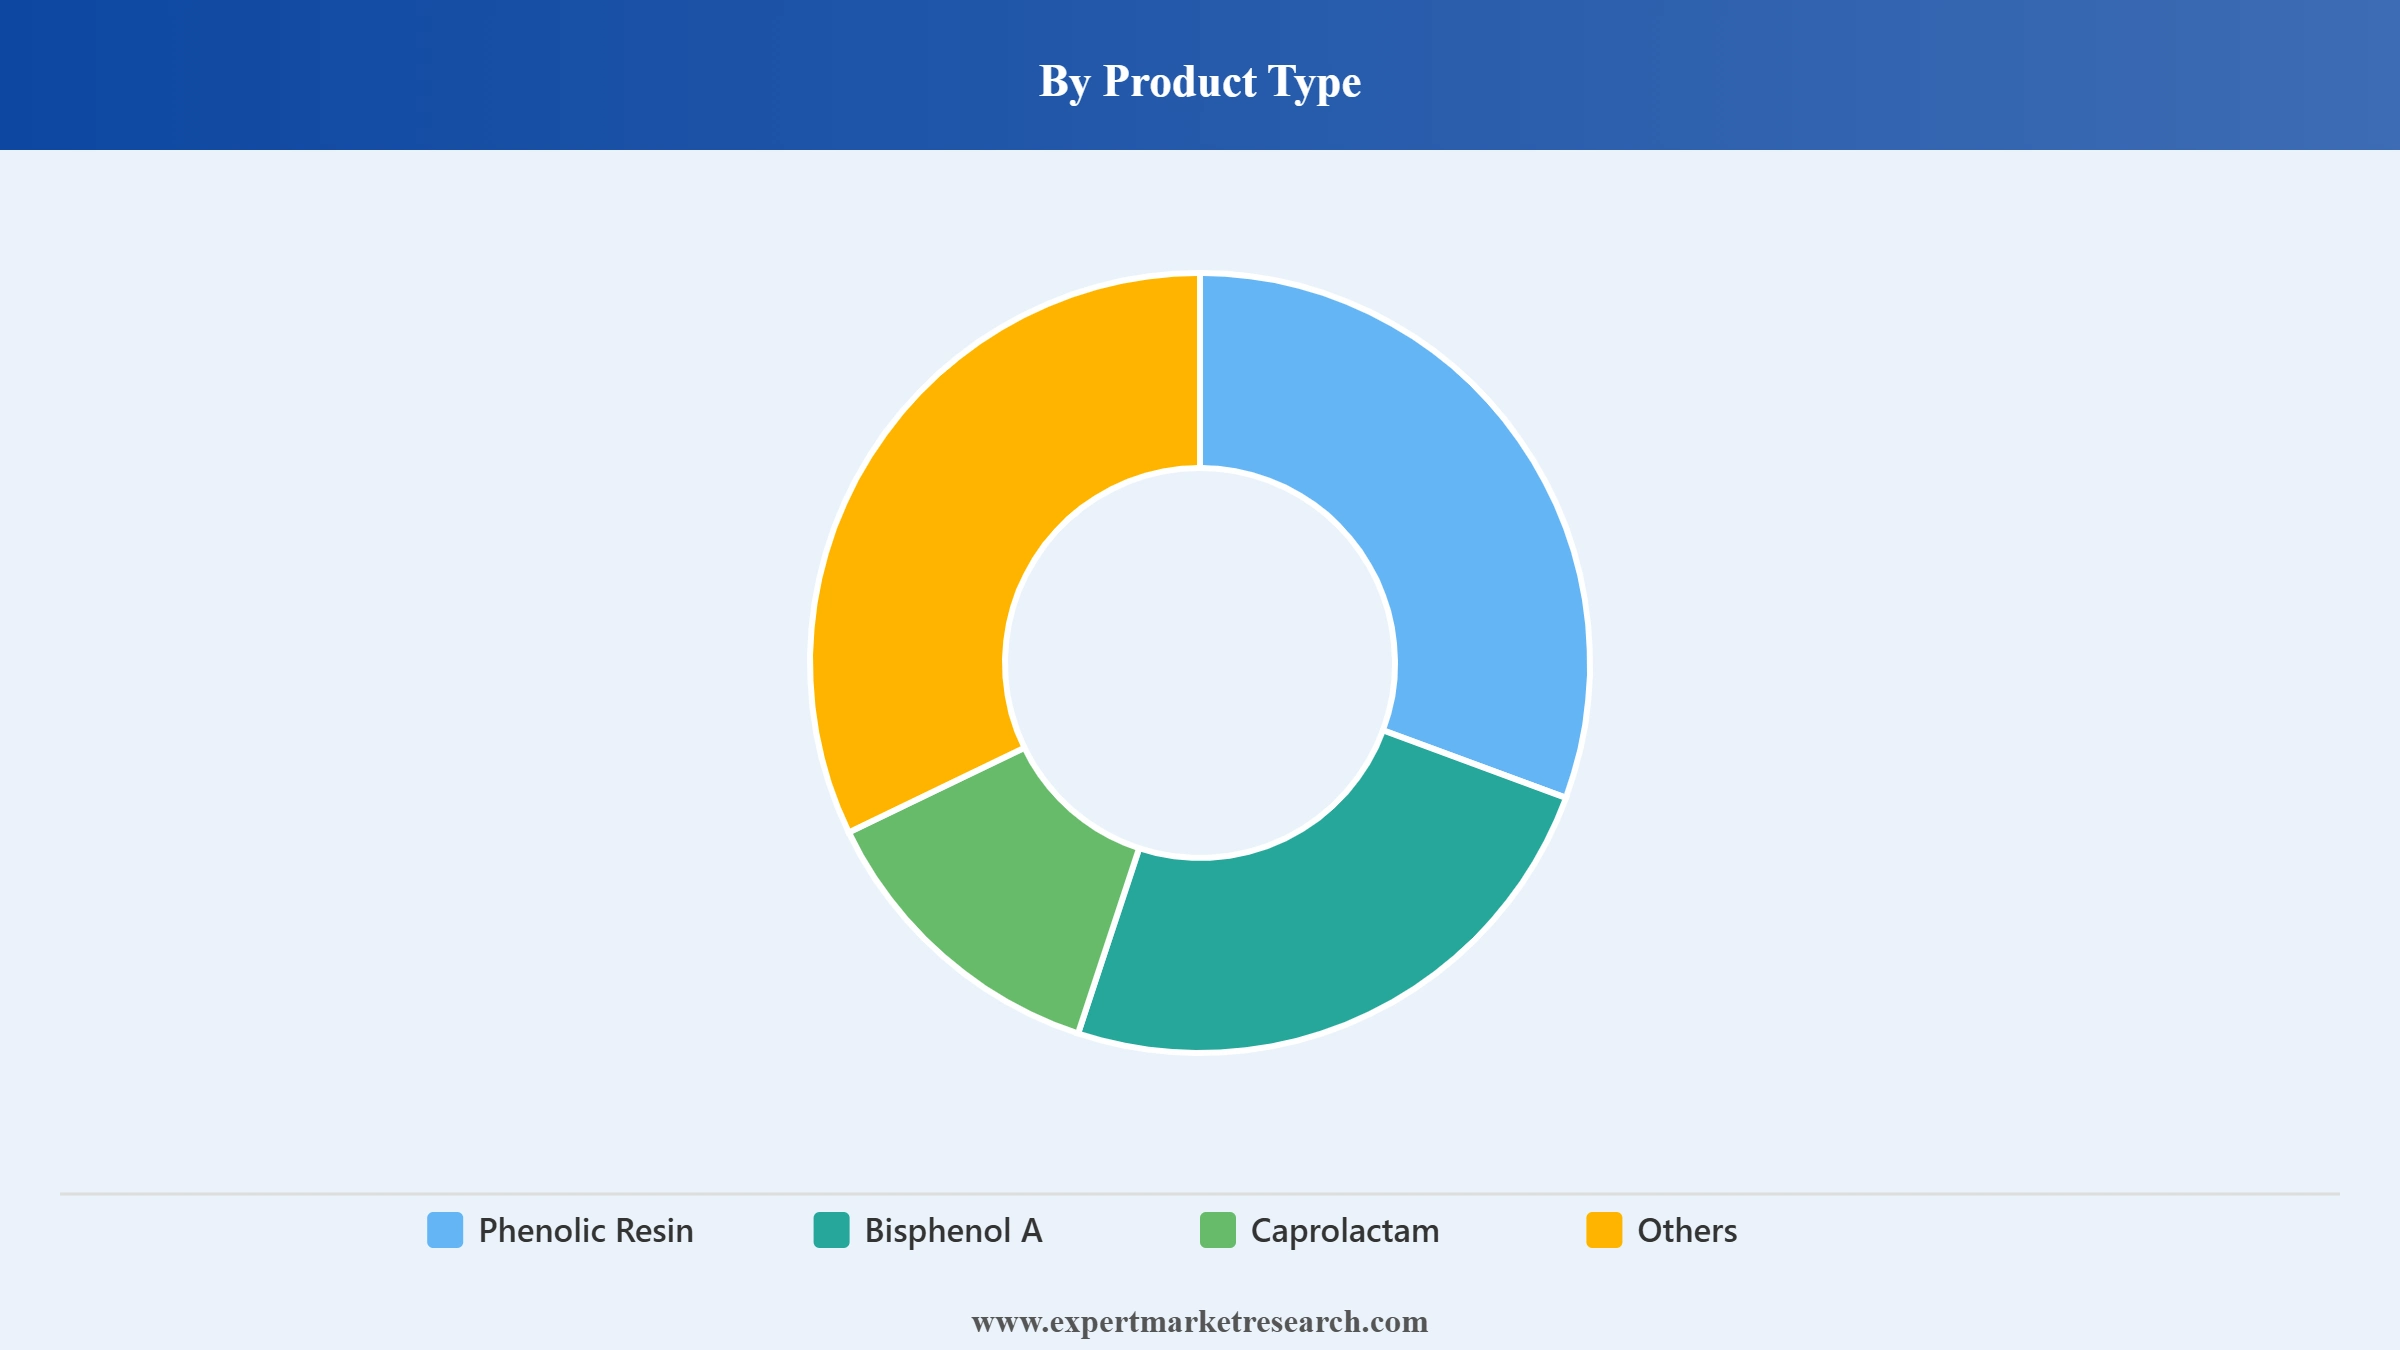
Phenolic resins are a significant segment, with a growing demand from various industries such as plastics, composites, and laminates. The cumene process is the most common technology used for manufacturing phenol, which is used in the production of phenolic resins.
Meanwhile, BPA is primarily used for manufacturing epoxy resins and polycarbonate, which are high-performing materials used in consumer electronics and industrial applications. The growing demand for BPA is expected to boost the market over the forecast period. Furthermore, the increasing demand for nylon for manufacturing technical textiles, carpets, and other applications is expected to drive the growth of the caprolactam segment during the forecast period.
"United States Phenol Market Report and Forecast 2026-2035" offers a detailed analysis of the market based on the following segments:
Market Breakup by Product Type
Market Breakup by Region


Read more about this report - REQUEST FREE SAMPLE COPY IN PDF
Market players are focusing on expanding their production capacity and investing in research and development activities to develop new and innovative phenol-based products.
Upto 15% Off
USD
$2499 $2249
$3999 $3599
$4999 $4249
$5999 $5099


*While we strive to always give you current and accurate information, the numbers depicted on the website are indicative and may differ from the actual numbers in the main report. At Expert Market Research, we aim to bring you the latest insights and trends in the market. Using our analyses and forecasts, stakeholders can understand the market dynamics, navigate challenges, and capitalize on opportunities to make data-driven strategic decisions.*
In 2025, the market attained a volume of 3.56 Billion Tons.
The market is expected to grow at a CAGR of 4.60% between 2026 and 2035.
The market is estimated to witness a healthy growth in the forecast period of 2026-2035 to reach a volume of 5.58 Billion Tons.
The popularity of phenol-based products in sectors such as automotive, construction, electronics, and healthcare has fuelled the demand for phenol in the region.
Key trends aiding the market expansion include increasing demand for phenol from the electronics industry, presence of many chemical manufacturing facilities, and favourable government policies.
Regions considered in the market are New England, Mideast, Great Lakes, Plains, Southeast, Southwest, Rocky Mountain, and Far West.
Based on product type, the market segmentations include phenolic resin, bisphenol A, and caprolactam, among others.
Key players in the market are INEOS AG, Mitsubishi Chemical Group Corporation, Honeywell International Inc., Shell PLC, Solvay SA, ALTIVIA, AdvanSix Inc., Capital Resin Corporation, and SI Group, Inc., among others.
Explore our key highlights of the report and gain a concise overview of key findings, trends, and actionable insights that will empower your strategic decisions.
| REPORT FEATURES | DETAILS |
| Base Year | 2025 |
| Historical Period | 2019-2025 |
| Forecast Period | 2026-2035 |
| Scope of the Report |
Historical and Forecast Trends, Industry Drivers and Constraints, Historical and Forecast Market Analysis by Segment:
|
| Breakup by Product Type |
|
| Breakup by Region |
|
| Market Dynamics |
|
| Competitive Landscape |
|
| Companies Covered |
|
Datasheet
One User
USD 2,499
USD 2,249
tax inclusive*
Single User License
One User
USD 3,999
USD 3,599
tax inclusive*
Five User License
Five User
USD 4,999
USD 4,249
tax inclusive*
Corporate License
Unlimited Users
USD 5,999
USD 5,099
tax inclusive*
*Please note that the prices mentioned below are starting prices for each bundle type. Kindly contact our team for further details.*
Flash Bundle
Small Business Bundle
Growth Bundle
Enterprise Bundle
*Please note that the prices mentioned below are starting prices for each bundle type. Kindly contact our team for further details.*
Flash Bundle
Number of Reports: 3
20%
tax inclusive*
Small Business Bundle
Number of Reports: 5
25%
tax inclusive*
Growth Bundle
Number of Reports: 8
30%
tax inclusive*
Enterprise Bundle
Number of Reports: 10
35%
tax inclusive*
How To Order

Select License Type
Choose the right license for your needs and access rights.

Click on ‘Buy Now’
Add the report to your cart with one click and proceed to register.

Select Mode of Payment
Choose a payment option for a secure checkout. You will be redirected accordingly.
Strategic Solutions for Informed Decision-Making
Gain insights to stay ahead and seize opportunities.

Get insights & trends for a competitive edge.

Track prices with detailed trend reports.

Analyse trade data for supply chain insights.

Leverage cost reports for smart savings

Enhance supply chain with partnerships.

Connect For More Information
Our expert team of analysts will offer full support and resolve any queries regarding the report, before and after the purchase.
Our expert team of analysts will offer full support and resolve any queries regarding the report, before and after the purchase.
We employ meticulous research methods, blending advanced analytics and expert insights to deliver accurate, actionable industry intelligence, staying ahead of competitors.
Our skilled analysts offer unparalleled competitive advantage with detailed insights on current and emerging markets, ensuring your strategic edge.
We offer an in-depth yet simplified presentation of industry insights and analysis to meet your specific requirements effectively.


