

Consumer Insights
Uncover trends and behaviors shaping consumer choices today
Procurement Insights
Optimize your sourcing strategy with key market data
Industry Stats
Stay ahead with the latest trends and market analysis.
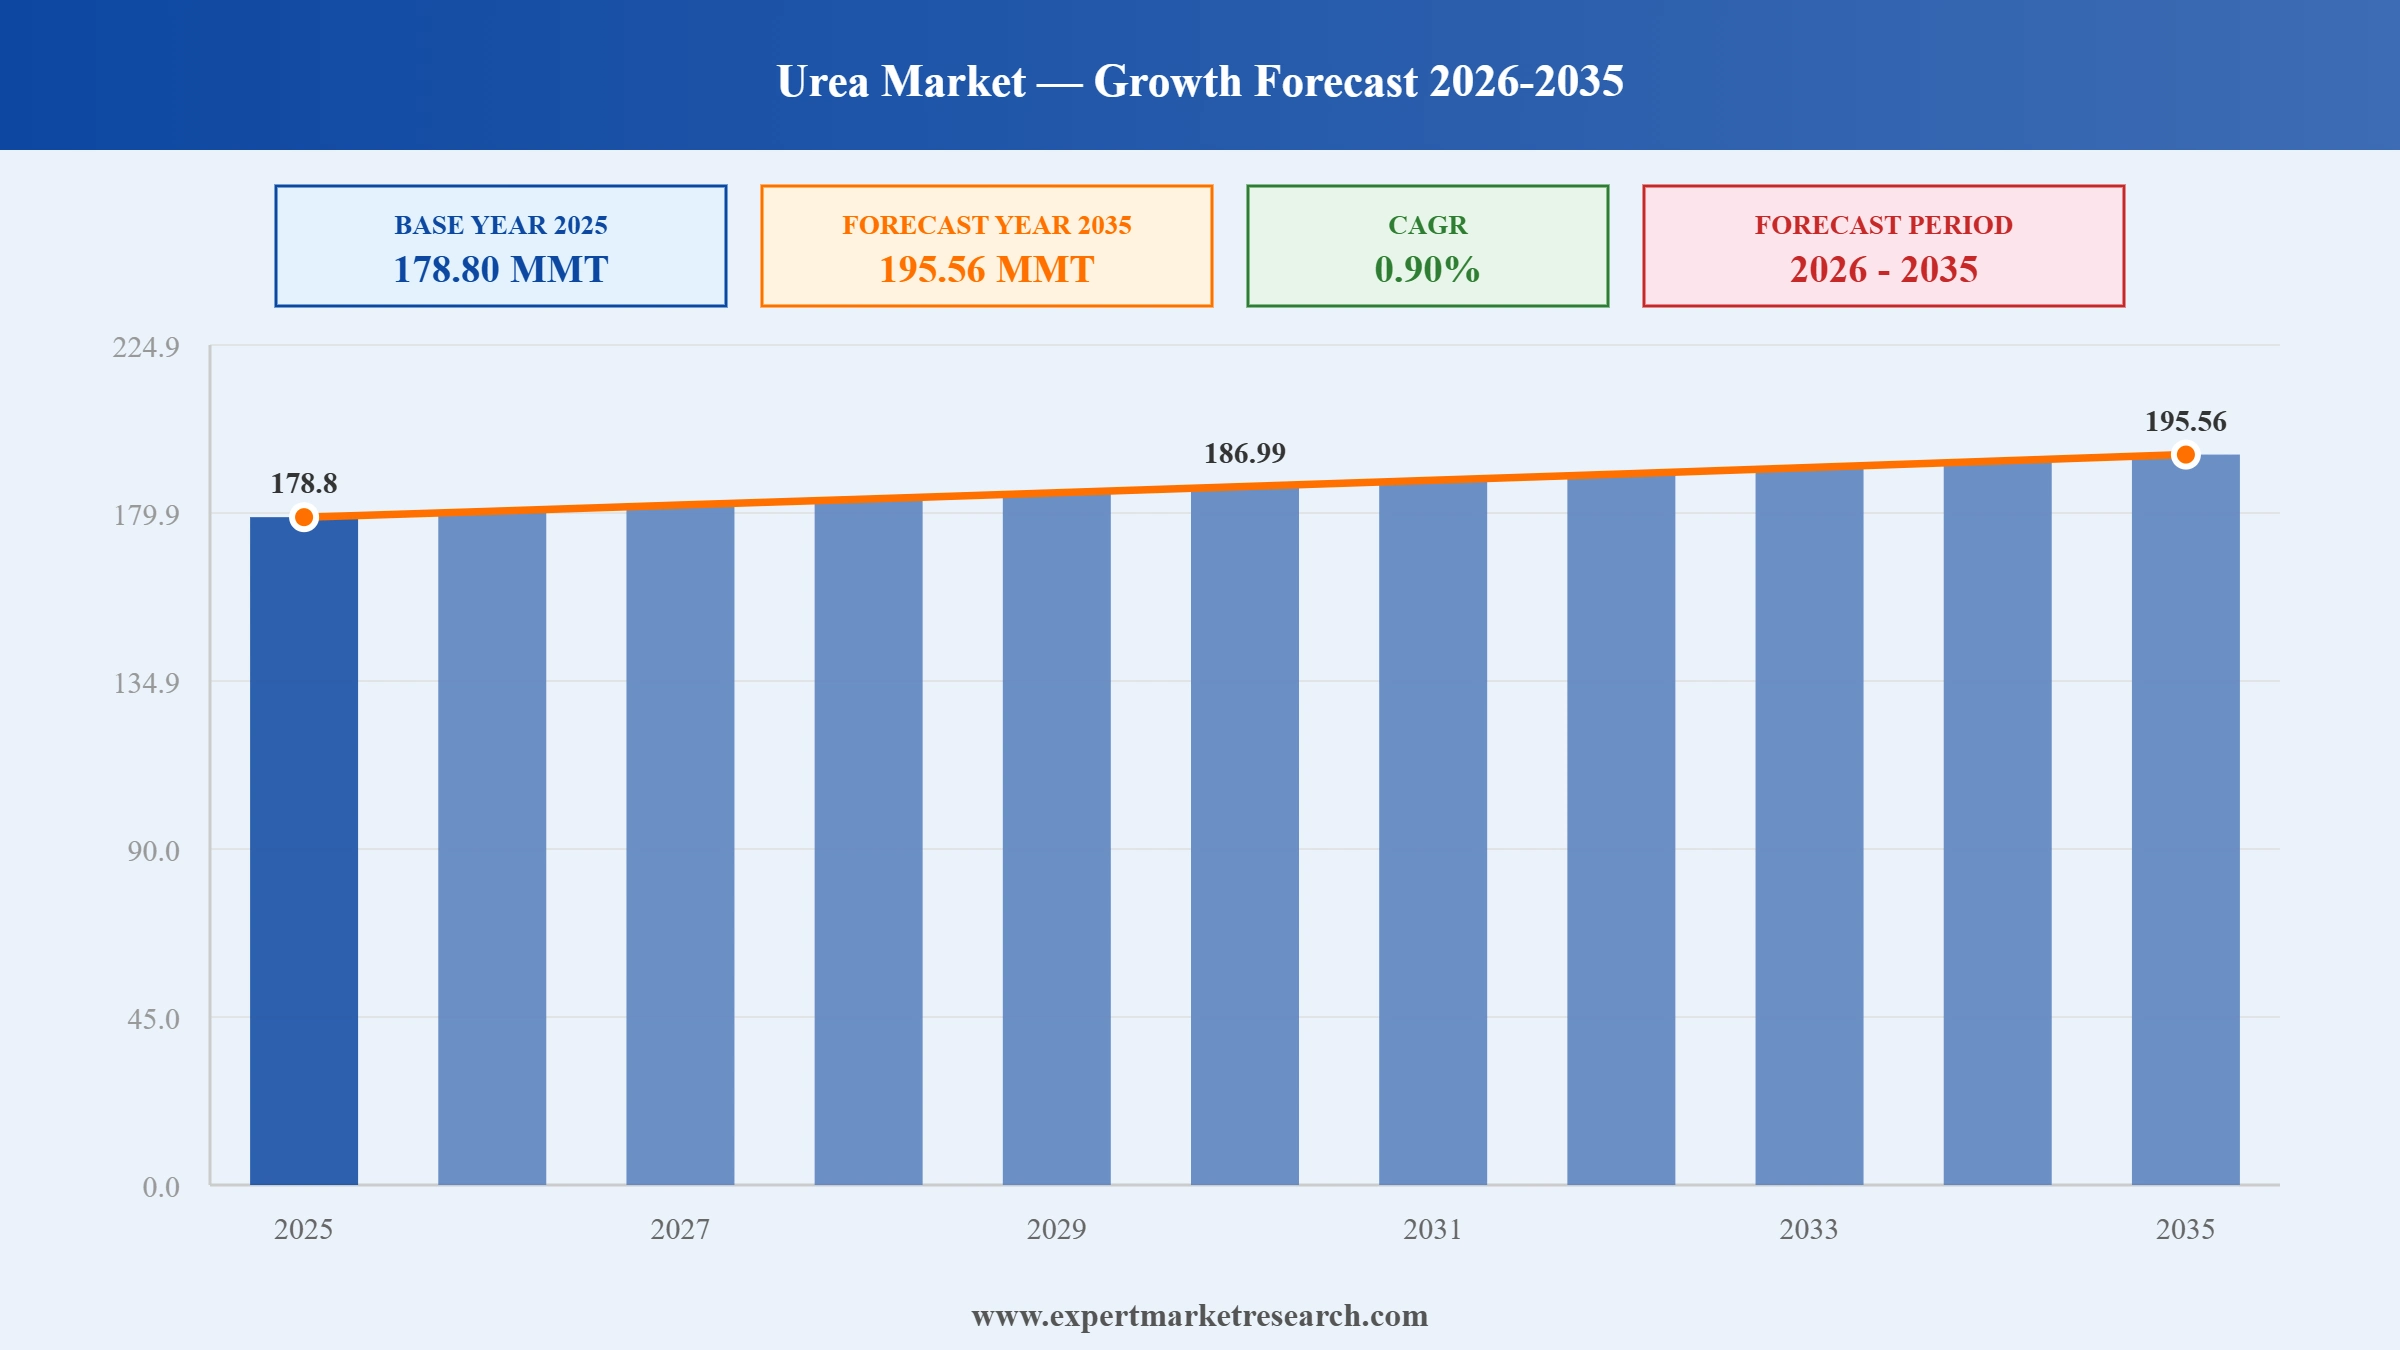
The global urea market size reached a volume of 178.80 MMT in 2025. It is expected to grow at a CAGR of 0.90% between 2026 and 2035. Sustained global food production requirements, expanding agricultural intensification in emerging economies, growing demand for urea formaldehyde resins in industrial applications, and the emergence of low-carbon ammonia and green urea initiatives are expected to drive the market to reach 195.56 MMT in 2035.
Read more about this report - REQUEST FREE SAMPLE COPY IN PDF
| Global Urea Market Report Summary | Description | Value |
| Base Year | MMT | 2025 |
| Historical Period | MMT | 2019-2025 |
| Forecast Period | MMT | 2026-2035 |
| Market Size 2025 | MMT | 178.80 |
| Market Size 2035 | MMT | 195.56 |
| CAGR 2019-2025 | Percentage | XX% |
| CAGR 2026-2035 | Percentage | 0.90% |
| CAGR 2026-2035 - Market by Region | Latin America | 1.3% |
| CAGR 2026-2035 - Market by Country | India | 1.3% |
| CAGR 2026-2035 - Market by Country | Saudi Arabia | 1.2% |
| CAGR 2026-2035 - Market by Application | Urea Formaldehyde (UF) and Melamine Resins | 1.7% |
| Market Share by Country 2025 | India | 19.5% |
The global urea market is navigating a period of moderate growth, shaped by stable agricultural demand, evolving industrial applications, and the emergence of green nitrogen production initiatives. Natural gas price volatility continues to influence production cost structures, while leading producers are accelerating investments in low-carbon ammonia and granular urea capacity to meet long-term sustainability requirements.
Yara International announced a strategic expansion to strengthen its global nitrogen and urea supply chain, with emphasis on low-carbon ammonia production facilities aimed at reducing the carbon intensity of its urea product portfolio across major agricultural markets.
Nutrien expanded its nitrogen production and distribution network through targeted strategic investments, strengthening its supply position in North American and international urea markets to support growing agricultural customer demand for reliable fertiliser supply.
Nutrien reported significant growth in sales of its ESN Smart Nitrogen controlled-release urea product across North American markets, reflecting growing farmer preference for precision nutrient delivery technologies that improve nitrogen use efficiency in the global urea market.
Yara International and Nutrien independently advanced granular urea production capacity expansion programmes, reflecting long-term confidence in agricultural demand fundamentals and the strategic shift toward higher-value granular formats preferred by farmers in major global urea market consuming regions.
Global population growth and rising per capita consumption are sustaining long-term demand for nitrogen fertilisers in the global urea market. Agricultural intensification across South Asia, Southeast Asia, and Latin America is expanding urea consumption as governments pursue food security objectives.
Leading producers in the global urea market are accelerating investment in low-carbon ammonia technologies, including electrolysis-based green hydrogen feedstocks and carbon capture and storage systems. These initiatives aim to decarbonise urea manufacturing and meet emerging low-emission fertiliser procurement standards globally.
The global urea market is benefiting from steady industrial demand for urea formaldehyde and melamine-based resins used in wood adhesives, laminates, and moulding compounds. Construction activity recovery across Asia and North America is supporting consistent long-term resin-grade urea consumption growth.
Natural gas price fluctuations continue shaping urea production economics and trade flows within the global urea market. High-cost European producers face competitive pressure from Middle Eastern and Asian suppliers with lower feedstock costs, influencing regional price dynamics and import volumes.
Controlled-release and enhanced efficiency urea products are gaining adoption across the global urea market as farmers seek to improve nitrogen use efficiency and reduce losses. Regulatory pressure on nitrous oxide emissions in Europe and North America is accelerating this shift.
The report of the Expert Market Research's titled "Global Urea Market Report and Forecast 2026-2035" offers a detailed analysis of the market based on the following segments:
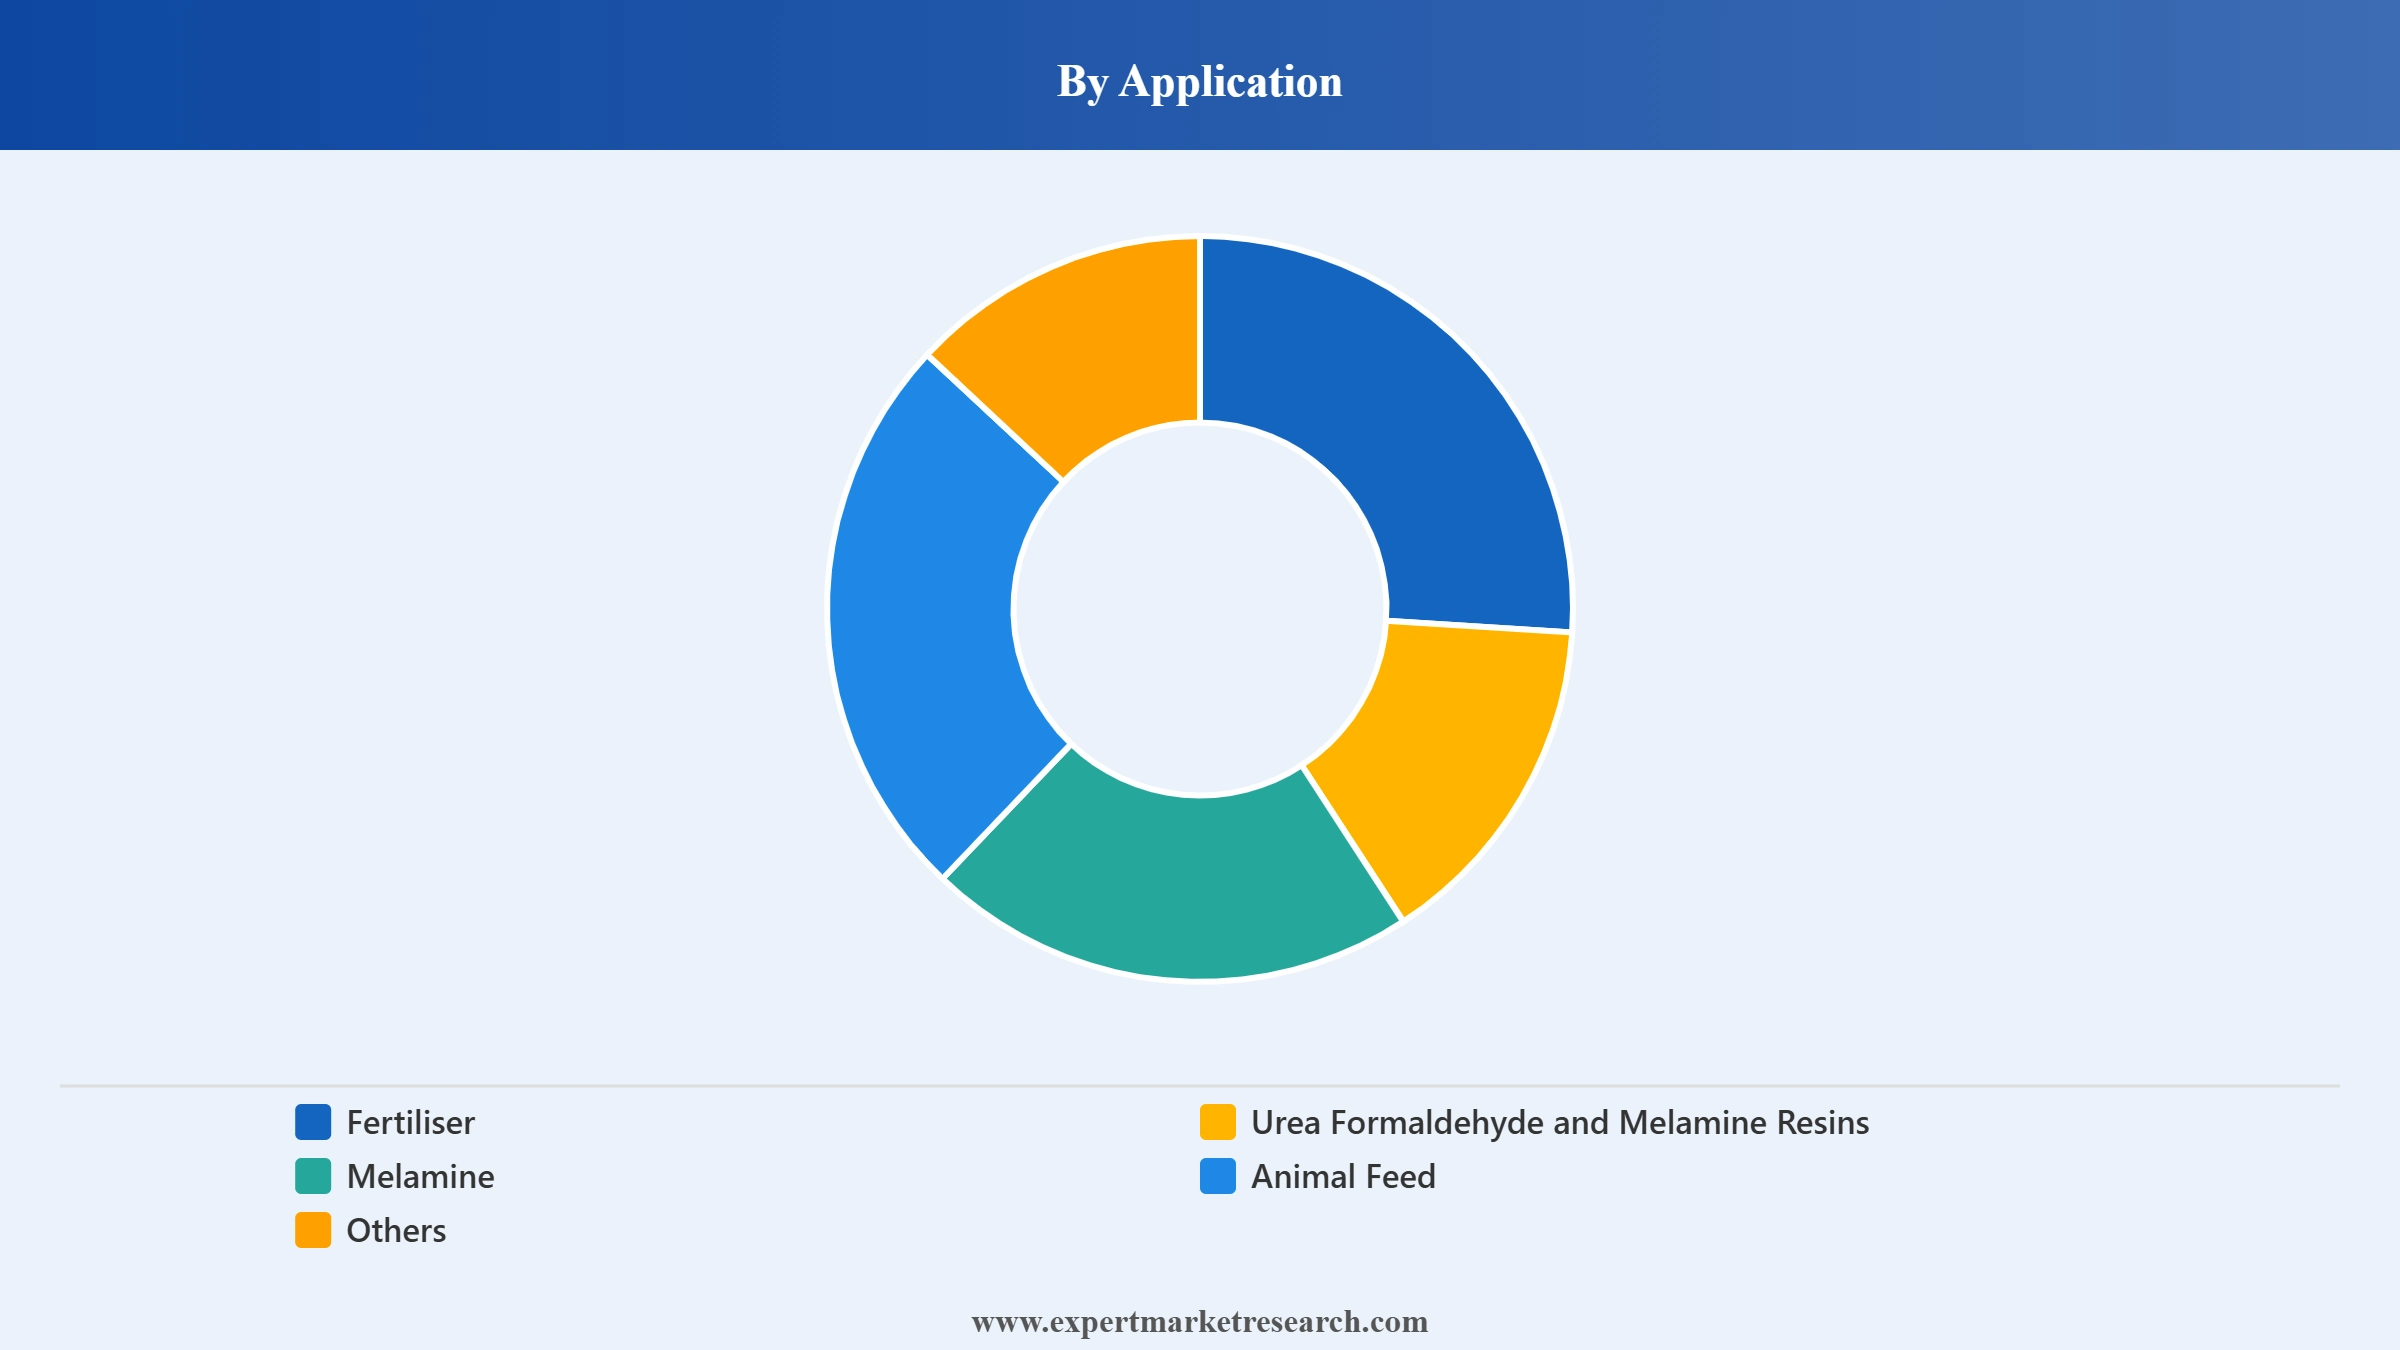
Market Breakup by Application
Key Insight: Fertiliser dominates the global urea market by application, accounting for approximately 80% of total consumption, driven by its role as the world's most widely applied synthetic nitrogen fertiliser. Urea's high nitrogen content, relative cost efficiency, and compatibility with diverse crop systems sustain its position across major grain and cash crop producing regions. Urea formaldehyde and melamine resins represent the second largest application, serving the construction and furniture manufacturing sectors.
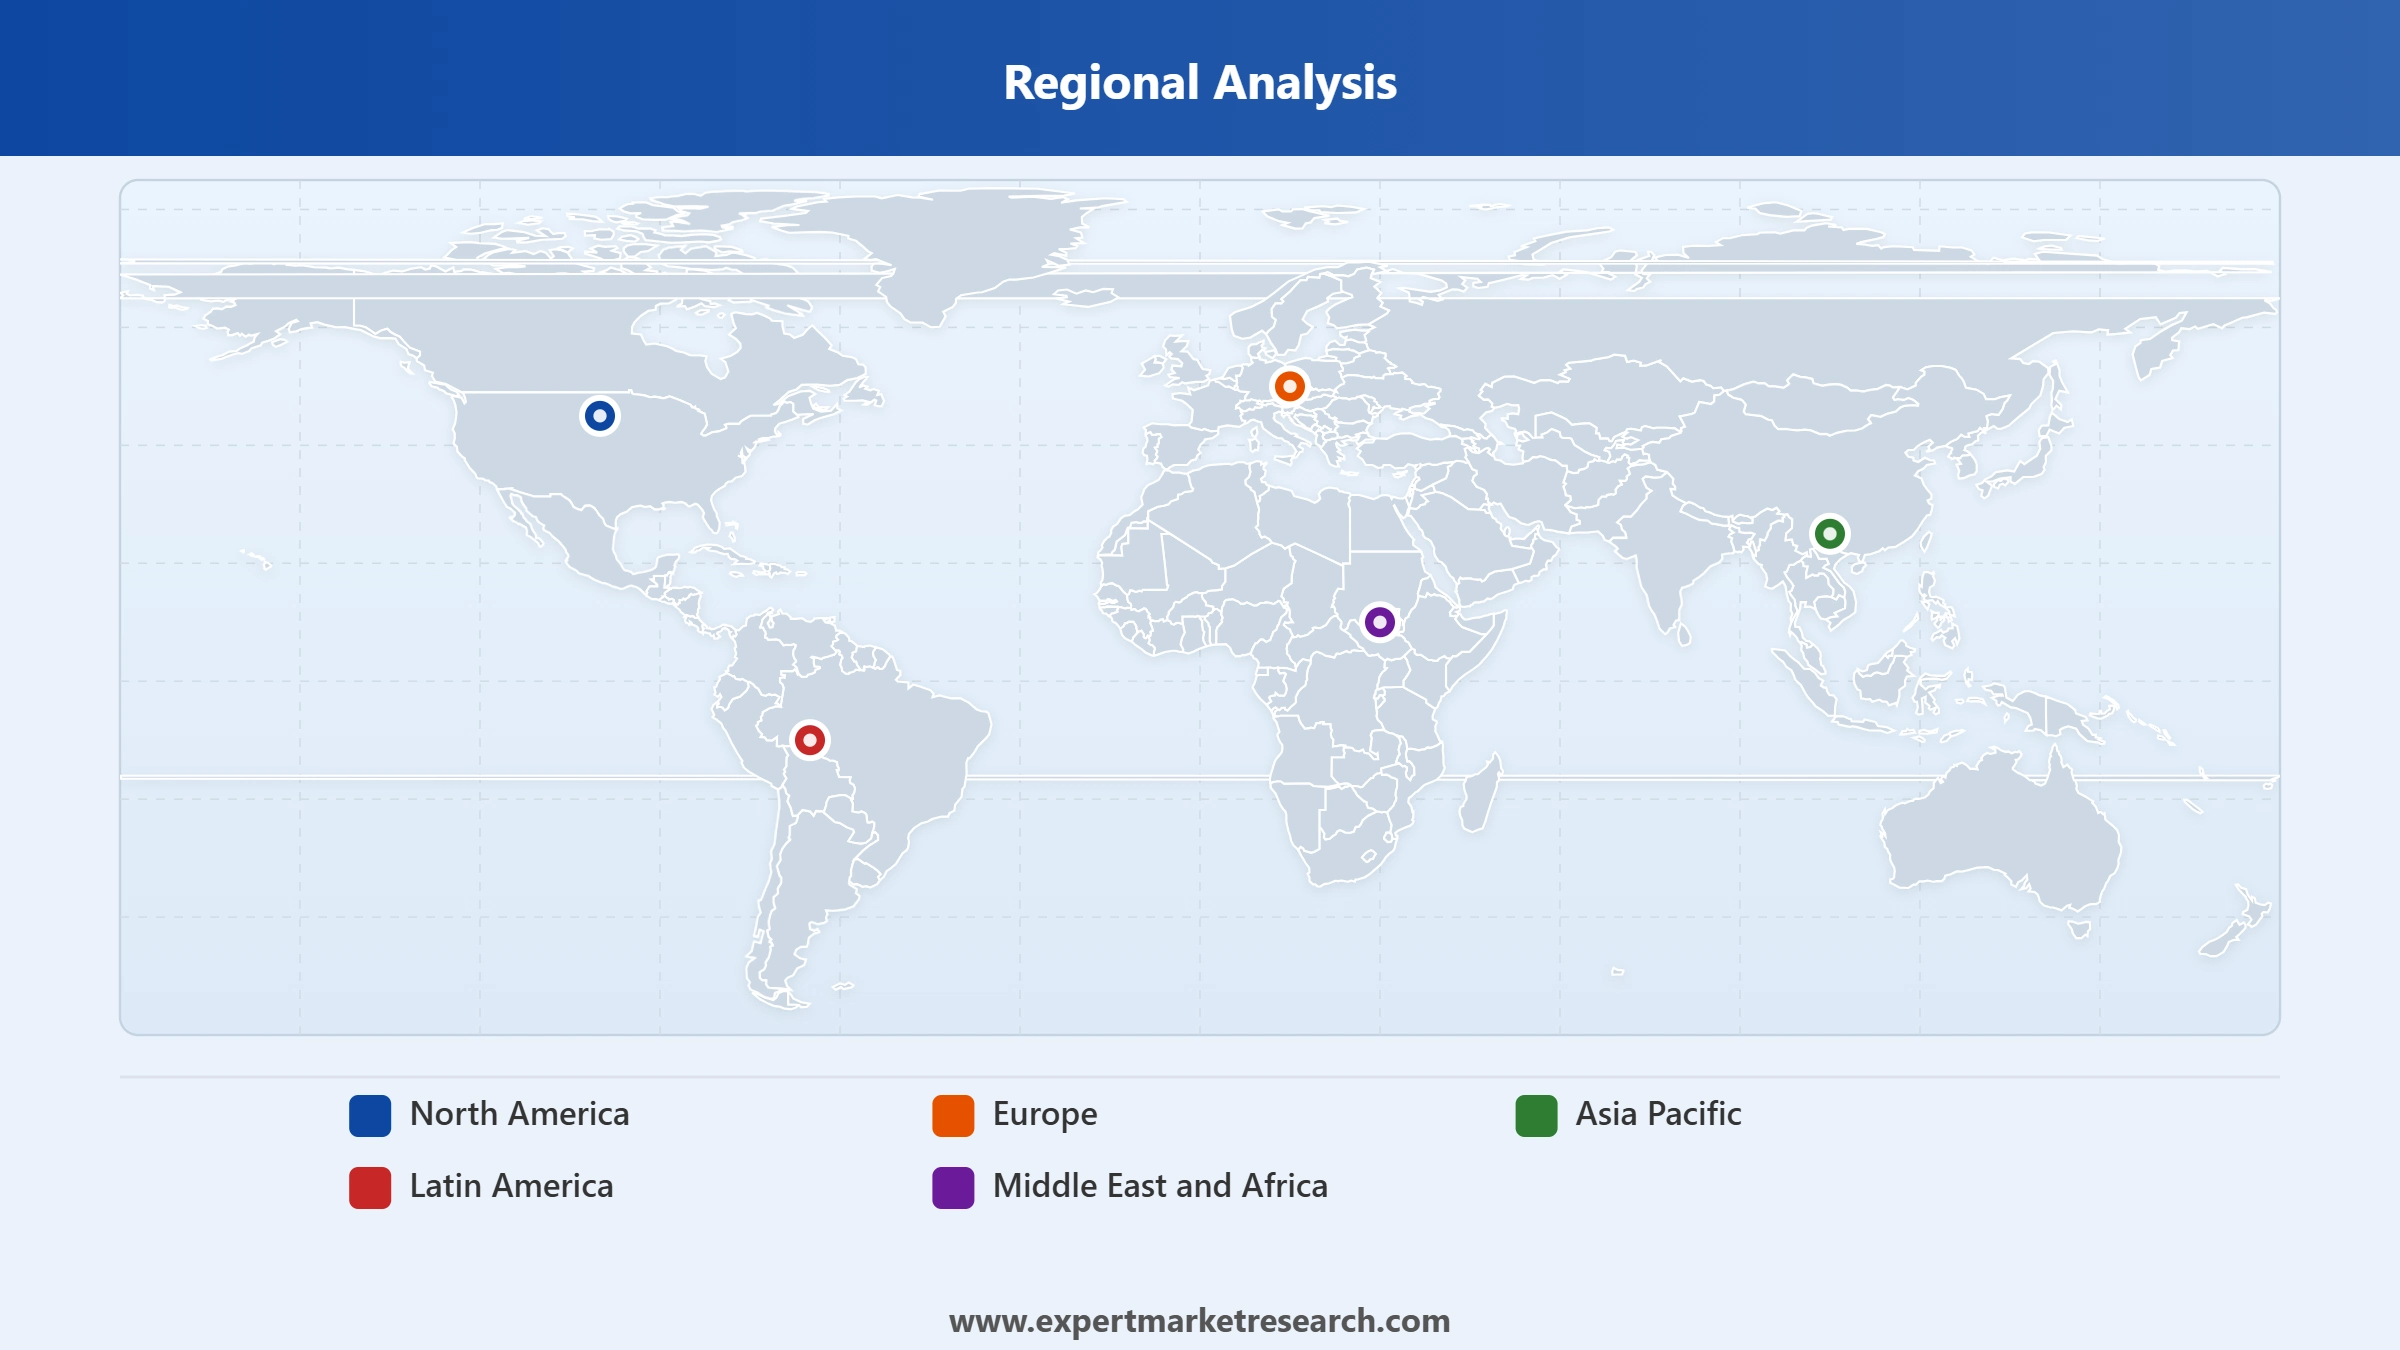
Market Breakup by Region
Key Insight: Asia Pacific is the dominant regional market in the global urea industry, accounting for the largest production and consumption volumes, led by China and India. Latin America is the fastest-growing region, driven by Brazil's expanding soybean and corn cultivation and rising fertiliser import requirements. The Middle East and Africa region hosts major low-cost urea production capacity, with countries such as Qatar and Saudi Arabia playing key roles as global exporters.


Read more about this report - REQUEST FREE SAMPLE COPY IN PDF
By Application, fertiliser dominates the market due to urea's role as the world's leading synthetic nitrogen nutrient
Fertiliser accounts for approximately 80% of global urea consumption, making it the dominant application segment in the global urea market. Urea's high nitrogen concentration of 46% by weight, cost effectiveness, and ease of application across broadcast, blend, and fluid fertiliser systems underpin its leading market position. Demand is concentrated in major grain producing regions including South Asia, China, the United States, and Brazil, where nitrogen is the primary limiting factor in crop yield optimisation.
Read more about this report - REQUEST FREE SAMPLE COPY IN PDF
Urea formaldehyde and melamine resins represent the second most significant application in the global urea market, utilising industrial-grade urea as a key chemical feedstock. These resins are widely used as adhesives in particleboard, medium-density fibreboard, and plywood manufacturing, as well as in moulding compounds and laminates. Recovery in residential and commercial construction activity across Asia Pacific and North America is sustaining stable resin-grade urea demand across major producing regions.
By Region, Asia Pacific leads the market due to the largest urea production and agricultural consumption base
Asia Pacific dominates the global urea market, encompassing the world's largest urea producers and consumers, anchored by China and India. China's domestic production capacity is the largest globally, with state-owned and private producers meeting domestic agricultural demand and exporting surplus volumes to regional markets. India remains one of the world's largest urea importers, with government subsidy programmes underpinning consistent domestic fertiliser demand growth regardless of international price cycles.
Read more about this report - REQUEST FREE SAMPLE COPY IN PDF
Latin America is the fastest-growing region in the global urea market, driven predominantly by Brazil's expanding agricultural sector and rising nitrogen fertiliser import requirements. Brazilian soybean and corn cultivation areas have expanded significantly over the past decade, creating consistent demand growth for urea imports from major exporting regions. In February 2026, Nutrien expanded its nitrogen production and distribution network to strengthen its supply positioning in key Latin American agricultural markets.
Asia Pacific leads the market driven by China's dominant production scale and India's large fertiliser import requirements
Asia Pacific leads the global urea market in both production capacity and consumption volume, supported by the region's vast agricultural base and significant government investment in domestic fertiliser supply security. China's urea industry is the world's largest, operating through a mix of state-owned chemical groups and private coal-based producers. India's dependence on urea imports, combined with government subsidy programmes supporting affordability for smallholder farmers, sustains high and predictable import volumes.
Latin America represents the most dynamic growth region in the global urea market, with Brazil's agricultural sector driving consistent demand expansion. The country's Cerrado region continues to absorb new cultivation areas, increasing nitrogen fertiliser requirements year on year. In April 2026, Yara International announced a strategic expansion focused on strengthening its global nitrogen supply chain and advancing low-carbon urea initiatives to serve demanding agricultural markets across South America and beyond.
The global urea market is characterised by a mix of large state-owned producers, international fertiliser majors, and regional players competing across production, distribution, and end-market sales. Market consolidation is limited, with numerous producers across Asia, the Middle East, and North America serving diverse agricultural and industrial customers. Natural gas access, production cost efficiency, and export infrastructure are primary determinants of competitive positioning.
Yara International ASA is the world's leading crop nutrition company, headquartered in Oslo, Norway, with production facilities across Europe, the Americas, and Australia. Yara produces and distributes urea, ammonia, and specialty fertilisers globally, advancing decarbonisation through green ammonia and low-carbon urea initiatives, reinforcing its position as a premier supplier in the global urea market.
IFFCO is India's largest fertiliser cooperative, headquartered in New Delhi, and one of the world's largest urea producers. Operating multiple large-scale urea manufacturing complexes across India, IFFCO supplies domestic agricultural markets and exports to international destinations, playing a critical role in India's food security strategy and the global urea market supply chain.
PT Pupuk Kalimantan Timur, also known as Pupuk Kaltim, is Indonesia's largest urea producer, headquartered in Bontang, East Kalimantan. Operating five urea production plants with a combined annual capacity exceeding 3.4 million tonnes, Pupuk Kaltim serves Indonesian domestic agricultural markets and exports urea to regional Asia Pacific customers in the global urea market.
Qatar Fertiliser Company, known as QAFCO, is one of the world's largest single-site urea and ammonia producers, operating in Mesaieed, Qatar. Leveraging Qatar's abundant natural gas reserves, QAFCO produces cost-competitive urea for global export markets, and is a significant supplier to Asia Pacific, Latin America, and Africa through the global urea market trading network.
Other key players in the market include National Fertilizers Limited, EuroChem Group AG, Saudi Arabian Fertilizer Company, CF Industries Holdings Inc., Nutrien Ltd., and Others.
*Please note that this is only a partial list; the complete list of key players is available in the full report. Additionally, the list of key players can be customized to better suit your needs.*
Explore in-depth insights on the global urea market 2026 with our comprehensive industry report. Stay informed on low-carbon nitrogen developments, Latin America demand growth, agricultural policy shifts, and production capacity dynamics shaping the market through 2035. Whether you are a fertiliser producer evaluating capacity investments, a distributor monitoring trade flows, or an investor assessing commodity exposure, this report delivers the strategic intelligence you need. Download your free sample today and uncover key opportunities in the evolving global urea market.
Agricultural Commodity Distribution Networks
Bulk Fertilizer Storage And Handling Systems
SCR Chemicals and Emission Control Reagents
Upto 15% Off
USD
$2499 $2249
$3999 $3599
$4999 $4249
$5999 $5099


*While we strive to always give you current and accurate information, the numbers depicted on the website are indicative and may differ from the actual numbers in the main report. At Expert Market Research, we aim to bring you the latest insights and trends in the market. Using our analyses and forecasts, stakeholders can understand the market dynamics, navigate challenges, and capitalize on opportunities to make data-driven strategic decisions.*
The global market attained a volume of 178.80 MMT in 2025.
The market is projected to grow at a CAGR of 0.90% between 2026 and 2035.
The key applications include fertiliser, urea formaldehyde (UF) and melamine resins, melamine (cyanurates), animal feed, and others.
The key regional markets for urea are North America, Europe, the Asia Pacific, Latin America, and the Middle East and Africa.
The key exporters include China, South Korea, and Thailand.
The major drivers are the rising population, the increasing requirement for fertilisers amidst the demand for food, and the presence of favourable government initiatives.
The key trend includes research activities aimed at developing innovative processes and devices by using technologies like electrocatalysis for manufacturing environmentally friendly urea as one of the alternative solutions to industrial urea production, reducing energy usage.
The key players in the market include Yara International ASA, Indian Farmers Fertilisers Cooperative Limited, PT Pupuk Kalimantan Timur, Qatar Fertilizer Company, National Fertilizers Limited, EuroChem Group AG, Saudi Arabian Fertilizer Company, CF Industries Holdings, Inc, and Nutrien Ltd, among others.
The Asia Pacific region is the largest consumer of urea.
Yara International, CF Industries Holdings Inc., OCI Nitrogen, and EuroChem Group AG are some of the major suppliers.
Environmental regulations, fluctuating raw material prices, and supply chain disruptions are some major challenges.
The market is estimated to witness a healthy growth in the forecast period of 2026-2035 to reach 195.56 MMT by 2035.
Explore our key highlights of the report and gain a concise overview of key findings, trends, and actionable insights that will empower your strategic decisions.
| REPORT FEATURES | DETAILS |
| Base Year | 2025 |
| Historical Period | 2019-2025 |
| Forecast Period | 2026-2035 |
| Scope of the Report |
Historical and Forecast Trends, Industry Drivers and Constraints, Historical and Forecast Market Analysis by Segment:
|
| Breakup by Application |
|
| Breakup by Region |
|
| Market Dynamics |
|
| Competitive Landscape |
|
| Companies Covered |
|
Datasheet
One User
USD 2,499
USD 2,249
tax inclusive*
Single User License
One User
USD 3,999
USD 3,599
tax inclusive*
Five User License
Five User
USD 4,999
USD 4,249
tax inclusive*
Corporate License
Unlimited Users
USD 5,999
USD 5,099
tax inclusive*
*Please note that the prices mentioned below are starting prices for each bundle type. Kindly contact our team for further details.*
Flash Bundle
Small Business Bundle
Growth Bundle
Enterprise Bundle
*Please note that the prices mentioned below are starting prices for each bundle type. Kindly contact our team for further details.*
Flash Bundle
Number of Reports: 3
20%
tax inclusive*
Small Business Bundle
Number of Reports: 5
25%
tax inclusive*
Growth Bundle
Number of Reports: 8
30%
tax inclusive*
Enterprise Bundle
Number of Reports: 10
35%
tax inclusive*
How To Order

Select License Type
Choose the right license for your needs and access rights.

Click on ‘Buy Now’
Add the report to your cart with one click and proceed to register.

Select Mode of Payment
Choose a payment option for a secure checkout. You will be redirected accordingly.
Strategic Solutions for Informed Decision-Making
Gain insights to stay ahead and seize opportunities.

Get insights & trends for a competitive edge.

Track prices with detailed trend reports.

Analyse trade data for supply chain insights.

Leverage cost reports for smart savings

Enhance supply chain with partnerships.

Connect For More Information
Our expert team of analysts will offer full support and resolve any queries regarding the report, before and after the purchase.
Our expert team of analysts will offer full support and resolve any queries regarding the report, before and after the purchase.
We employ meticulous research methods, blending advanced analytics and expert insights to deliver accurate, actionable industry intelligence, staying ahead of competitors.
Our skilled analysts offer unparalleled competitive advantage with detailed insights on current and emerging markets, ensuring your strategic edge.
We offer an in-depth yet simplified presentation of industry insights and analysis to meet your specific requirements effectively.


