

Consumer Insights
Uncover trends and behaviors shaping consumer choices today
Procurement Insights
Optimize your sourcing strategy with key market data
Industry Stats
Stay ahead with the latest trends and market analysis.
The global virtual payment (POS) terminals market size reached around USD 26.40 Billion in 2025. The market is projected to grow at a CAGR of 30.30% between 2026 and 2035 to reach nearly USD 372.43 Billion by 2035.
Compound Annual Growth Rate
30.3%
Value in USD Billion
2026-2035
Point of Sale (POS) systems offer numerous benefits to businesses. They streamline and speed up transactions, improving customer satisfaction. By providing real-time inventory tracking, POS systems help manage stock efficiently and prevent overstocking or shortages. They generate comprehensive sales reports and analytics that provide valuable insights into business performance and customer preferences, thereby driving the virtual payment (POS) terminals market demand.
The virtual payment (POS) terminals market dynamics and trends are being shaped by enhanced features such as loyalty programs and personalized promotions, which improve customer experience and encourage repeat business. POS systems also support secure payment processing, integrate with other business systems, and reduce errors by automating transactions. They include data backup and recovery options and are scalable, accommodating business growth and evolving needs.
Read more about this report - REQUEST FREE SAMPLE COPY IN PDF
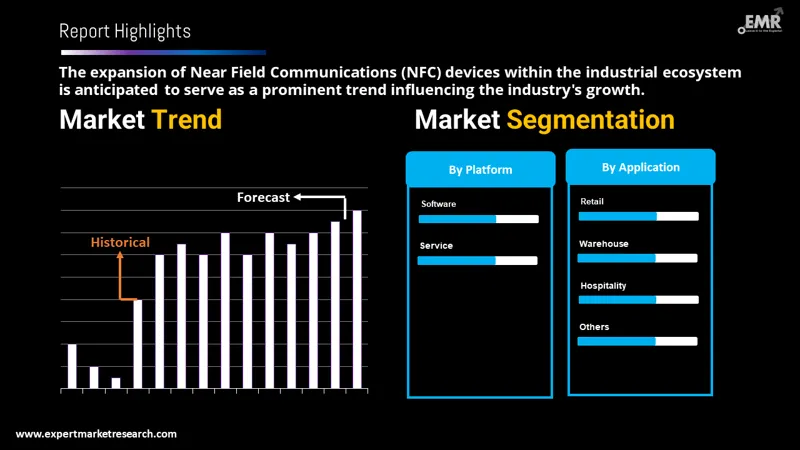
The market is being driven by the proliferation of near-field communications (NFC) devices in the industrial ecosystem and the increasing demand for contactless payments. The increasing demand for these terminals in the next couple of years is expected to raise investments in technology like end-to-end encryption for safe payment solutions and consumer convenience. Because of the increased mobile penetration, large companies in the business are concentrating more on technology advancements. These factors are expected to drive the growth of the virtual payment (POS) terminals industry.
According to Deutsche Bundesbank, mobile payments at the point of sale (POS) in Germany experienced notable growth. In 2021, mobile payments made up 2.7% of turnover, up from 2.1% in 2020. By transaction volume, mobile payments represented 2.6% in 2021, an increase from 2.2% in the previous year.
In India, in the financial year 2017-18, the volume of digital transactions was USD 246.45 million. This trend continued to grow, with transactions reaching USD 1,601.98 million in 2022-23 as reported by the Reserve Bank of India (RBI), The National Payments Corporation of India (NPCI) and the DIGIDHAN Portal, thus contributing to the growth of the virtual payment (POS) terminals market as these systems are essential in the digital payments sector, offering secure and efficient transaction solutions.
In China, the volume of electronic transactions handled by commercial banks increased in 2023. Banks processed 296.163 billion electronic payment transactions totalling USD 471.06 trillion, marking a 6.17% rise in transaction volume and a 9.17% increase in transaction value year on year. Mobile payment transactions grew by 16.81% yearly, reaching 1851.47 billion. Additionally, non-bank payment institutions processed 1.23 trillion online payment transactions amounting to USD 47.21 trillion, reflecting a 17.02% increase in transaction volume and an 11.46% rise in transaction value compared to the previous year as reported by the People's Bank of China.
As per the Census Bureau of the Department of Commerce, the United States retail e-commerce sales for the first quarter of 2024, adjusted for seasonal variation but not for price changes, totalled USD 289.2 billion. This represents a 2.1% increase from the fourth quarter of 2023. Total retail sales for the same period were estimated at USD 1,820.0 billion. In the first quarter of 2024, e-commerce sales grew by 8.6%, compared to a 1.5% increase in total retail sales. E-commerce now represents 15.9% of total retail sales, boosting the virtual payment (POS) terminals market revenue as these terminals enable secure and seamless online transactions by supporting diverse payment methods such as credit and debit cards, mobile wallets, and digital currencies.
According to Eurostat, in the European Union, 92% of individuals aged 16-74 used the internet within the past 12 months, and 70% of them purchased or ordered goods or services online in 2023, marking a 2% increase from 2022. The Netherlands (93%), Sweden (91%), and Denmark (90%) reported the highest percentages of online shoppers in 2023.
Read more about this report - REQUEST FREE SAMPLE COPY IN PDF
“Global Virtual Payment (POS) Terminals Market Report and Forecast 2026-2035” offers a detailed analysis of the market based on the following segments:
Market Breakup by Platform
Market Breakup by Application
Market Breakup by Region


The growth of the virtual payment (POS) terminals market is accelerating, driven by the advantages POS systems provide in both consumer electronics and food & beverage sectors. In consumer electronics, POS systems facilitate efficient transactions, real-time inventory management, and enhanced customer experiences through personalization.
In the food & beverage industry, they expedite checkout processes, optimize order management with kitchen displays, and offer insightful sales analytics. These features boost operational efficiency, accuracy, and customer satisfaction, which in turn improves inventory management and strategic planning, thereby driving the virtual payment (POS) terminals demand growth.
The companies provide cutting-edge payment solutions, focusing on secure, high-performance POS terminals and hardware for card payments, mobile transactions, and digital wallets, supporting global businesses with advanced technology and services.
Upto 15% Off
USD
$2499 $2249
$3999 $3599
$4999 $4249
$5999 $5099


*While we strive to always give you current and accurate information, the numbers depicted on the website are indicative and may differ from the actual numbers in the main report. At Expert Market Research, we aim to bring you the latest insights and trends in the market. Using our analyses and forecasts, stakeholders can understand the market dynamics, navigate challenges, and capitalize on opportunities to make data-driven strategic decisions.*
In 2025, the market attained a value of nearly USD 26.40 Billion.
The market is assessed to grow at a CAGR of 30.30% between 2026 and 2035.
The market is estimated to witness a healthy growth in the forecast period of 2026-2035 to reach about USD 372.43 Billion by 2035.
The major drivers of the market include the rising disposable incomes, increasing population, and the growing demand for contactless payments.
The increasing incorporation of Near Field Communications (NFC) devices in the industrial ecosystem and growing urbanisation are expected to be major key trends guiding the growth of the market.
The market is broken down into North America, Europe, Asia Pacific, Latin America, the Middle East, and Africa.
The leading platforms of virtual payment (POS) terminals in the market are software and services.
The significant applications of virtual payment (POS) terminals in the market are retail, warehouse, hospitality, consumer electronics, food and beverage, health care, and entertainment, among others.
The competitive landscape consists of INGENICO Group S.A., NCR Corporation, NEC Corporation, PAX Technology, Samsung Electronics Co Ltd., and VeriFone Inc., among others.
Explore our key highlights of the report and gain a concise overview of key findings, trends, and actionable insights that will empower your strategic decisions.
| REPORT FEATURES | DETAILS |
| Base Year | 2025 |
| Historical Period | 2019-2025 |
| Forecast Period | 2026-2035 |
| Scope of the Report |
Historical and Forecast Trends, Industry Drivers and Constraints, Historical and Forecast Market Analysis by Segment:
|
| Breakup by Platform |
|
| Breakup by Application |
|
| Breakup by Region |
|
| Market Dynamics |
|
| Competitive Landscape |
|
| Companies Covered |
|
| Report Price and Purchase Option | Explore our purchase options that are best suited to your resources and industry needs. |
| Delivery Format | Delivered as an attached PDF and Excel through email, with an option of receiving an editable PPT, according to the purchase option. |
Datasheet
One User
USD 2,499
USD 2,249
tax inclusive*
Single User License
One User
USD 3,999
USD 3,599
tax inclusive*
Five User License
Five User
USD 4,999
USD 4,249
tax inclusive*
Corporate License
Unlimited Users
USD 5,999
USD 5,099
tax inclusive*
*Please note that the prices mentioned below are starting prices for each bundle type. Kindly contact our team for further details.*
Flash Bundle
Small Business Bundle
Growth Bundle
Enterprise Bundle
*Please note that the prices mentioned below are starting prices for each bundle type. Kindly contact our team for further details.*
Flash Bundle
Number of Reports: 3
20%
tax inclusive*
Small Business Bundle
Number of Reports: 5
25%
tax inclusive*
Growth Bundle
Number of Reports: 8
30%
tax inclusive*
Enterprise Bundle
Number of Reports: 10
35%
tax inclusive*
How To Order

Select License Type
Choose the right license for your needs and access rights.

Click on ‘Buy Now’
Add the report to your cart with one click and proceed to register.

Select Mode of Payment
Choose a payment option for a secure checkout. You will be redirected accordingly.
Strategic Solutions for Informed Decision-Making
Gain insights to stay ahead and seize opportunities.

Get insights & trends for a competitive edge.

Track prices with detailed trend reports.

Analyse trade data for supply chain insights.

Leverage cost reports for smart savings

Enhance supply chain with partnerships.

Connect For More Information
Our expert team of analysts will offer full support and resolve any queries regarding the report, before and after the purchase.
Our expert team of analysts will offer full support and resolve any queries regarding the report, before and after the purchase.
We employ meticulous research methods, blending advanced analytics and expert insights to deliver accurate, actionable industry intelligence, staying ahead of competitors.
Our skilled analysts offer unparalleled competitive advantage with detailed insights on current and emerging markets, ensuring your strategic edge.
We offer an in-depth yet simplified presentation of industry insights and analysis to meet your specific requirements effectively.


