Consumer Insights
Uncover trends and behaviors shaping consumer choices today
Procurement Insights
Optimize your sourcing strategy with key market data
Industry Stats
Stay ahead with the latest trends and market analysis.
The metabolomics-based diagnostics market was valued at USD 2.81 Billion in 2025 and is projected to reach USD 9.01 Billion by 2035, growing at a CAGR of 12.36%. Growth is supported by the rising burden of diabetes, cancer and cardiovascular disease, the spread of automated mass spectrometry into routine laboratories, regulatory acceptance of NMR and mass spectrometry assays, and the use of machine learning to interpret metabolite profiles.
Patent activity has expanded steadily since 2020, led by filings on targeted mass spectrometry assays, NMR lipoprotein and metabolite profiling, multi-metabolite biomarker panels and spectral data processing. Commercial validation includes the CE marking of Roche's cobas Mass Spec solution in December 2024 and regulatory clearances secured by NMR-based blood analysis providers in Singapore and the United Kingdom. Filing volume is concentrated in the United States, China and Europe.
This Metabolomics-Based Diagnostics Patent Landscape Analysis Report maps assignees, jurisdictions, technology clusters and innovation trends to support R&D, licensing and investment decisions.
The metabolomics-based diagnostics market is experiencing strong growth, driven by rising chronic disease burden, routine adoption of mass spectrometry in clinical laboratories, and demand for early detection biomarkers. Roche received CE marking in December 2024 for the cobas Mass Spec solution, with a planned menu of more than 60 analytes, which brings automated mass spectrometry into routine laboratory workflows.
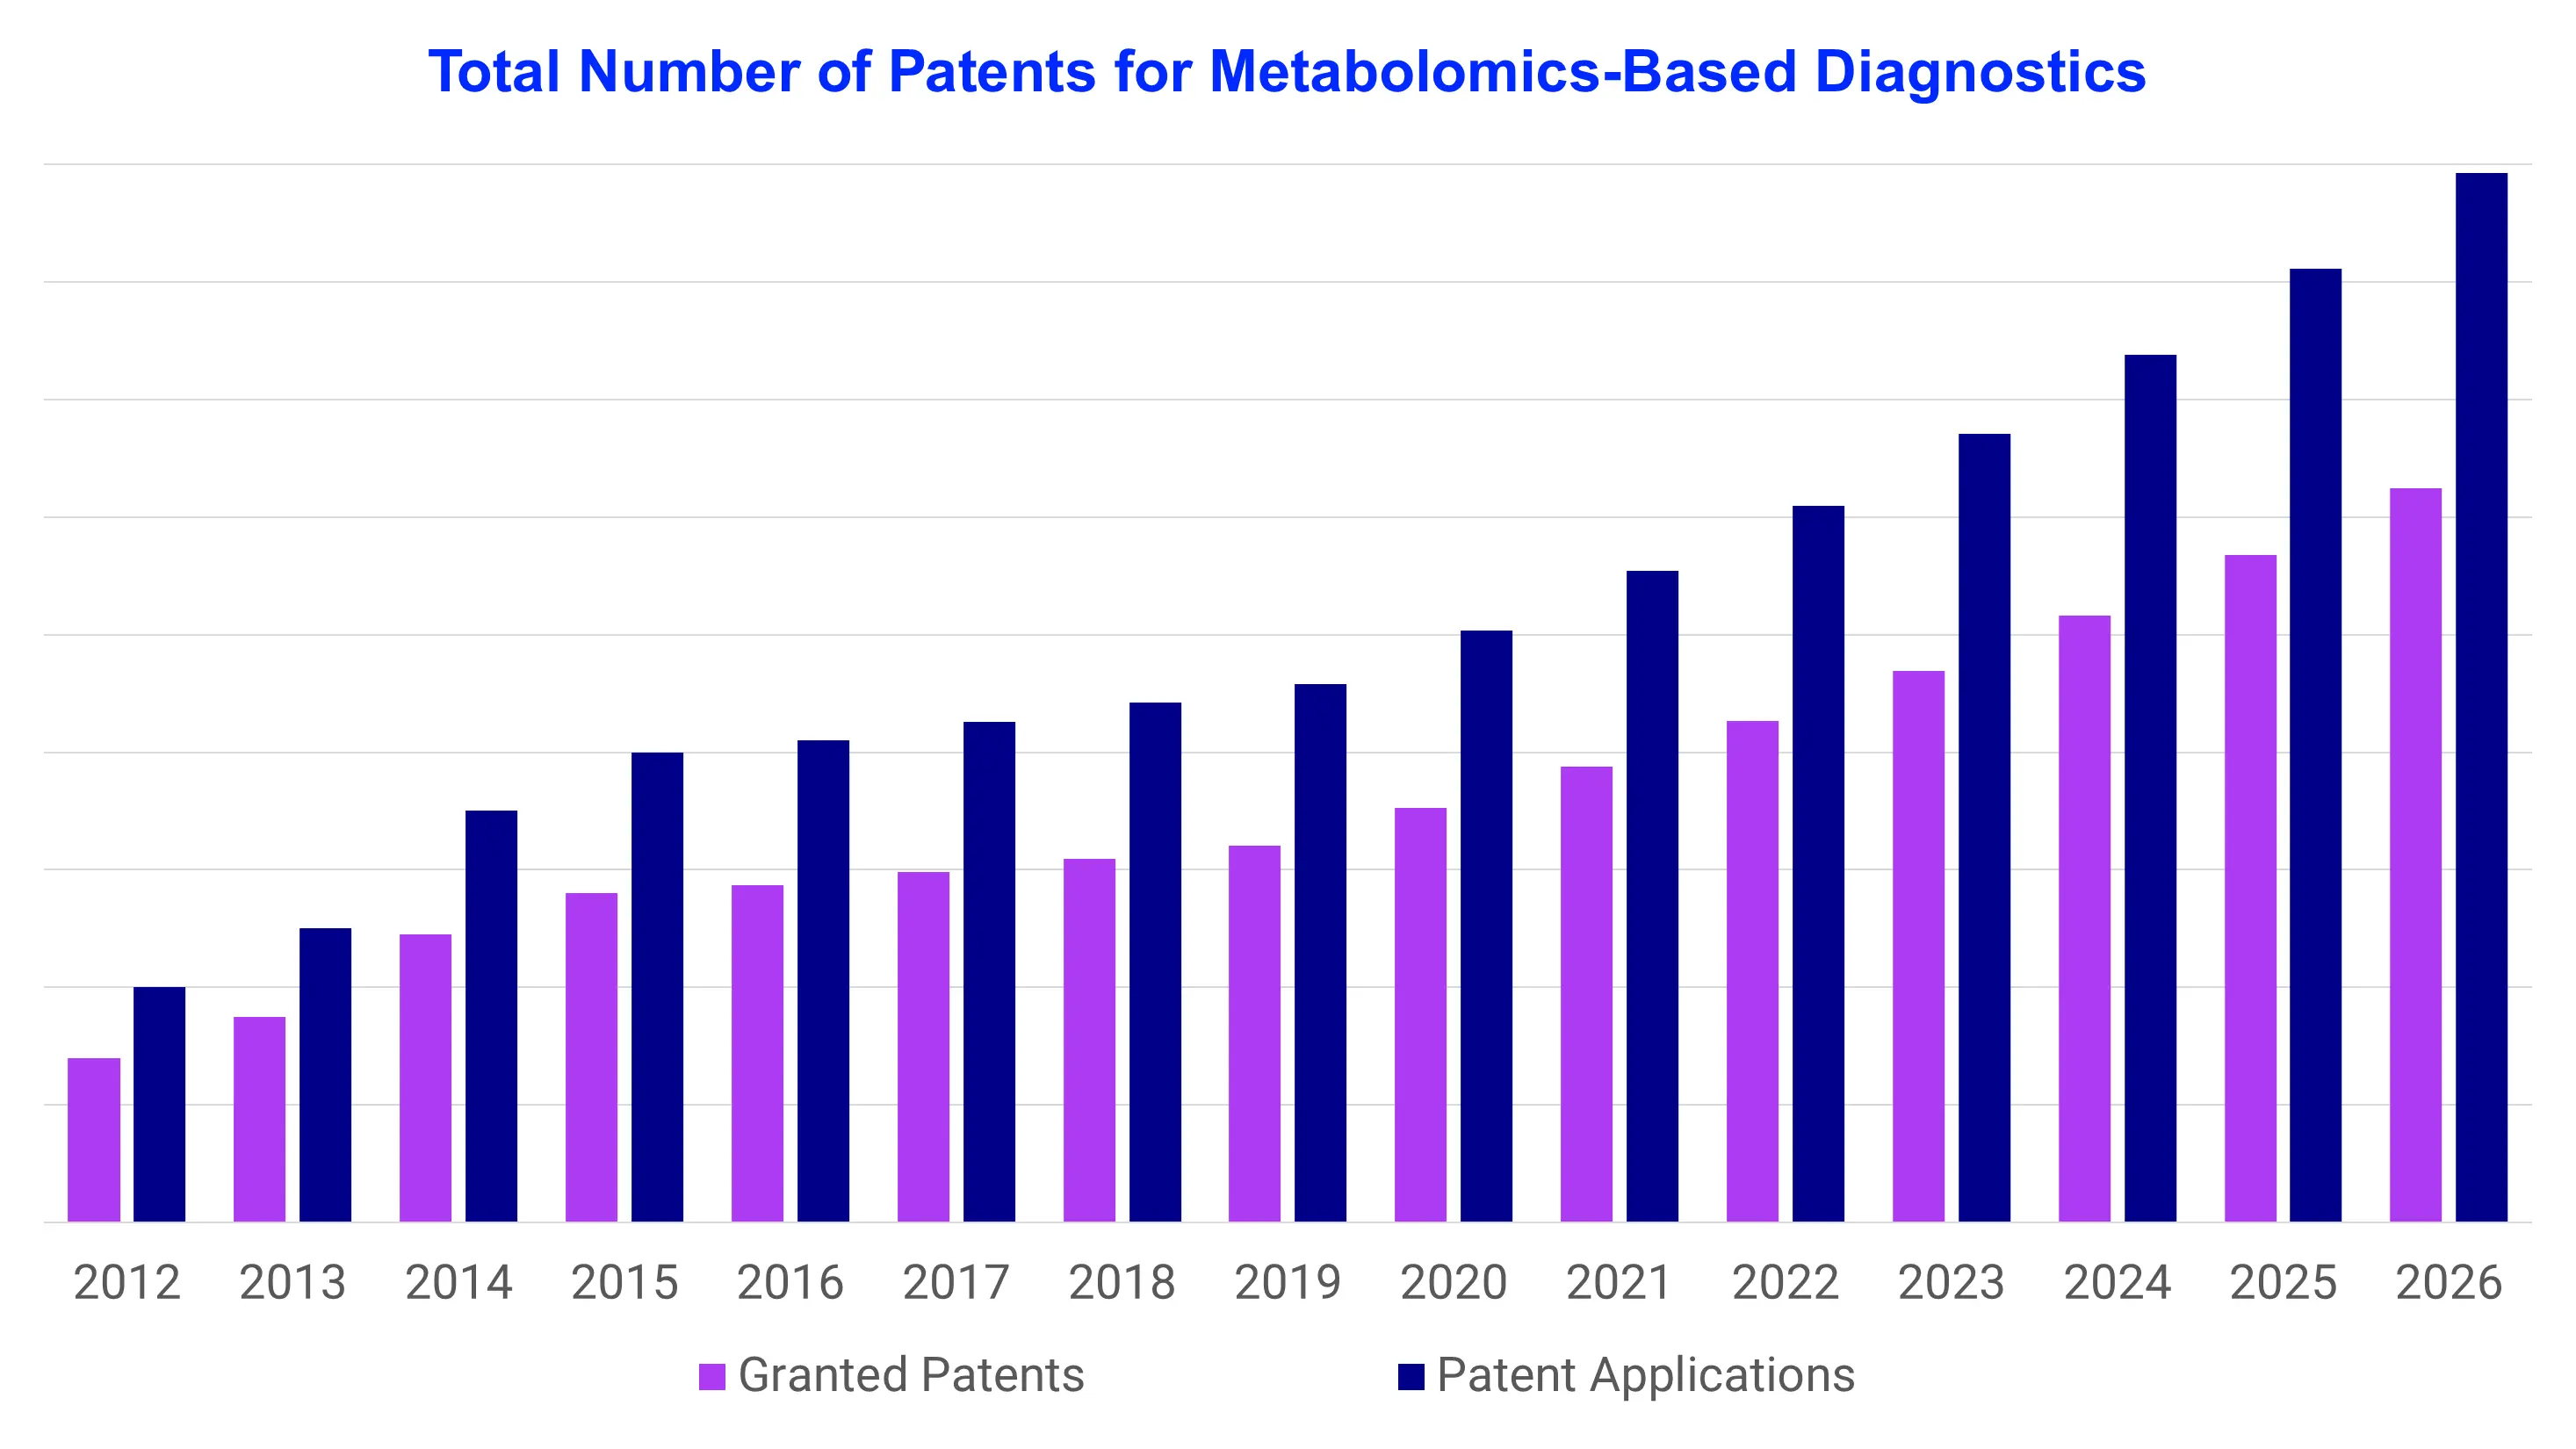
Patent activity is accelerating, with 980+ metabolomics-based diagnostics patents granted in 2025, reflecting strong innovation momentum in targeted mass spectrometry assays, NMR-based metabolite profiling, multi-metabolite biomarker panels, and machine learning for spectral data interpretation.
Top assignees in the metabolomics-based diagnostics patent landscape include Roche, Thermo Fisher Scientific, Bruker, Waters, and Metabolon, with the United States, China, and Europe as the dominant patent jurisdictions.
Metabolomics-based diagnostics measure small molecules in blood, urine and other samples to reveal the metabolic state of a patient. The approach complements genomics and proteomics because metabolite levels respond quickly to disease, diet and treatment. Clinical use is strongest in newborn screening, steroid and vitamin D testing, lipid profiling and cancer biomarker work, and laboratories are widening the test menu each year.
Market growth is driven by the spread of mass spectrometry into routine laboratories, which lets hospitals run metabolite panels on automated systems. About 589 million adults lived with diabetes in 2024 according to the International Diabetes Federation, and this population creates steady demand for lipid and metabolic risk profiling. Newborn screening programmes in the United States test more than 3.5 million infants a year, and tandem mass spectrometry remains the standard method for detecting inborn errors of metabolism.
North America holds the largest regional share, supported by dense clinical reference laboratory networks and by the March 2025 court decision that vacated the FDA rule on laboratory-developed tests, which keeps the route to market open for in-house metabolomic assays. In Europe, the extended IVDR transition periods, now running between 2027 and 2029, give manufacturers additional time to complete conformity assessment for new mass spectrometry and NMR assays. Roche's CE marking of the cobas Mass Spec solution in December 2024 shows that large diagnostic companies now commit capital to automated mass spectrometry, which in turn raises the pace of filings on reagents and sample preparation.
Read more about this report - REQUEST FREE SAMPLE COPY IN PDF
Cancer accounted for roughly 20 million new cases worldwide in 2022 according to GLOBOCAN, and this burden pushes research groups to file on metabolite signatures for early detection of lung, pancreatic and liver cancers. Diabetic and cardiometabolic populations drive filings on lipoprotein and amino acid panels that refine risk scores beyond standard cholesterol testing.
The portfolio spans about 4,000 patent families, with filing peaks between 2021 and 2024 as automated mass spectrometry and NMR assays reached laboratories. Chinese universities and hospitals contribute a growing share of biomarker panel filings, while corporate assignees concentrate on instruments, reagents and software.
Rising chronic disease prevalence and expanding laboratory adoption of mass spectrometry have translated directly into higher filing volume for assays, kits and analytical software.
The report covers patents on metabolite detection methods, quantitative assay kits, biomarker panels, sample preparation protocols and the software used to interpret metabolite profiles for disease diagnosis, risk assessment and treatment monitoring. Granted patents and pending applications published through 2025 are included.
Instruments are included where claims are directed to diagnostic use, such as clinical mass spectrometers, NMR analysers and their consumables. Pure research tools for non-clinical metabolomics fall outside the main analysis and appear only where claims extend to diagnostic indications.
Entities covered include corporate assignees, universities, hospitals and research institutes that hold patents on metabolite detection methods, biomarker panels, assay kits and analytical instruments.
The report will cover the following sections in detail:
Analysis by Technology
Analysis by Application
Analysis by Sample Type
Metabolomics-Based Diagnostics Patent Filing Trend Analysis
Patent filings grew at an estimated 9% per year between 2020 and 2024, with 2025 grants of about 980 patents. Growth was driven by the commercialisation of automated clinical mass spectrometry and by large population cohorts that validated NMR-derived metabolite markers, including UK Biobank profiling of several hundred thousand participants.
Applications on machine learning for spectral interpretation and multi-metabolite risk scores grew faster than the overall average, as laboratories seek automated reporting. Filings on sample preparation, including dried blood spot extraction and microsampling, also gained share as decentralised collection became more common.
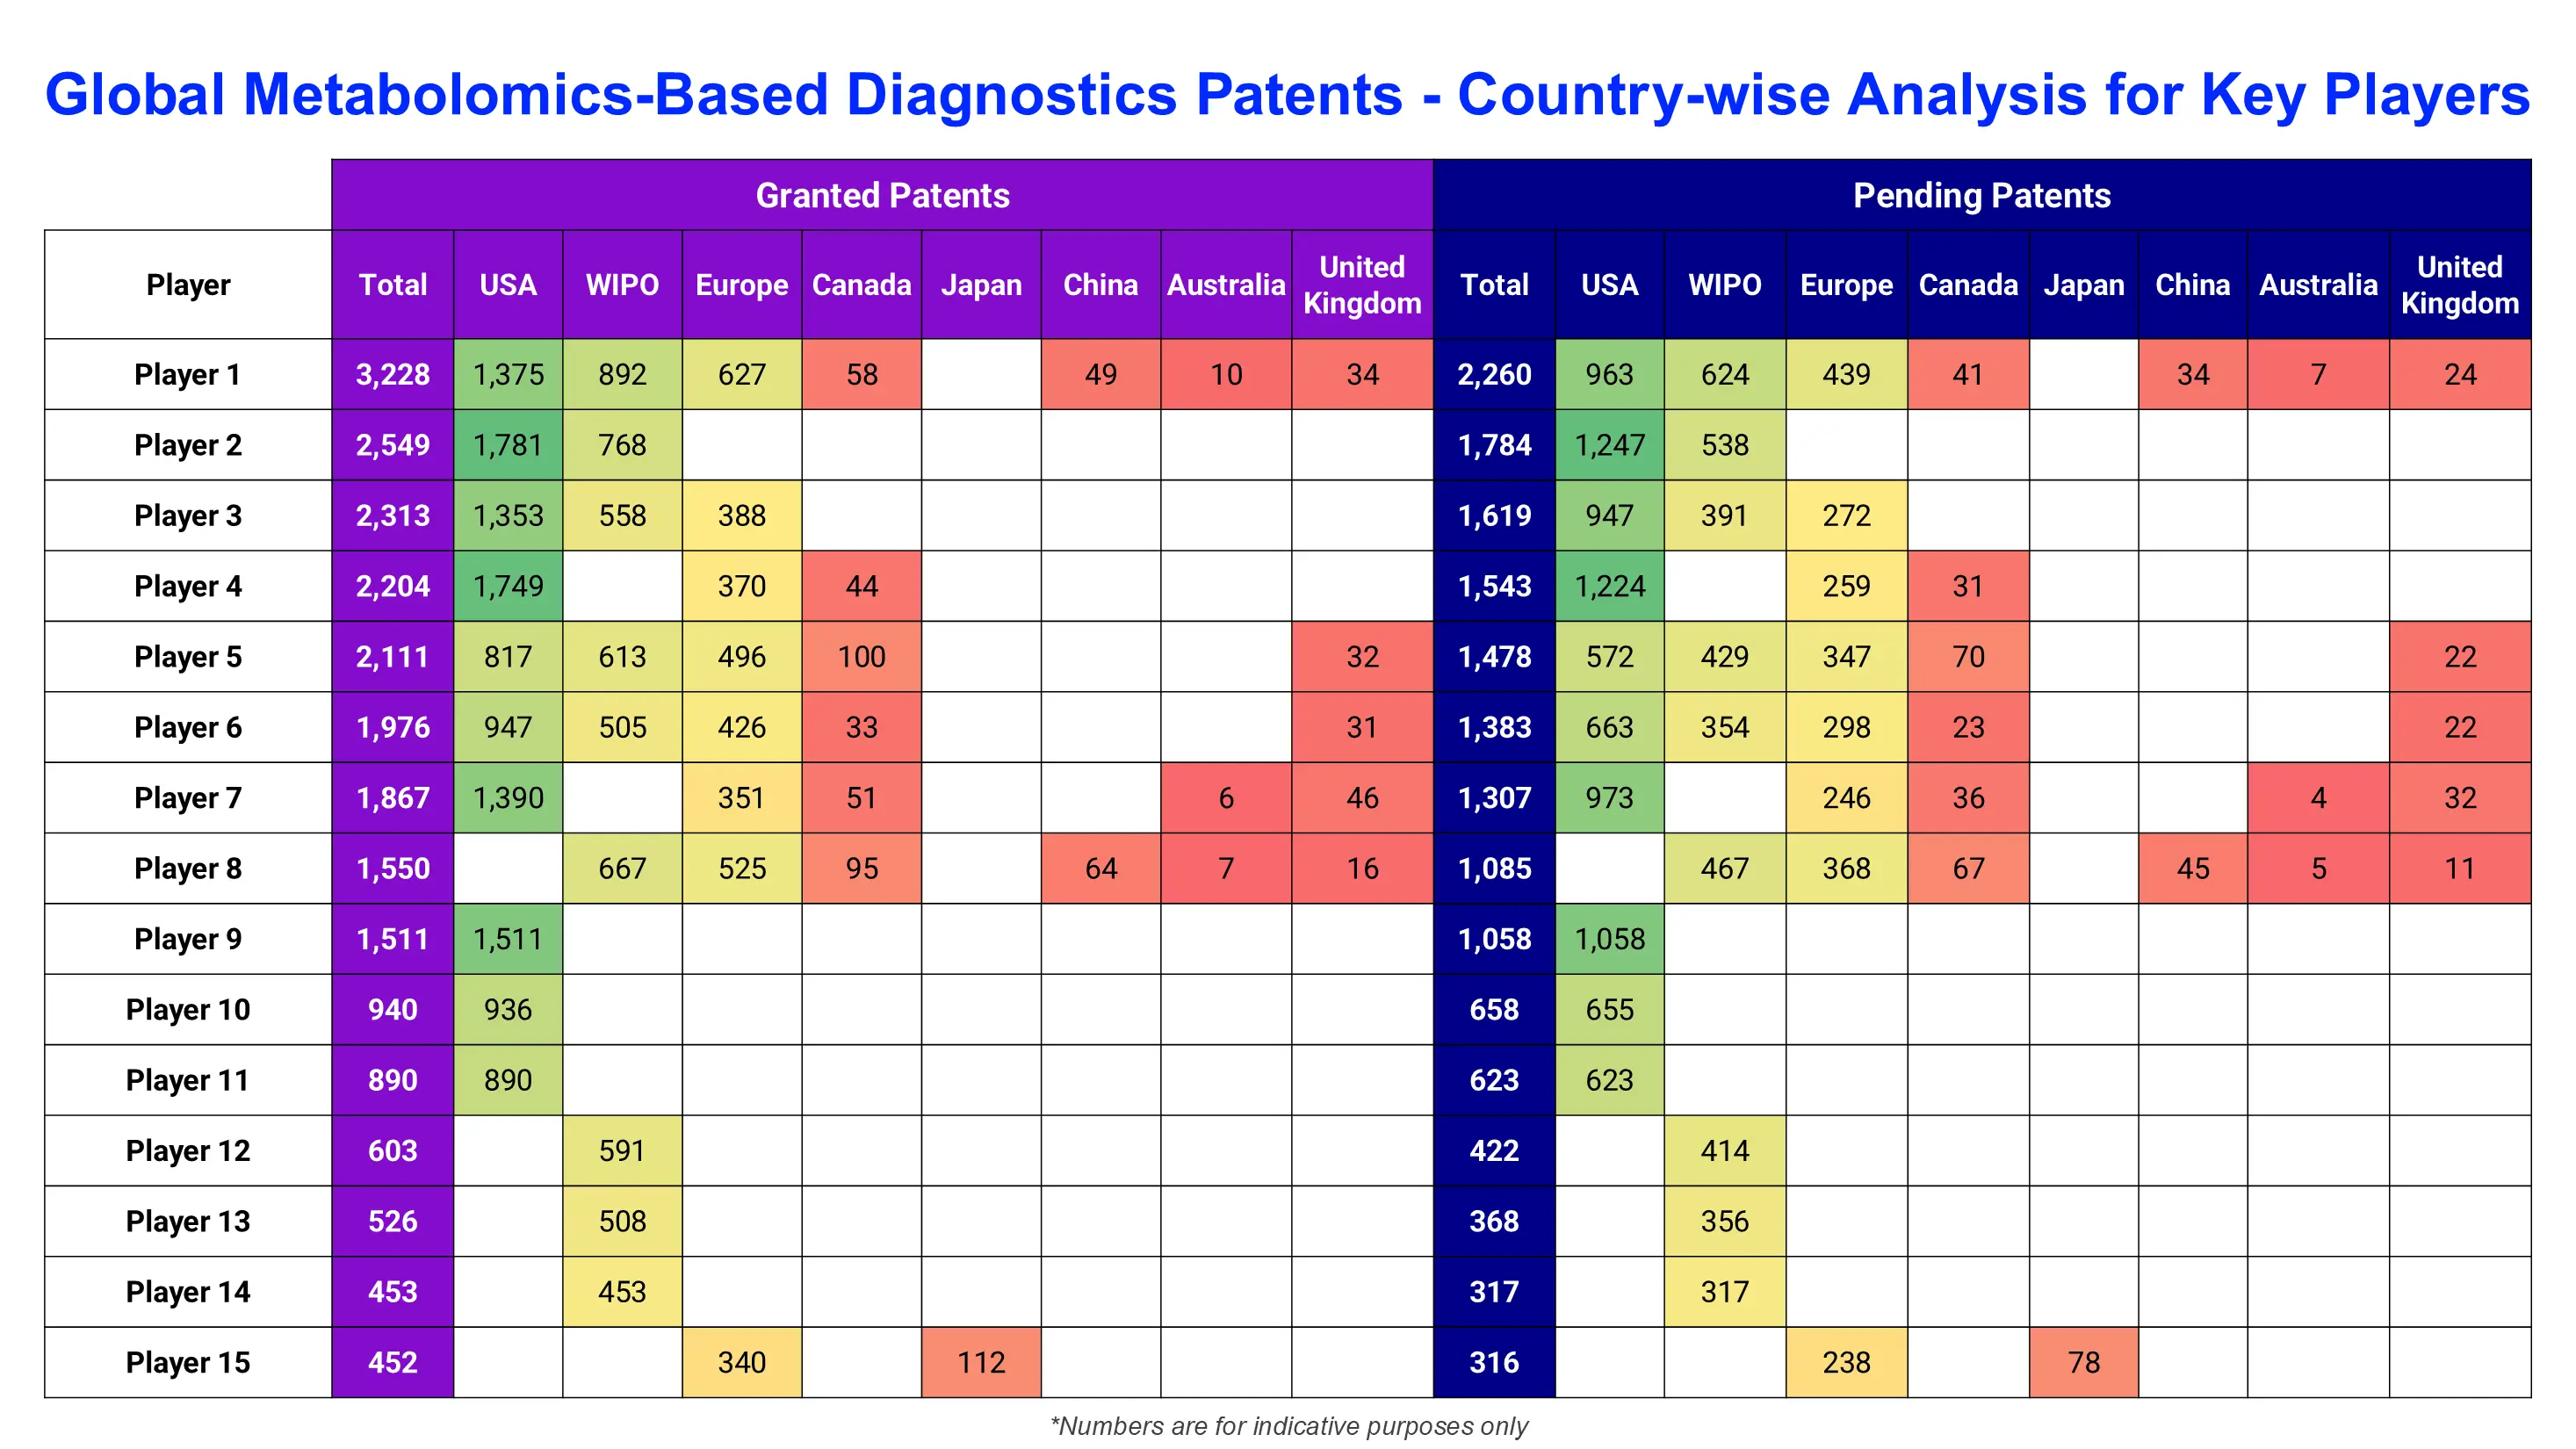
Among the players with metabolomics-based diagnostics patent families, new entrants have been identified, which can be either established companies or startups developing novel technology in the field. Some of the major companies mentioned in this report (a non-exhaustive list) are as follows:
Roche holds one of the largest portfolios in metabolomics-based diagnostics, covering metabolite biomarker panels, sample preparation chemistry and automated mass spectrometry workflows. Its cobas Mass Spec solution, built around the cobas i 601 analyser and Ionify reagent packs, received CE marking in December 2024 under the IVDR, with a first pack of four steroid hormone assays. The company has indicated a menu of more than 60 analytes spanning steroid hormones, vitamin D metabolites, immunosuppressants, therapeutic drug monitoring and drugs of abuse testing. Its IP strategy protects reagent chemistry, integrated sample handling and instrument automation, which together support the move of mass spectrometry from specialist to routine laboratories. Roche positions the platform as an extension of its cobas pro clinical chemistry and immunochemistry installed base.
Thermo Fisher Scientific files extensively on high-resolution and triple quadrupole mass spectrometry, liquid chromatography interfaces and spectral processing software used in metabolite detection. Its Orbitrap and TSQ instruments, Vanquish liquid chromatography systems and Compound Discoverer and TraceFinder software form the analytical base for many untargeted and targeted metabolomics workflows. The Cascadion clinical analyzer extends the portfolio into clinical mass spectrometry with ready-to-use assay reagents. Patent strategy centres on ion optics, sensitivity gains, automation of sample preparation and data pipelines that connect instruments to laboratory information systems. The company sells mainly to clinical reference laboratories, hospital research groups and pharmaceutical customers.
Other companies include Bruker, Waters, and Metabolon.
The top five assignees hold an estimated 12 to 15% of all families, which indicates a fragmented field with a long tail of universities and hospitals. Instrument makers dominate hardware claims, while biomarker panel claims are spread across academic institutions and specialised laboratories.
*Please note that this is only a partial list; the complete list of key players is available in the full report. Additionally, the list of key players can be customized to better suit your needs.*
The report assesses patent activity across major jurisdictions, including:
The United States, China and Europe account for the largest filing volumes. The United States leads on assay kits and instrument claims, China shows the fastest growth in biomarker panel applications from universities and hospitals, and Europe combines strong NMR and mass spectrometry instrument filings with IVDR-driven assay development.
Read more about this report - REQUEST FREE SAMPLE COPY IN PDF
The report categorises patents by the following technology segments:
Among these, mass spectrometry assay platforms hold the largest share of patent activity, supported by clinical adoption of liquid chromatography-mass spectrometry for steroid, vitamin and drug monitoring assays.
Competition combines diagnostic majors, mass spectrometry instrument makers and specialised metabolomics providers. Roche and Thermo Fisher Scientific lead on automated platforms, Bruker is a key assignee in NMR-based clinical analysis, and Waters and Metabolon add depth in clinical mass spectrometry and biomarker discovery respectively.
Companies are focusing on:
Emerging innovation themes include ion mobility separation for isomer resolution, breath and saliva metabolite sensing, targeted kits such as the AbsoluteIDQ and MxP Quant 500 formats from Biocrates, and combined metabolomic and polygenic risk scoring. Microsampling devices that allow patients to collect capillary blood at home are also attracting new applications.
Patent ownership in metabolomics-based diagnostics is shared between instrument manufacturers, diagnostic majors and academic centres. Companies with claims on reagent chemistry and automation hold the strongest commercial position, while biomarker panel patents are often licensed from universities and hospitals.
Technology segments, application areas and sample types show where freedom to operate is limited and where white space remains. The report provides actionable intelligence supporting:
The study searched patent databases including the USPTO, EPO Espacenet, WIPO PATENTSCOPE, CNIPA, JPO and KIPO. Queries combined keywords on metabolites, metabolomic profiling and biomarker panels with CPC classes G01N 30/72, G01N 24/08, G01N 33/50, G01N 33/92, H01J 49/00, G16B 40/00 and G16H 50/20.
Records were screened for diagnostic relevance and consolidated into patent families. Assignee names were harmonised across subsidiaries and legal-entity variants before counts, legal status and jurisdiction shares were calculated.
The market side draws on regulatory filings from the FDA and notified bodies under the EU IVDR, company annual reports and investor disclosures, clinical trial registries such as ClinicalTrials.gov and peer-reviewed literature indexed in PubMed.


Upto 15% Off
USD
$2699 $2429
$4299 $3869
$5799 $4949
$6999 $5949


*While we strive to always give you current and accurate information, the numbers depicted on the website are indicative and may differ from the actual numbers in the main report. At Expert Market Research, we aim to bring you the latest insights and trends in the market. Using our analyses and forecasts, stakeholders can understand the market dynamics, navigate challenges, and capitalize on opportunities to make data-driven strategic decisions.*
EMR’s Metabolomics-Based Diagnostics Patent Landscape Analysis provides a comprehensive assessment of patent filings, innovation clusters, assignee portfolios, and geographic filing patterns across the metabolomics-based diagnostics landscape. The report identifies 4,000+ patent families, evaluates leading jurisdictions including the United States, China, and Europe, and profiles the top assignees by portfolio size.
The global metabolomics-based diagnostics market was valued at USD 2.81 Billion in 2025. The market is projected to reach USD 9.01 Billion by 2035, expanding at a CAGR of 12.36% during 2026 - 2035.
The report analyses approximately 4,000+ patent families related to metabolomics-based diagnostics. These include filings from the United States, China, Europe, and international WIPO filings.
Key companies operating within the landscape include Roche, Thermo Fisher Scientific, Bruker, Waters, and Metabolon, among others. These organisations collectively account for a significant portion of patent activity analysed in this report.
The report evaluates patent activity across the United States, Europe, China, Japan, South Korea, India, and international WIPO filings. The United States leads with an estimated 35 to 40% of patent filings, followed by China and Europe.
Yes. The report scope can be customised based on geography, technology segment, assignee selection, time period, or specific innovation cluster focus. Please connect with the EMR team to define the customisation scope.
Patent landscape analysis helps organisations understand innovation trends, competitive activity, technology whitespace, and IP risk across a defined domain. For metabolomics-based diagnostics, this report supports strategic decisions in R&D prioritisation, licensing evaluation, competitive benchmarking, and market entry planning.
Explore our key highlights of the report and gain a concise overview of key findings, trends, and actionable insights that will empower your strategic decisions.
|
Scope of the Report |
Details |
|
Analysis by Technology |
|
|
Analysis by Application |
|
|
Analysis by Sample Type |
|
|
Analysis by End User |
|
|
Key Players Mentioned |
|
|
Geographies Covered |
|
Mini Report
One User
USD 2,699
USD 2,429
tax inclusive*
Single User License
One User
USD 4,299
USD 3,869
tax inclusive*
Five User License
Five User
USD 5,799
USD 4,949
tax inclusive*
Corporate License
Unlimited Users
USD 6,999
USD 5,949
tax inclusive*
*Please note that the prices mentioned below are starting prices for each bundle type. Kindly contact our team for further details.*
Flash Bundle
Small Business Bundle
Growth Bundle
Enterprise Bundle
*Please note that the prices mentioned below are starting prices for each bundle type. Kindly contact our team for further details.*
Flash Bundle
Number of Reports: 3
20%
tax inclusive*
Small Business Bundle
Number of Reports: 5
25%
tax inclusive*
Growth Bundle
Number of Reports: 8
30%
tax inclusive*
Enterprise Bundle
Number of Reports: 10
35%
tax inclusive*
How To Order

Select License Type
Choose the right license for your needs and access rights.

Click on ‘Buy Now’
Add the report to your cart with one click and proceed to register.

Select Mode of Payment
Choose a payment option for a secure checkout. You will be redirected accordingly.
Strategic Solutions for Informed Decision-Making
Gain insights to stay ahead and seize opportunities.
Get insights & trends for a competitive edge.
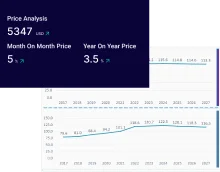
Track prices with detailed trend reports.
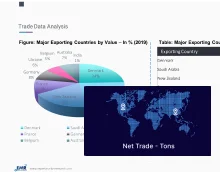
Analyse trade data for supply chain insights.
Leverage cost reports for smart savings
Enhance supply chain with partnerships.
Connect For More Information
Our expert team of analysts will offer full support and resolve any queries regarding the report, before and after the purchase.
Our expert team of analysts will offer full support and resolve any queries regarding the report, before and after the purchase.
We employ meticulous research methods, blending advanced analytics and expert insights to deliver accurate, actionable industry intelligence, staying ahead of competitors.
Our skilled analysts offer unparalleled competitive advantage with detailed insights on current and emerging markets, ensuring your strategic edge.
We offer an in-depth yet simplified presentation of industry insights and analysis to meet your specific requirements effectively.