

Consumer Insights
Uncover trends and behaviors shaping consumer choices today
Procurement Insights
Optimize your sourcing strategy with key market data
Industry Stats
Stay ahead with the latest trends and market analysis.
The global aprotic solvents market is expected to grow at a CAGR of 2.80% in the forecast period of 2026-2035 to reach a value of USD 28.56 Billion by 2035.
Compound Annual Growth Rate
2.8%
2026-2035
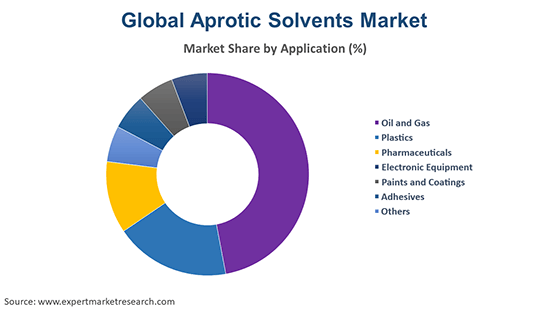
Based on application, the oil and gas industry accounted for a significant share in the market in 2021. The rising demand for energy and petrochemicals has driven the growth of the segment. Further, the product is witnessing an increased demand from various application sectors like electronics and paints and coatings, among others. Over the forecast period, the thriving pharmaceutical industry is expected to further aid the market growth.
Based on solvent type, toluene is one of the leading aprotic solvents in the industry. The growth can be attributed to the rising demand for toluene in applications like paints and coatings and construction. Toluene is also used to produce benzene, xylene, and trinitrotoluene, which are further utilised in various industries, which, in turn, is anticipated to propel the growth of the toluene industry. Meanwhile, N-Methyl-2-pyrrolidone (NMP) is also witnessing an enhanced demand from the oil and gas industry owing to its properties, which will further boost the industry growth.
Region-wise, the Asia Pacific is one of the significant markets for the product owing to the expanding paints and coatings and pharmaceutical industries in the region. This is supported by the growing industrialisation and rapid development across emerging economies within the region.
Read more about this report - REQUEST FREE SAMPLE COPY IN PDF
Aprotic solvents refer to the solvents that lack the ability to donate hydrogen atom and do not possess acidic or basic groups. Aprotic solvents are known for their high dipole moment and polarity and the ability to stabilise ions. These solvents can be used with strong acids and reagents at high temperatures. Further, the high polarity of these solvents allows them to dissolve charged species, making them more reactive and useful.
Based on source, the market is bifurcated into:
Based on solvent type, the industry can be segmented into:
The various applications of aprotic solvents are:
The regional markets for the product include:


The growth of the major end use sectors of aprotic solvents is driving the growth of the industry. This is further supported by the rising product demand in emerging nations. Aprotic solvents are less reactive and possess high relative permittivity and thermal stability, and, thus, they are widely utilised in gas production and oil refining. The expanding applications of the product in pharmaceuticals, oil and gas, paints and coatings, and electronic sectors, among others, are driving the industry growth. Over the forecast period, the growing demand for green solvents and the growing R&D activities are expected to aid the industry growth. However, fluctuations in the cost of raw materials may restrain the growth of the industry in the coming years.
The report gives a detailed analysis of the following key players in the global aprotic solvents market, covering their competitive landscape, capacity, and latest developments like mergers, acquisitions, and investments, expansions of capacity, and plant turnarounds:
The comprehensive EMR report provides an in-depth assessment of the market based on the Porter's five forces model along with giving a SWOT analysis.
Upto 15% Off
USD
$2499 $2249
$3999 $3599
$4999 $4249
$5999 $5099


*While we strive to always give you current and accurate information, the numbers depicted on the website are indicative and may differ from the actual numbers in the main report. At Expert Market Research, we aim to bring you the latest insights and trends in the market. Using our analyses and forecasts, stakeholders can understand the market dynamics, navigate challenges, and capitalize on opportunities to make data-driven strategic decisions.*
The market is projected to grow at a CAGR of 2.80% between 2026 and 2035.
The market is estimated to witness a healthy growth in the forecast period of 2026-2035 to reach about USD 28.56 Billion by 2035.
The major drivers of the market are the increasing applications in various industries, rapid urbanisation and industrialisation, growth of the end use markets, rising demand for petrochemicals, thriving pharma sector, growing technological advancements, and rising demand from the developing regions.
The key market trends guiding the growth of the market include the growing research and development activities by the manufacturers and the increasing demand for green solvents.
The major regions in the market are North America, Latin America, the Middle East and Africa, Europe, and the Asia Pacific.
The leading sources of aprotic solvents in the market are bio and green and conventional.
The significant solvent types in the market are N-methyl-2-pyrrolidone, benzene, toluene, acetone, and chloroform, among others.
The major applications in the market are oil and gas, plastics, pharmaceuticals, electronic equipment, paints and coatings, and adhesives, among others.
The major players in the global aprotic solvents market are BASF SE, Eastman Chemical Company, Dow Chemical Company, Ashland Global Holdings Inc., Mitsubishi Chemicals Corporation, and AlzChem Group AG, among others.
Explore our key highlights of the report and gain a concise overview of key findings, trends, and actionable insights that will empower your strategic decisions.
| REPORT FEATURES | DETAILS |
| Base Year | 2025 |
| Historical Period | 2019-2025 |
| Forecast Period | 2026-2035 |
| Scope of the Report |
Historical and Forecast Trends, Industry Drivers and Constraints, Historical and Forecast Market Analysis by Segment:
|
| Breakup by Source |
|
| Breakup by Solvent Type |
|
| Breakup by Application |
|
| Breakup by Region |
|
| Market Dynamics |
|
| Competitive Landscape |
|
| Companies Covered |
|
| Report Price and Purchase Option | Explore our purchase options that are best suited to your resources and industry needs. |
| Delivery Format | Delivered as an attached PDF and Excel through email, with an option of receiving an editable PPT, according to the purchase option. |
Datasheet
One User
USD 2,499
USD 2,249
tax inclusive*
Single User License
One User
USD 3,999
USD 3,599
tax inclusive*
Five User License
Five User
USD 4,999
USD 4,249
tax inclusive*
Corporate License
Unlimited Users
USD 5,999
USD 5,099
tax inclusive*
*Please note that the prices mentioned below are starting prices for each bundle type. Kindly contact our team for further details.*
Flash Bundle
Small Business Bundle
Growth Bundle
Enterprise Bundle
*Please note that the prices mentioned below are starting prices for each bundle type. Kindly contact our team for further details.*
Flash Bundle
Number of Reports: 3
20%
tax inclusive*
Small Business Bundle
Number of Reports: 5
25%
tax inclusive*
Growth Bundle
Number of Reports: 8
30%
tax inclusive*
Enterprise Bundle
Number of Reports: 10
35%
tax inclusive*
How To Order

Select License Type
Choose the right license for your needs and access rights.

Click on ‘Buy Now’
Add the report to your cart with one click and proceed to register.

Select Mode of Payment
Choose a payment option for a secure checkout. You will be redirected accordingly.
Strategic Solutions for Informed Decision-Making
Gain insights to stay ahead and seize opportunities.

Get insights & trends for a competitive edge.

Track prices with detailed trend reports.

Analyse trade data for supply chain insights.

Leverage cost reports for smart savings

Enhance supply chain with partnerships.

Connect For More Information
Our expert team of analysts will offer full support and resolve any queries regarding the report, before and after the purchase.
Our expert team of analysts will offer full support and resolve any queries regarding the report, before and after the purchase.
We employ meticulous research methods, blending advanced analytics and expert insights to deliver accurate, actionable industry intelligence, staying ahead of competitors.
Our skilled analysts offer unparalleled competitive advantage with detailed insights on current and emerging markets, ensuring your strategic edge.
We offer an in-depth yet simplified presentation of industry insights and analysis to meet your specific requirements effectively.


