

Consumer Insights
Uncover trends and behaviors shaping consumer choices today
Procurement Insights
Optimize your sourcing strategy with key market data
Industry Stats
Stay ahead with the latest trends and market analysis.
The global caustic soda market stood at a volume of around 85.92 MMT in the year 2025. The market is projected to grow at a CAGR of 2.30% between 2026 and 2035 to reach a volume of about 107.86 MMT by 2035. The market for caustic soda is expanding significantly because of the growing demand from the aerospace, automotive, and aluminum manufacturing sectors. The manufacturing of aluminum requires caustic soda, a crucial component in the process of refining alumina from bauxite. Such demand will be further driven by the growing demand from automobile and aerospace industries, indicating a robust market outlook as a consequence of industrial growth and innovation in these sectors.
According to the Australian Fashion Council report, the Australian fashion and textile industry is expected to grow to USD 38 billion by 2032, generating an additional USD 10.8 billion in economic benefit. This growth offers significant potential for the global caustic soda market, particularly as textile production increases and demands more caustic soda for fibre and dye manufacturing.
Eurostat reports that the EU’s agricultural sector reached USD 581.4 billion in 2023, with crops accounting for 51.3% of this value. This growing agricultural output heightens the need for caustic soda in processing, as it plays a crucial role in the production of fertilizers, driving demand in the global caustic soda market.
According to industry reports, India's Personal Care and Hygiene market was valued at USD 15.057 billion in 2022. This market expansion is increasing the demand for chemicals, such as caustic soda, used in soap and cosmetic production, thus contributing to the growth of the caustic soda industry to meet rising consumer needs.
Compound Annual Growth Rate
2.3%
Value in MMT
2026-2035
| Global Caustic Soda Market Report Summary | Description | Value |
| Base Year | MMT | 2025 |
| Historical Period | MMT | 2019-2025 |
| Forecast Period | MMT | 2026-2035 |
| Market Size 2025 | MMT | 85.92 |
| Market Size 2035 | MMT | 107.86 |
| CAGR 2019-2025 | Percentage | XX% |
| CAGR 2026-2035 | Percentage | 2.30% |
| CAGR 2026-2035 - Market by Region | Asia Pacific | 2.6% |
| CAGR 2026-2035 - Market by Country | India | 2.6% |
| CAGR 2026-2035 - Market by Country | China | 2.5% |
| CAGR 2026-2035 - Market by Production Process | Membrane Cell | 2.6% |
| CAGR 2026-2035 - Market by Application | Pulp & Paper | 2.6% |
| Market Share by Country 2025 | Japan | 4.2% |
The increasing use of caustic soda in the pulp and paper industry, particularly in the pulping process, has been a major driver of the caustic soda market. As wood chips are broken down into pulp and then used to make paper products and packaging materials, caustic soda plays a significant role in the recycling process to produce high-quality recycled paper. Additionally, the growing emphasis on sustainable practices in a variety of industries, including personal care products, has contributed to the demand for caustic soda through eco-friendly manufacturing.
The market for caustic soda is growing at a rapid pace. This is due to its growing use in water treatment applications. In both industrial and municipal water treatment facilities, the usage of caustic soda has become essential for balancing pH levels, neutralizing acidic fluids, and removing contaminants. Plus, there has been a significant increase in demand for caustic soda which has resulted from the increased focus on water purification and wastewater management on a global scale. The contributions that caustic soda makes to water treatment continue to be crucial for maintaining safe and clean drinking supplies as businesses and governmental organizations invest resources to improve water quality and safeguard sustainability.
Caustic soda plays a vital role in many chemical manufacturing industries. It is widely used in the manufacturing of synthetic detergents, textiles, and soaps, and is essential to the consumer products sector. Moreover, the importance of caustic soda keeps growing significantly due to the growing demand for cleaning supplies, personal care products, and textiles. This surge is further supported by its requirement in processes that mandate alkaline environments which bolster continuous demand across the chemical industry.
Additionally, the significant use of caustic soda in the textile industry, particularly in relation to dyeing and cleaning processes, is a key factor propelling the market's expansion. Caustic soda is necessary for the preparation of fibers. It helps remove impurities during the production stages. It also plays a major role in maintaining the sanitation and operating effectiveness of textile machinery. Given that demand surges due to trends in fashion as well as home goods coupled with industrial needs, the necessity of caustic soda for dyeing and cleaning will likely boost further market growth.
Read more about this report - REQUEST FREE SAMPLE COPY IN PDF
The caustic soda market is expanding due to rising demand from various industries, a focus on sustainable and eco-friendly production, technological advancements in manufacturing, and the growth of the chemical and petrochemical sectors.
Chemours and PCC Group announced a new chlor-alkali facility at Chemours' TiO₂ plant in DeLisle, Mississippi, set to operate by 2028. The facility will produce 340,000 metric tons annually, creating 1,200 construction jobs and providing cost savings. The partnership aims to enhance supply reliability, reduce manufacturing costs, and strengthen community ties.
Nuberg EPC launched India’s largest Chlor-Alkali project for Mundra Petrochemical Ltd. (Adani Group) in Gujarat. The 2200 TPD project will produce key chemicals like caustic soda and hydrochloric acid. With a 15-month delivery commitment, Nuberg EPC aims to contribute to India’s industrial growth and MPL’s Green PVC Project.
Dow launched Caustic DEC and TRACELIGHT™ DEC, part of its Decarbia™ reduced-carbon portfolio. These products, powered by renewable energy, offer up to 90% lower carbon emissions and support sustainability goals. Certified by ISCC PLUS, they maintain high product quality for industrial and food applications while reducing Scope 3 emissions.
Vynova launched the world’s first ISCC PLUS-certified renewable caustic soda, produced using renewable energy sources. Manufactured at their Tessenderlo plant, the product has a lower carbon footprint than traditional caustic soda, helping industries achieve sustainability goals. Vynova’s renewable caustic soda maintains the same quality and specifications as their conventional product.
The global demand for caustic soda is increasing, driven by industries like textiles, automotive, agriculture, and personal care. It is widely used in soap making, water treatment, and cleaning agent production. With sectors such as food processing expanding, the caustic soda market is expected to see continued growth. In May 2024, DCM Shriram expanded its caustic soda capacity in Bharuch, Gujarat, to 2,225 TPD, positioning it as India’s largest plant, with an annual capacity of 1 million TPA, supporting India’s “Atmanirbhar Bharat” initiative and fostering long-term growth.
Sustainability is increasingly influencing the caustic soda market, with manufacturers prioritising eco-friendly production methods. This includes adopting energy-efficient technologies and recycling by-products to reduce environmental impact. The shift towards greener production processes aligns with global sustainability goals and consumer preferences for environmentally conscious products. In 2021, Vinnolit launched its "GreenVin" caustic soda, which reduced CO2 emissions by over 30%. This renewable energy-powered product aids customers in reducing their carbon footprint, demonstrating Vinnolit’s commitment to sustainability and contributing to the low-carbon economy.
Technological advancements, particularly in membrane cell technology, are enhancing the efficiency of caustic soda production. These innovations help reduce energy consumption, lower production costs, and improve product quality, making it easier to meet regulatory standards. As technology evolves, the caustic soda market is poised to benefit from cost savings and improved operational efficiency. In February 2024, INEOS Inovyn launched its Ultra Low Carbon (ULC) range of Chlor-Alkali products, aimed at reducing the carbon footprint of the manufacturing process, reinforcing the company's commitment to decarbonisation and supporting sustainable solutions for industries.
The chemical and petrochemical industries, major consumers of caustic soda, are expanding rapidly, particularly in emerging markets. Caustic soda is essential in various chemical processes, such as the production of chlorine, plastics, and detergents. As industrialisation continues in regions like Asia Pacific, demand for caustic soda is expected to rise. In February 2023, Covestro inaugurated a chlor-alkali plant in Spain to enhance its MDI production network. This expansion supports the growth of the chemicals sector in Europe and strengthens Covestro's position in the global market, ensuring a steady demand for caustic soda.
Caustic soda and chlorine are produced using a chlor-alkali process that is increasingly becoming more efficient in terms of energy use and operating expenses. Manufacturers concentrating on production efficiency are using innovative technologies to meet the growing demand for caustic soda globally. This invention guarantees the manufacture of caustic soda at a competitive price while also being environmentally friendly. Furthermore, many producers are concentrating on enhancing their manufacturing methods in order to meet the rising demand from industrial sectors.
Another considerable trend for production noticed in the caustic soda market is sustainable manufacturing. Manufacturers, in increasing numbers, have realized the high risks of environmental consequences. They are investing in diverse technologies that minimize wasted production volumes and lower the carbon footprints in their methods of production. There is an increased focus on recycling and plant-based feedstock production. In order to meet the global sustainability norms and ensure that the production methods meet both industrial demand and environmental expectations, manufacturers are increasingly looking into alternative raw materials.
Read more about this report - REQUEST FREE SAMPLE COPY IN PDF
The textile sector, which uses sodium hydroxide extensively for a number of processes, is one of the primary industries driving demand in the caustic soda market. When scouring textiles to get them ready for dyeing, caustic soda is crucial because it eliminates contaminants and natural oils. Caustic soda increases the fabric's resistance to tension and dyeing, which its bleaching properties. Caustic soda also plays an important role in bleaching, giving textiles a cleaner and brighter look. New eco-friendly practices have led to new demand for classically produced caustic soda to be used within the framework of sustainable practices of responsible and efficient use of caustic soda within the textile production process that is both innovative and environmentally responsible.
Soap is one of the most important contributors to the caustic soda market growth with the highest CAGR. In the saponification process, caustic soda reacts with fats and oils to create soaps. Additionally, it is often utilized in the manufacturing of detergents, enhancing them for use in both domestic and commercial cleaning applications. Given the rising need for cleaning supplies like soaps and detergents, caustic soda is predicted to remain a key component in the manufacturing of high-quality cleaning solutions for a variety of industries.


North America and Europe being one of the major consumers of caustic soda from the automotive and aerospace industries. The production of aluminum and alumina is fueled by Asia-Pacific countries, including China and India, where caustic soda is used fundamentally in the refining of bauxite. Furthermore, demand in the paper and pulp industry in countries in South America and Southeast Asia continues contributing to the growth of caustic soda market. With increasing industrial activities all around the world, regions have also begun to tailor their production capacities to suit rising demand in caustic soda for key applications.
United States Caustic Soda Market Trends
Various applications such as paper products, packaging materials, and hygiene products drive demand in the United States caustic soda market, with the emergence of sustainable packaging taking center stage. Caustic soda is widely used in developing eco-friendly materials. Its use in manufacturing cleaning agents adds further thrust to the growth of the market. With a clear focus on innovation and efficiency, the United States continues with most expansion to cater to the needs of different industrial and consumer applications.
Asia Pacific Caustic Soda Market Trends
Asia Pacific's caustic soda market is growing rapidly as a result of increased industrial activity. The textile industry, which is well-established in the area, depends on caustic soda for processes like scouring and dyeing. Caustic soda is widely used in India's pulp and paper industries for pulping and bleaching. Additionally, as the demand for clean water increases, caustic soda is becoming more and more important in the water treatment process.
China Caustic Soda Market Trends
Large demand in the paper and pulp and textile industries has supported the growth of the caustic soda market in China. Throughout the textile dyeing and scouring operations, caustic soda is essential. It is used extensively for pulping and bleaching in the paper and pulp industry to guarantee a high-quality product. For the foreseeable future, there will likely be a strong demand for caustic soda as China continues to lead these industries.
Europe Caustic Soda Market Trends
The Europe caustic soda market is growing at a rapid pace. This is because the region witnesses a rapid growth in demand for natural soaps, detergents, and hygiene products. Moreover, the market witnesses that customers in increasing numbers are shifting toward green and sustainable cleaning solutions. Hence, there is a growing production of biodegradable detergents that is largely aided by caustic soda. The market is further stimulated because of rising sustainable norms that are imposed by government legal frameworks that are pushing industries to adopt cleaner, more efficient manufacturing processes.
| CAGR 2026-2035 - Market by | Country |
| India | 2.6% |
| China | 2.5% |
| UK | 2.1% |
| USA | 2.1% |
| France | 1.8% |
| Canada | XX% |
| Germany | XX% |
| Italy | XX% |
| Japan | 1.6% |
| Australia | XX% |
| Saudi Arabia | XX% |
| Brazil | XX% |
| Mexico | XX% |
The majority of companies in the caustic soda industry are focusing on improving production efficiency and corporate sustainability. The leading firms in the caustic soda market are continuously putting eco-friendly practices into place to address the growing environmental concerns brought on by increasing regulatory obligations. Sustainable production methods, waste minimization, and energy-efficient technology that lower overhead, acquisition costs, and offer cost advantages are progressively emerging as the sector's differentiators.
Founded in 2004 and headquartered in France, Arkema Group is the leading manufacturer of specialty chemicals and advanced materials. The company largely focuses on industries like automotive, electronics, and construction, and provides advanced sustainable solutions for infrastructure and interior design.
Covestro AG, established in 2015, offers high-performance polymers and materials. The company’s advanced plastic solutions serve construction, auto, and electronics businesses. Covestro is popularly known for using its products to promote interiors that are both appealing and energy-efficient.
One of the biggest and oldest integrated oil and gas corporations in the world, Occidental Petroleum Corporation was founded in 1920 and is headquartered in Houston, Texas, in the United States. The company contributes to the worldwide caustic market, though its primary activity is energy production.
The Dow Chemical Company, which was founded in 1897, has grown to be a leader in the development of advanced materials and chemicals. Dow chemical offers high-class caustic sodas, coatings, and adhesives, that are extensively used for both external environments and internal settings.
*Please note that this is only a partial list; the complete list of key players is available in the full report. Additionally, the list of key players can be customized to better suit your needs.*
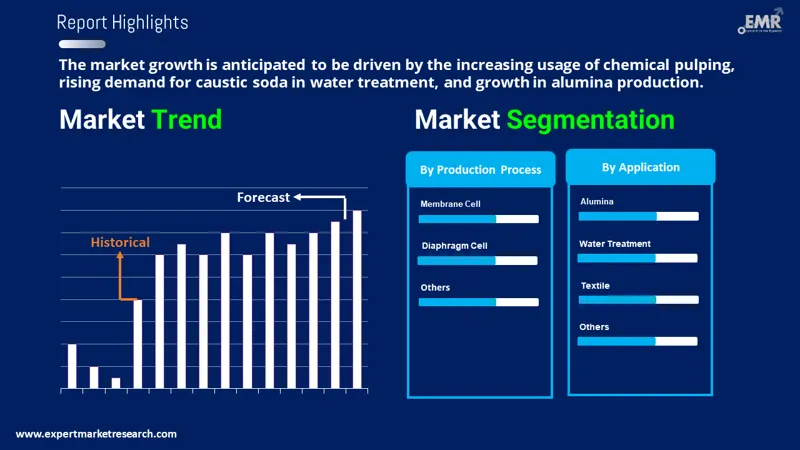
The study on the global caustic soda market is divided into three sections: production, application, and analysis by region. Paper and pulp, textiles, chemicals, and water treatment are among the applications. The geography of the research encompasses North America, Europe, Asia-Pacific, Latin America, the Middle East, and Africa. A thorough approach to addressing demand, potential growth, and regional trends is provided by this segmentation.
Production Process Outlook (Revenue, MMT, 2026-2035)
Application Outlook (Revenue, MMT, 2026-2035)
Region Outlook (Revenue, MMT, 2026-2035)
Upto 15% Off
USD
$2499 $2249
$3999 $3599
$4999 $4249
$5999 $5099


*While we strive to always give you current and accurate information, the numbers depicted on the website are indicative and may differ from the actual numbers in the main report. At Expert Market Research, we aim to bring you the latest insights and trends in the market. Using our analyses and forecasts, stakeholders can understand the market dynamics, navigate challenges, and capitalize on opportunities to make data-driven strategic decisions.*
The caustic soda market as per the industry report is has a volume of 85.92 MMT.
The market is projected to grow at a CAGR of 2.30% between 2026 and 2035.
The key driving factor of the caustic market is growing demand from the aerospace, automotive, and aluminum manufacturing sectors.
The key trend influencing demand in the market is its increased use in the pulping processes in the pulp and paper industry and water treatment applications.
The major regions in the industry are North America, Latin America, Europe, the Middle East and Africa, and the Asia Pacific.
The various types of production processes of caustic soda are membrane cell and diaphragm cell, among others.
The major applications of caustic soda in the market are pulp and paper, organic chemical, inorganic chemical, soap and detergent, alumina, water treatment, textile, and Steel/Metallurgy- Sintering, among others.
The major players considered in the market report are Arkema Group, Covestro AG, Occidental Petroleum Corporation, The Dow Chemical Company, Kemira Oyj, SABIC, Olin Corporation, Westlake Corporation, Formosa Plastics Corporation, Tata Chemicals, Shin-Etsu Chemical Co., Ltd., Akzo Nobel N.V., Solvay, Grasim Industries Limited (India) and Aditya Birla Chemicals (Thailand) Pvt. Ltd, Hanwha Group, and Tosoh India Pvt. Ltd, among others.
The caustic soda market volume is estimated to reach 107.86 MMT by 2035.
The leading segment considered in the market report is application.
The Asia Pacific market held the largest caustic soda market revenue share.
Explore our key highlights of the report and gain a concise overview of key findings, trends, and actionable insights that will empower your strategic decisions.
| REPORT FEATURES | DETAILS |
| Base Year | 2025 |
| Historical Period | 2019-2025 |
| Forecast Period | 2026-2035 |
| Scope of the Report |
Historical and Forecast Trends, Industry Drivers and Constraints, Historical and Forecast Market Analysis by Segment:
|
| Breakup by Production Process |
|
| Breakup by Application |
|
| Breakup by Region |
|
| Market Dynamics |
|
| Competitive Landscape |
|
| Companies Covered |
|
| Report Price and Purchase Option | Explore our purchase options that are best suited to your resources and industry needs. |
| Delivery Format | Delivered as an attached PDF and Excel through email, with an option of receiving an editable PPT, according to the purchase option. |
Datasheet
One User
USD 2,499
USD 2,249
tax inclusive*
Single User License
One User
USD 3,999
USD 3,599
tax inclusive*
Five User License
Five User
USD 4,999
USD 4,249
tax inclusive*
Corporate License
Unlimited Users
USD 5,999
USD 5,099
tax inclusive*
*Please note that the prices mentioned below are starting prices for each bundle type. Kindly contact our team for further details.*
Flash Bundle
Small Business Bundle
Growth Bundle
Enterprise Bundle
*Please note that the prices mentioned below are starting prices for each bundle type. Kindly contact our team for further details.*
Flash Bundle
Number of Reports: 3
20%
tax inclusive*
Small Business Bundle
Number of Reports: 5
25%
tax inclusive*
Growth Bundle
Number of Reports: 8
30%
tax inclusive*
Enterprise Bundle
Number of Reports: 10
35%
tax inclusive*
How To Order

Select License Type
Choose the right license for your needs and access rights.

Click on ‘Buy Now’
Add the report to your cart with one click and proceed to register.

Select Mode of Payment
Choose a payment option for a secure checkout. You will be redirected accordingly.
Strategic Solutions for Informed Decision-Making
Gain insights to stay ahead and seize opportunities.

Get insights & trends for a competitive edge.

Track prices with detailed trend reports.

Analyse trade data for supply chain insights.

Leverage cost reports for smart savings

Enhance supply chain with partnerships.

Connect For More Information
Our expert team of analysts will offer full support and resolve any queries regarding the report, before and after the purchase.
Our expert team of analysts will offer full support and resolve any queries regarding the report, before and after the purchase.
We employ meticulous research methods, blending advanced analytics and expert insights to deliver accurate, actionable industry intelligence, staying ahead of competitors.
Our skilled analysts offer unparalleled competitive advantage with detailed insights on current and emerging markets, ensuring your strategic edge.
We offer an in-depth yet simplified presentation of industry insights and analysis to meet your specific requirements effectively.


