Consumer Insights
Uncover trends and behaviors shaping consumer choices today
Procurement Insights
Optimize your sourcing strategy with key market data
Industry Stats
Stay ahead with the latest trends and market analysis.
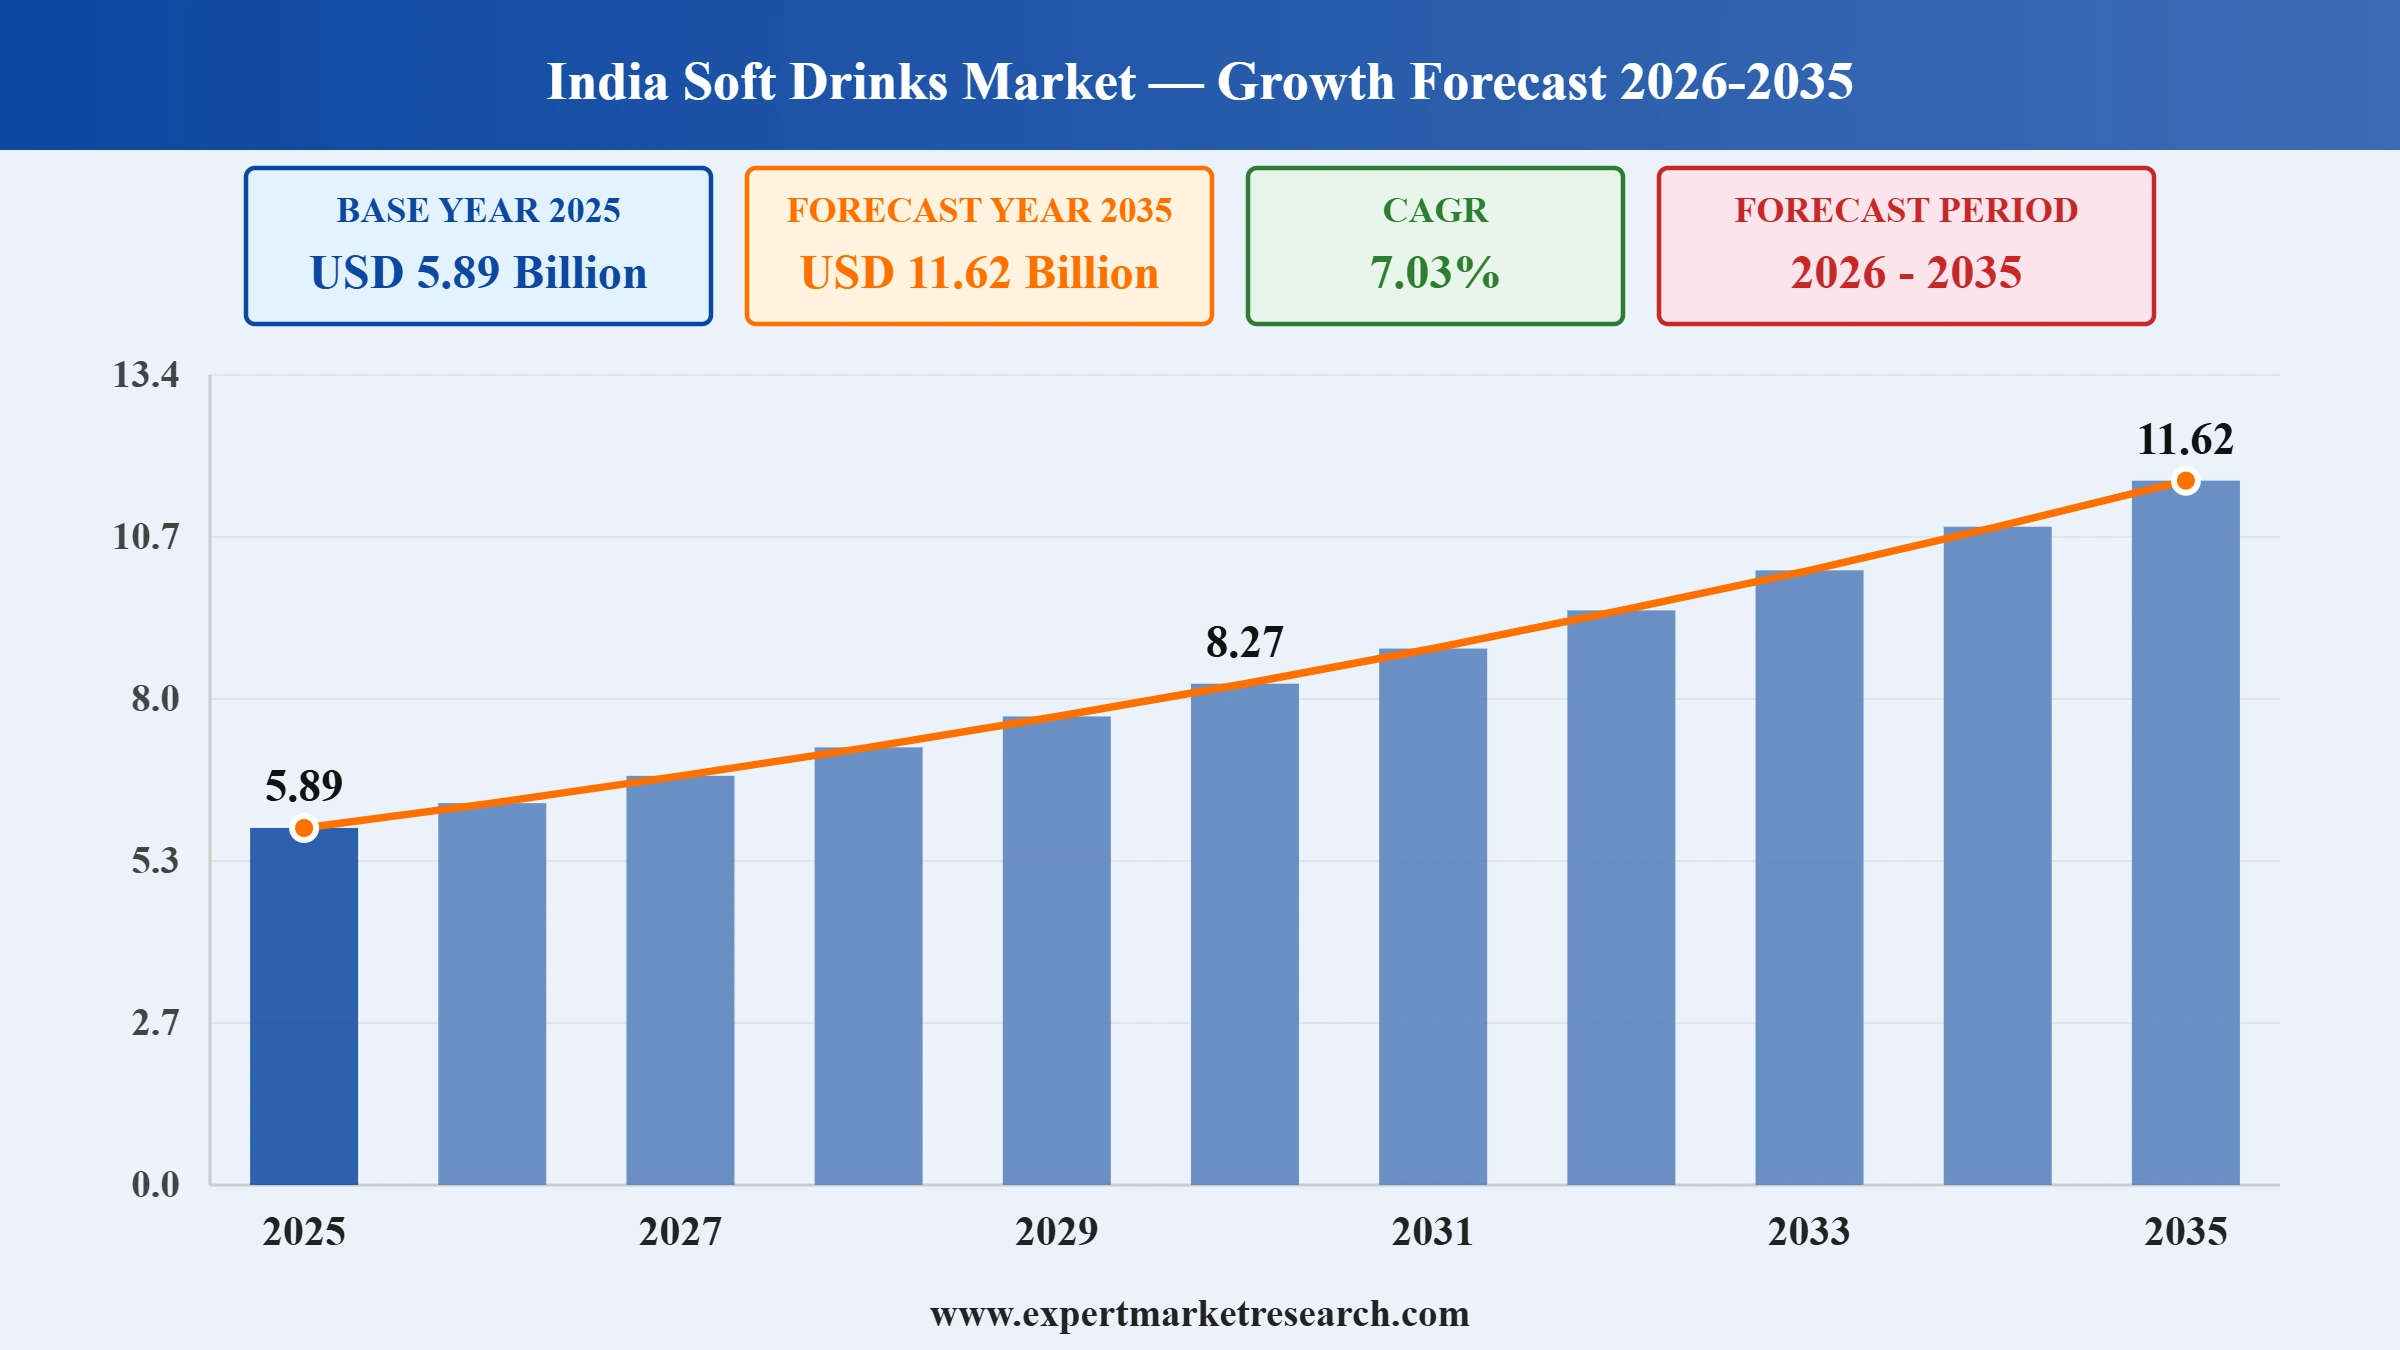
The India soft drinks market attained a value of USD 5.89 Billion in 2025 and is projected to grow at a CAGR of 7.03% through 2035, reaching USD 11.62 Billion by 2035, driven by rapid urbanisation, rising disposable incomes, and intensifying competition among established and emerging domestic beverage manufacturers.
Rapid urbanisation and rising disposable incomes continue to anchor steady demand across the India soft drinks market. Coca-Cola India commands approximately 56.7 percent of the overall market, including roughly 60 percent of carbonated soft drinks, reflecting the category's continued concentration among a small number of established multinational and domestic brands.
The India soft drinks market is witnessing further developments as domestic conglomerates aggressively challenge the long-standing multinational duopoly through disruptive pricing and rapid manufacturing expansion. Reliance Consumer Products reported in April 2026 that its revived Campa Cola brand now operates across 12 manufacturing plants nationwide, as the company continues investing to become one of India's largest cold drinks manufacturers.
In addition, established multinational brands continue reformulating flagship products to address rising health consciousness among urban consumers. Coca-Cola and PepsiCo both introduced zero-sugar and no-sugar variants priced at INR10 across multiple flagship brands in March 2025, including Thums Up X Force, Coke Zero, Sprite Zero, and Pepsi No-Sugar, marking their first India-market entry into diet beverages at this competitive price point.
Read more about this report - REQUEST FREE SAMPLE COPY IN PDF
Domestic conglomerates continue aggressively challenging the long-standing multinational duopoly through rapid manufacturing capacity expansion and disruptive pricing strategies. Reliance Consumer Products reported in its April 2026 fourth-quarter results that its revived Campa Cola brand now operates across 12 manufacturing plants nationwide, with the company's FMCG arm posting Rs22,000 crore in annual revenue for the year ended March 2026 as it continues investing to become one of India's largest cold drinks manufacturers. Companies can pursue rapid manufacturing capacity expansion to challenge established market incumbents through disruptive pricing strategies.
PepsiCo's largest India bottling partner continues pursuing distribution expansion and new product launches to defend market position amid intensifying competition from domestic challengers. Varun Beverages targeted double-digit growth for its India and international operations in the year ahead, according to January 2026 analyst commentary, with growth expected to stem from expanded distribution reach, new product launches, and continued penetration across newly acquired African territories alongside its core Indian business. Companies can pursue distribution reach expansion and new product launches to defend market position amid intensifying domestic competition.
Domestic conglomerates continue committing substantial capital toward beverage manufacturing capacity to directly challenge established multinational market leaders. Reliance Industries announced plans in mid-2025 to invest up to Rs8,000 crore expanding its beverage brands, led by Campa Cola, leveraging its retail network of more than 18,000 stores and JioMart digital presence to take the revived brand national with modern branding, new flavours, and youth-focused marketing. Companies can leverage existing retail and digital distribution infrastructure to accelerate national beverage brand expansion.
Established multinational beverage manufacturers continue reformulating flagship products to address rising health consciousness among urban Indian consumers. Coca-Cola and PepsiCo both introduced zero-sugar and no-sugar variants priced at INR10 across multiple flagship brands in March 2025, including Thums Up X Force, Coke Zero, Sprite Zero, and Pepsi No-Sugar, marking their first India-market entry into diet and light beverages at this competitive mass-market price point. Companies can introduce reformulated low-sugar variants at competitive price points to address rising health consciousness without abandoning established brand equity.
Domestic beverage challengers continue investing in regional bottling infrastructure to strengthen supply chain resilience across underserved Indian states. Reliance Consumer Products announced plans in April 2025 for a new Rs1,000 crore Campa Cola bottling and manufacturing plant across 35 acres in Begusarai, Bihar, representing the company's second major beverage sector investment in the state following an earlier plant in Guwahati, Assam. Companies can invest in regional bottling infrastructure across underserved states to strengthen supply chain resilience and local market presence.
India's food safety regulator continues tightening oversight of high-caffeine beverages marketed under performance-oriented category labels. The Food Safety and Standards Authority of India ordered PepsiCo, Red Bull, Monster Beverage, and Reliance in July 2026 to stop describing their high-caffeine beverages as energy drinks within 90 days, citing the absence of Indian standards for the category despite its rapid growth. Companies can proactively engage with evolving regulatory labelling requirements to maintain uninterrupted market access for fast-growing beverage categories.
Domestic beverage manufacturers continue defending market share against both multinational incumbents and newly aggressive domestic challengers entering the category. Parle Agro, maker of iconic brands including Frooti, Appy, and Bailley, continued to generate approximately Rs9,000 crore in annual turnover according to industry estimates published in July 2026, maintaining its position as one of India's most significant homegrown beverage businesses alongside Tata Consumer Products and Dabur. Companies can maintain focused brand portfolios around iconic homegrown products to defend market share against both multinational and domestic challengers.
Digital-first delivery platforms continue reshaping beverage purchasing patterns as urban consumers increasingly expect rapid, on-demand access to cold drinks. Industry data published in August 2026 showed India's five leading quick-commerce platforms collectively operating more than 3,500 dark stores across ten major cities, with Blinkit commanding the largest network at 969 stores followed by Zepto at 828, reflecting sustained infrastructure investment supporting rapid beverage delivery. Companies can expand quick-commerce partnerships to capture accelerating on-demand beverage delivery growth across major urban centres.
This Expert Market Research Report titled "India Soft Drinks Market Report and Forecast 2026-2035" offers a detailed analysis of the market based on the following segments:
Market Breakup by Product Type
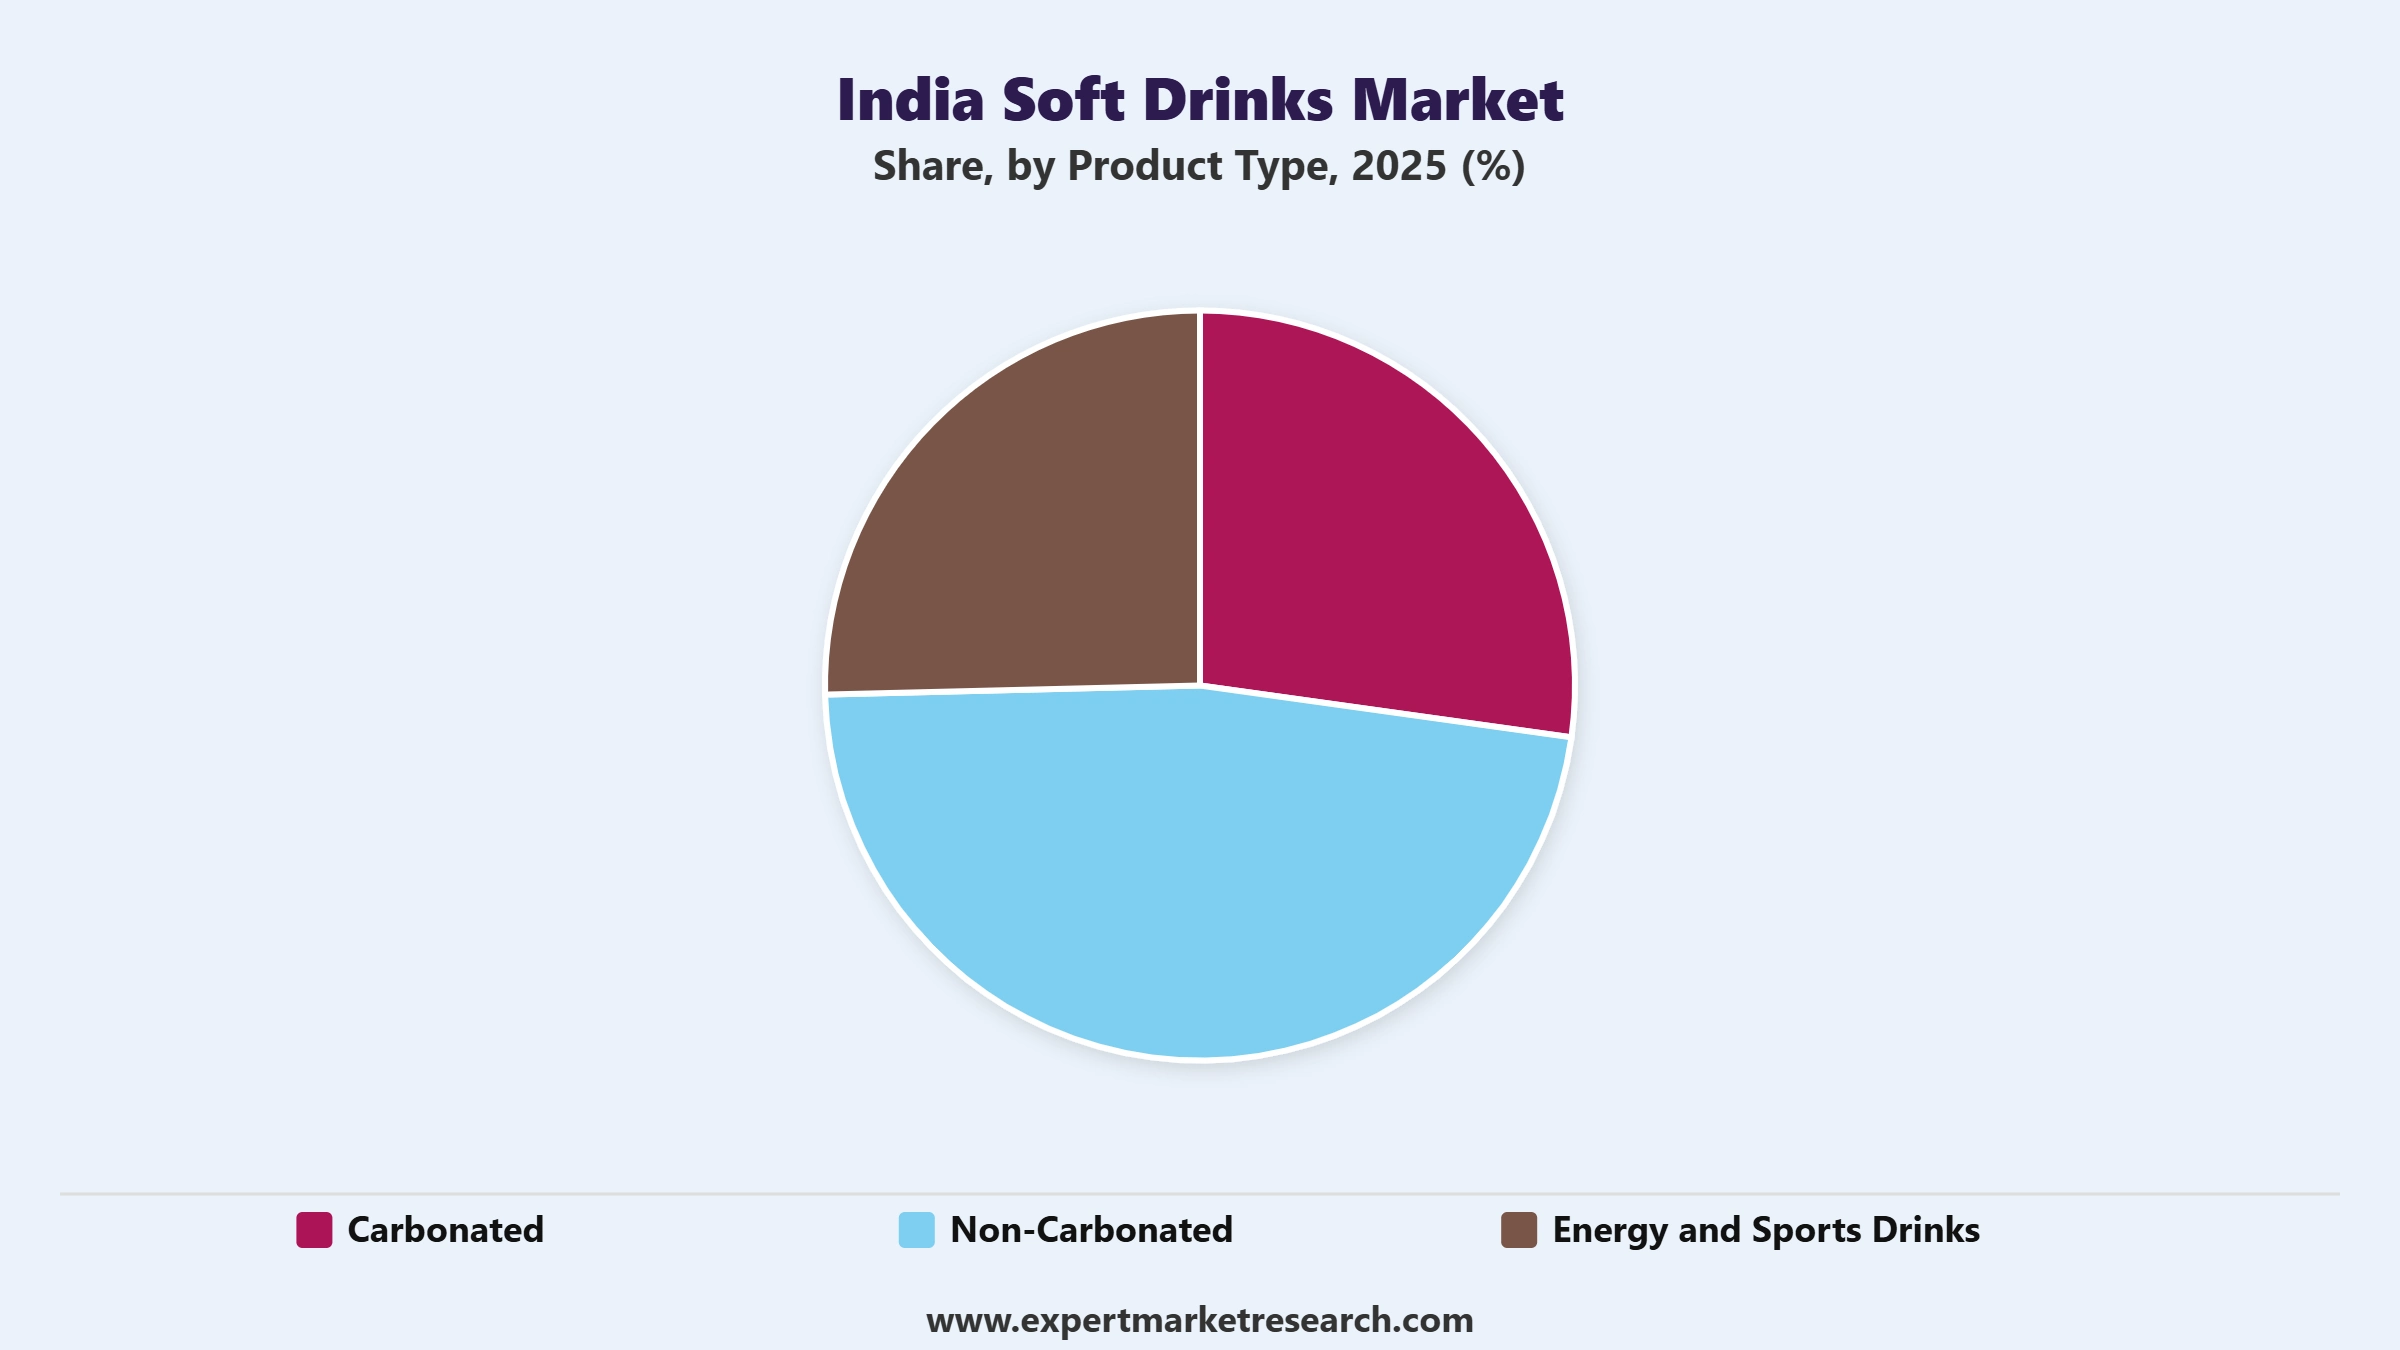
Key Insight: Carbonated accounts for the largest share of the market, reflecting sustained consumer preference for established cola and flavoured soda formats nationwide. Non-Carbonated continues to represent substantial demand tied to juices and flavoured waters across health-conscious urban consumers. Energy and Sports Drinks is growing fastest at a projected 12.40 percent CAGR as fitness culture drives demand, reinforced by industry data published in June 2026 showing the category expanding at 22 to 25 percent annually.
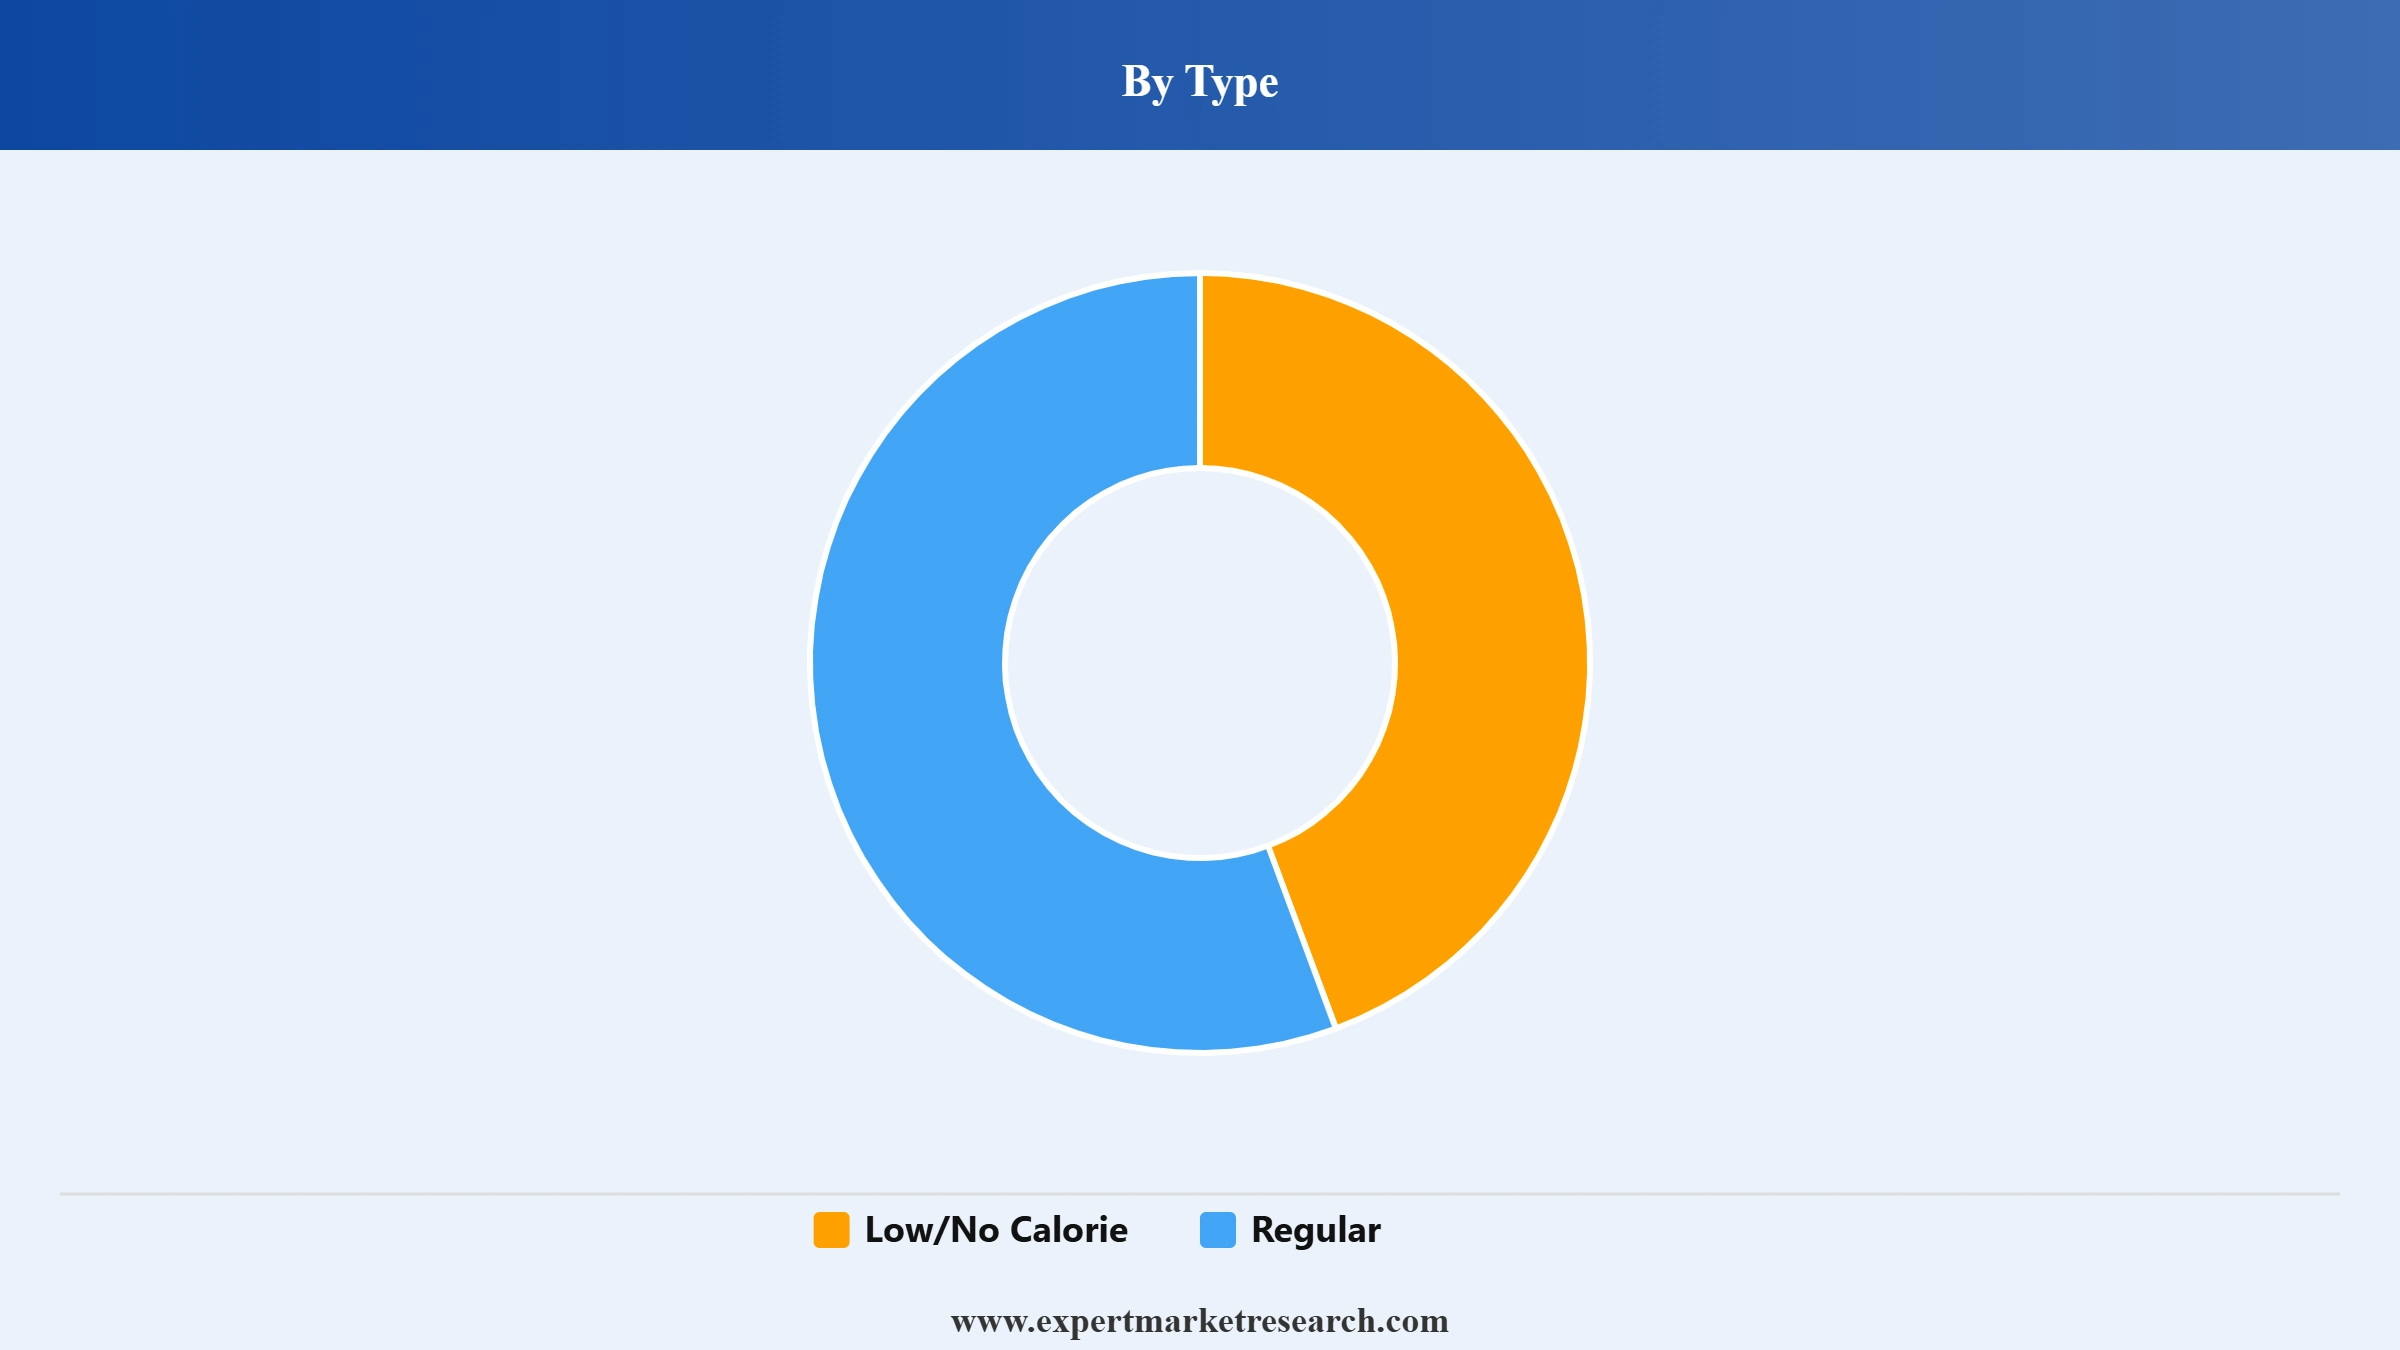
Market Breakup by Type
Key Insight: Regular accounts for the largest share of the market, remaining the default choice across mass-market price tiers and established consumer habits nationwide. Low/No Calorie is gaining share fastest as health-conscious urban consumers increasingly scrutinise sugar content, illustrated by Coca-Cola and PepsiCo's March 2025 launch of INR10 zero-sugar variants across flagship brands including Thums Up X Force, Coke Zero, and Pepsi No-Sugar.
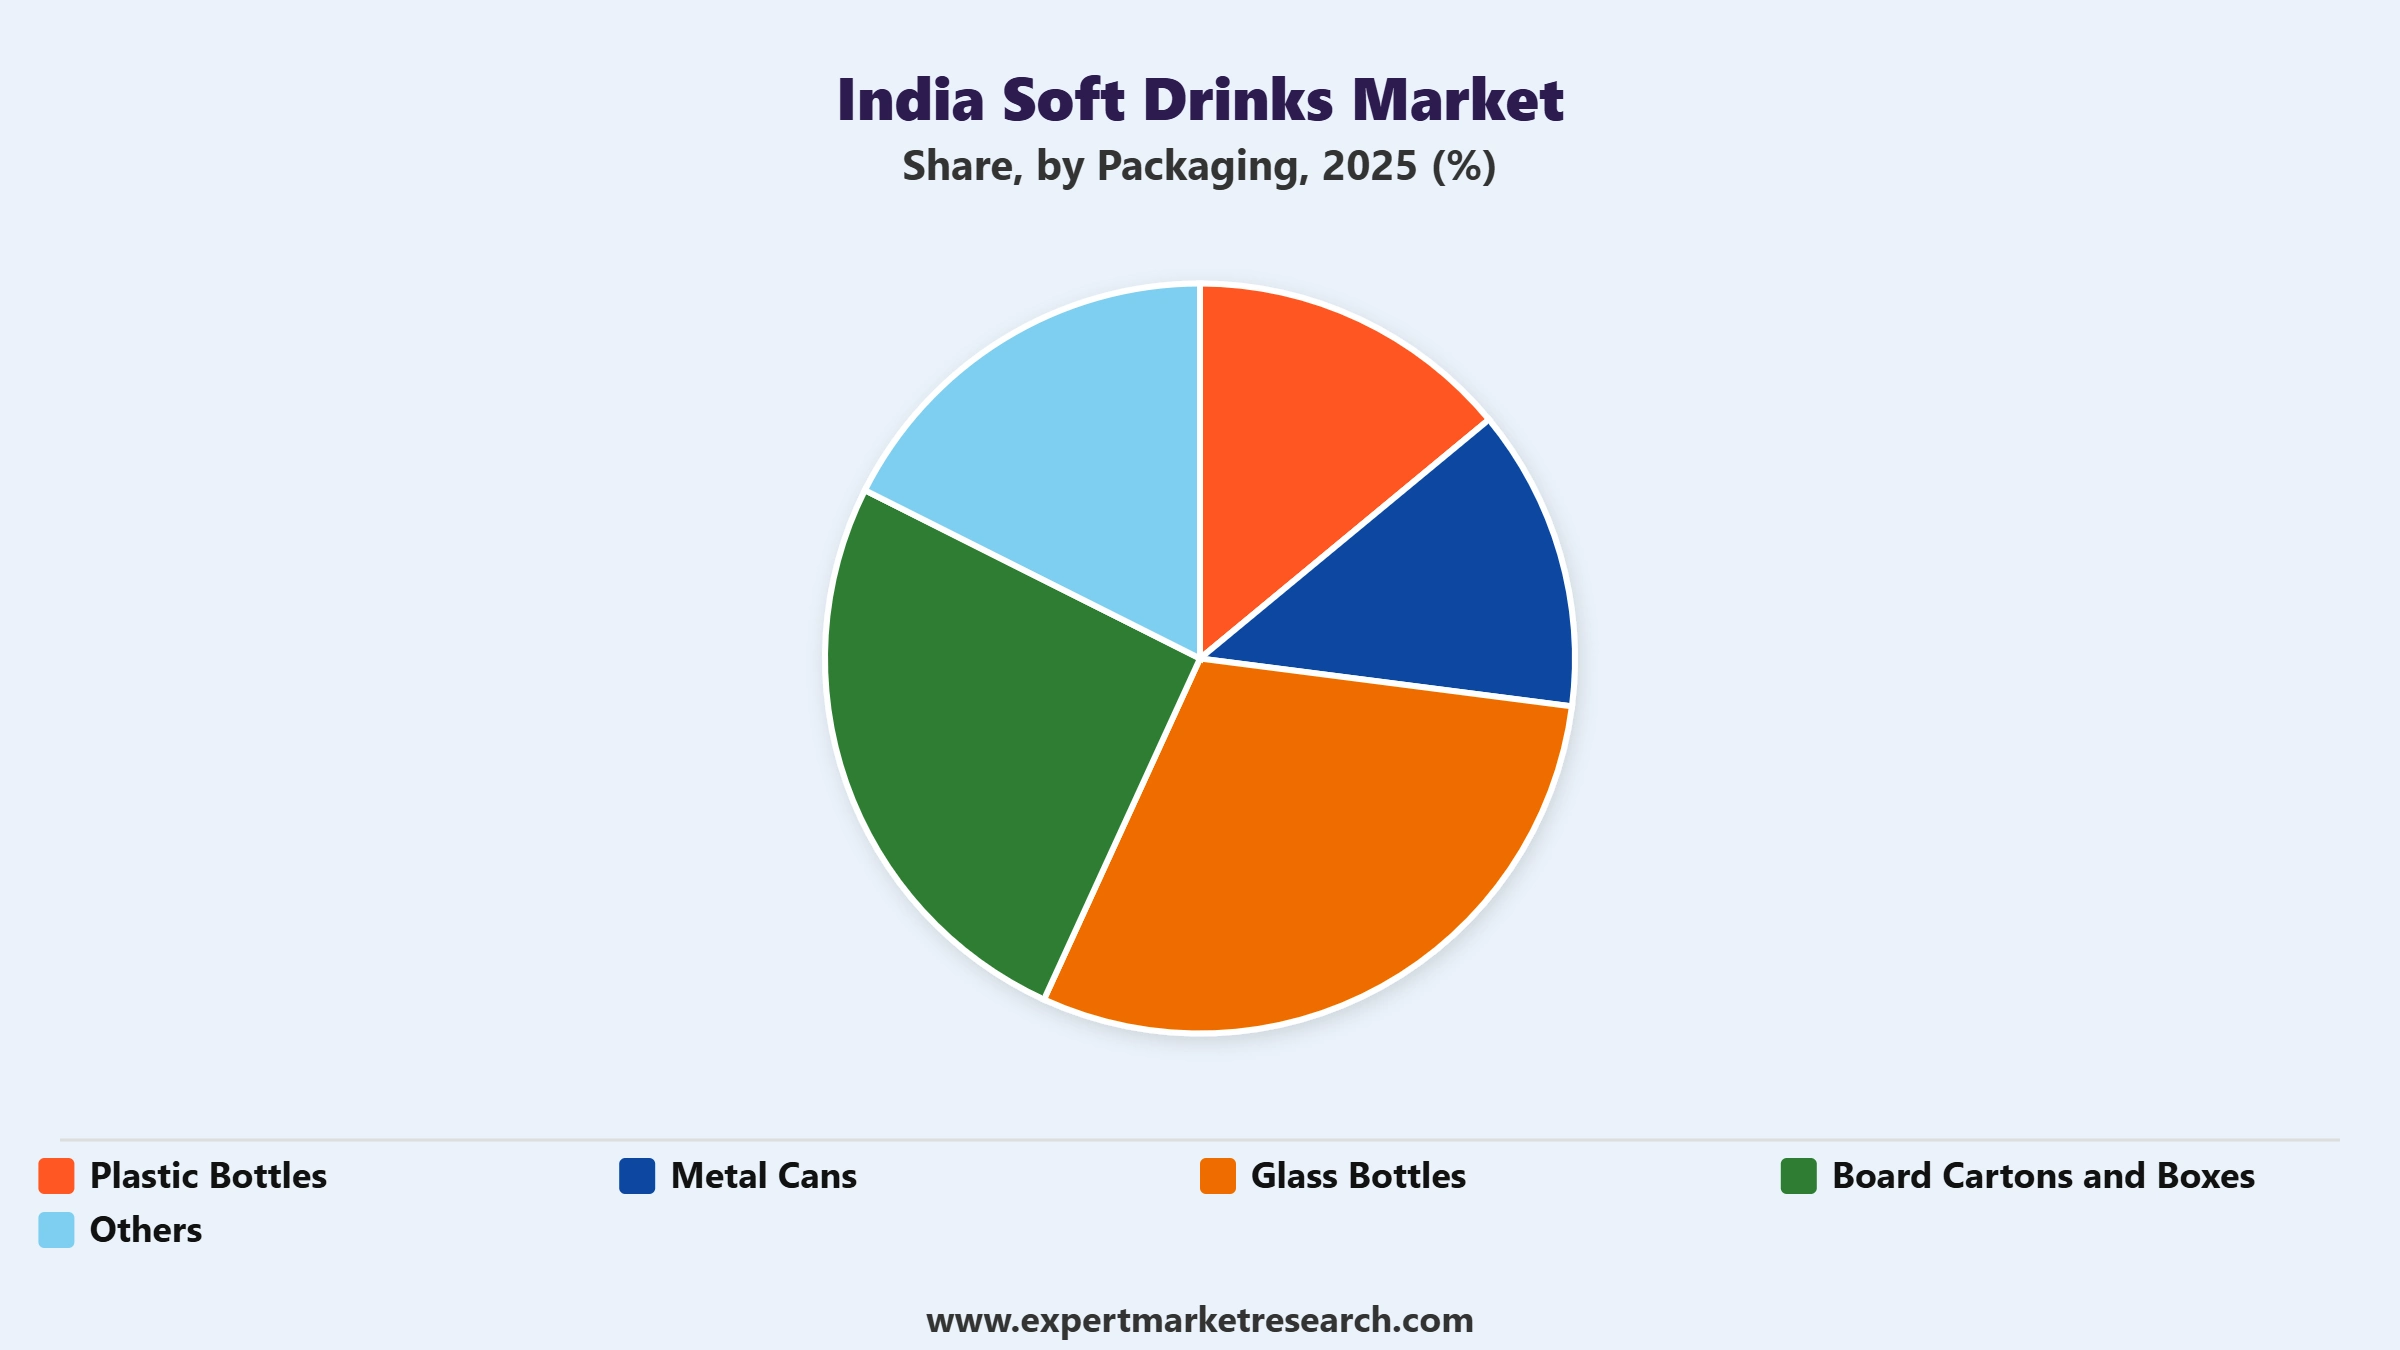
Market Breakup by Packaging
Key Insight: Plastic Bottles accounts for the largest share of the market, offering cost-effective and lightweight packaging across mass-market carbonated and non-carbonated formats nationwide. Metal Cans continue to serve energy drinks and premium single-serve formats, while Glass Bottles remain associated with traditional and returnable packaging models. Board Cartons and Boxes and Others, including juice-focused formats, serve distinct segments tied to shelf-stable and functional beverage categories. Industry estimates published in August 2026 confirmed plastic remains the dominant packaging format nationally, supported by established bottling infrastructure and lower per-unit costs.
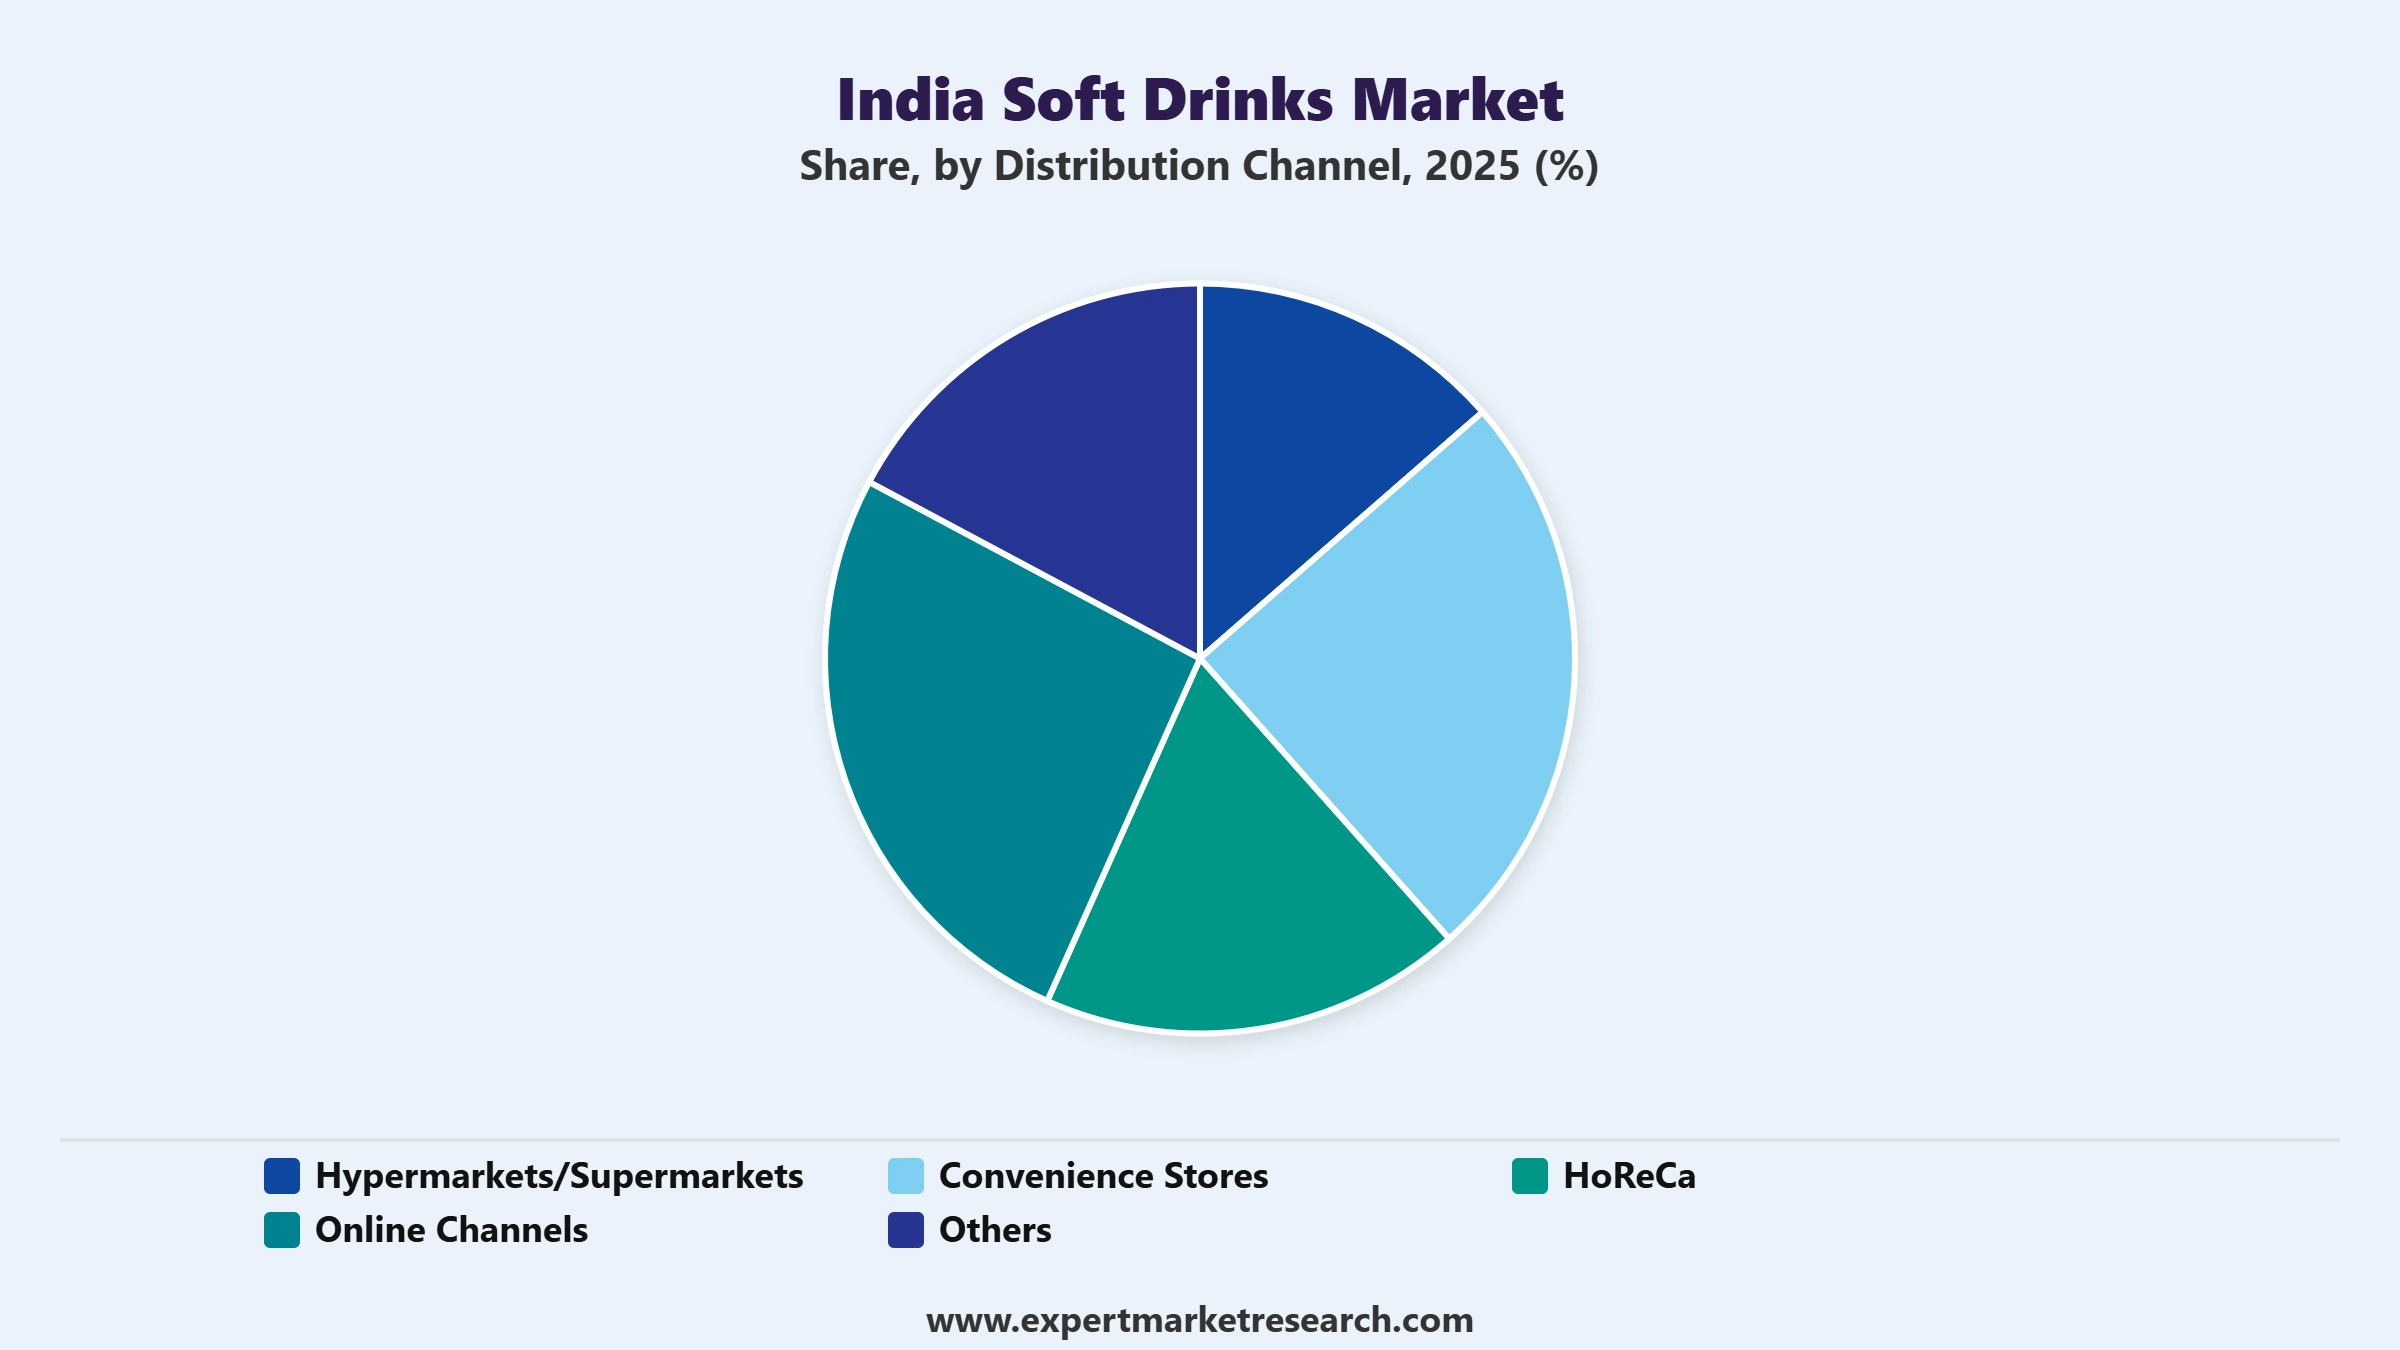
Market Breakup by Distribution Channel
Key Insight: Hypermarkets/Supermarkets accounts for the largest share of the market, offering broad assortment across mass and premium brands through organised retail nationwide. Convenience Stores and HoReCa continue to serve everyday and hospitality-linked consumption respectively, with major players strategically operating in hotels, restaurants, and cafes to bolster brand visibility. Online Channels is growing fastest at a projected 9.80 percent CAGR, reinforced by industry data published in August 2026 showing quick-commerce platforms expanding cold beverage delivery infrastructure across major metro markets nationwide.
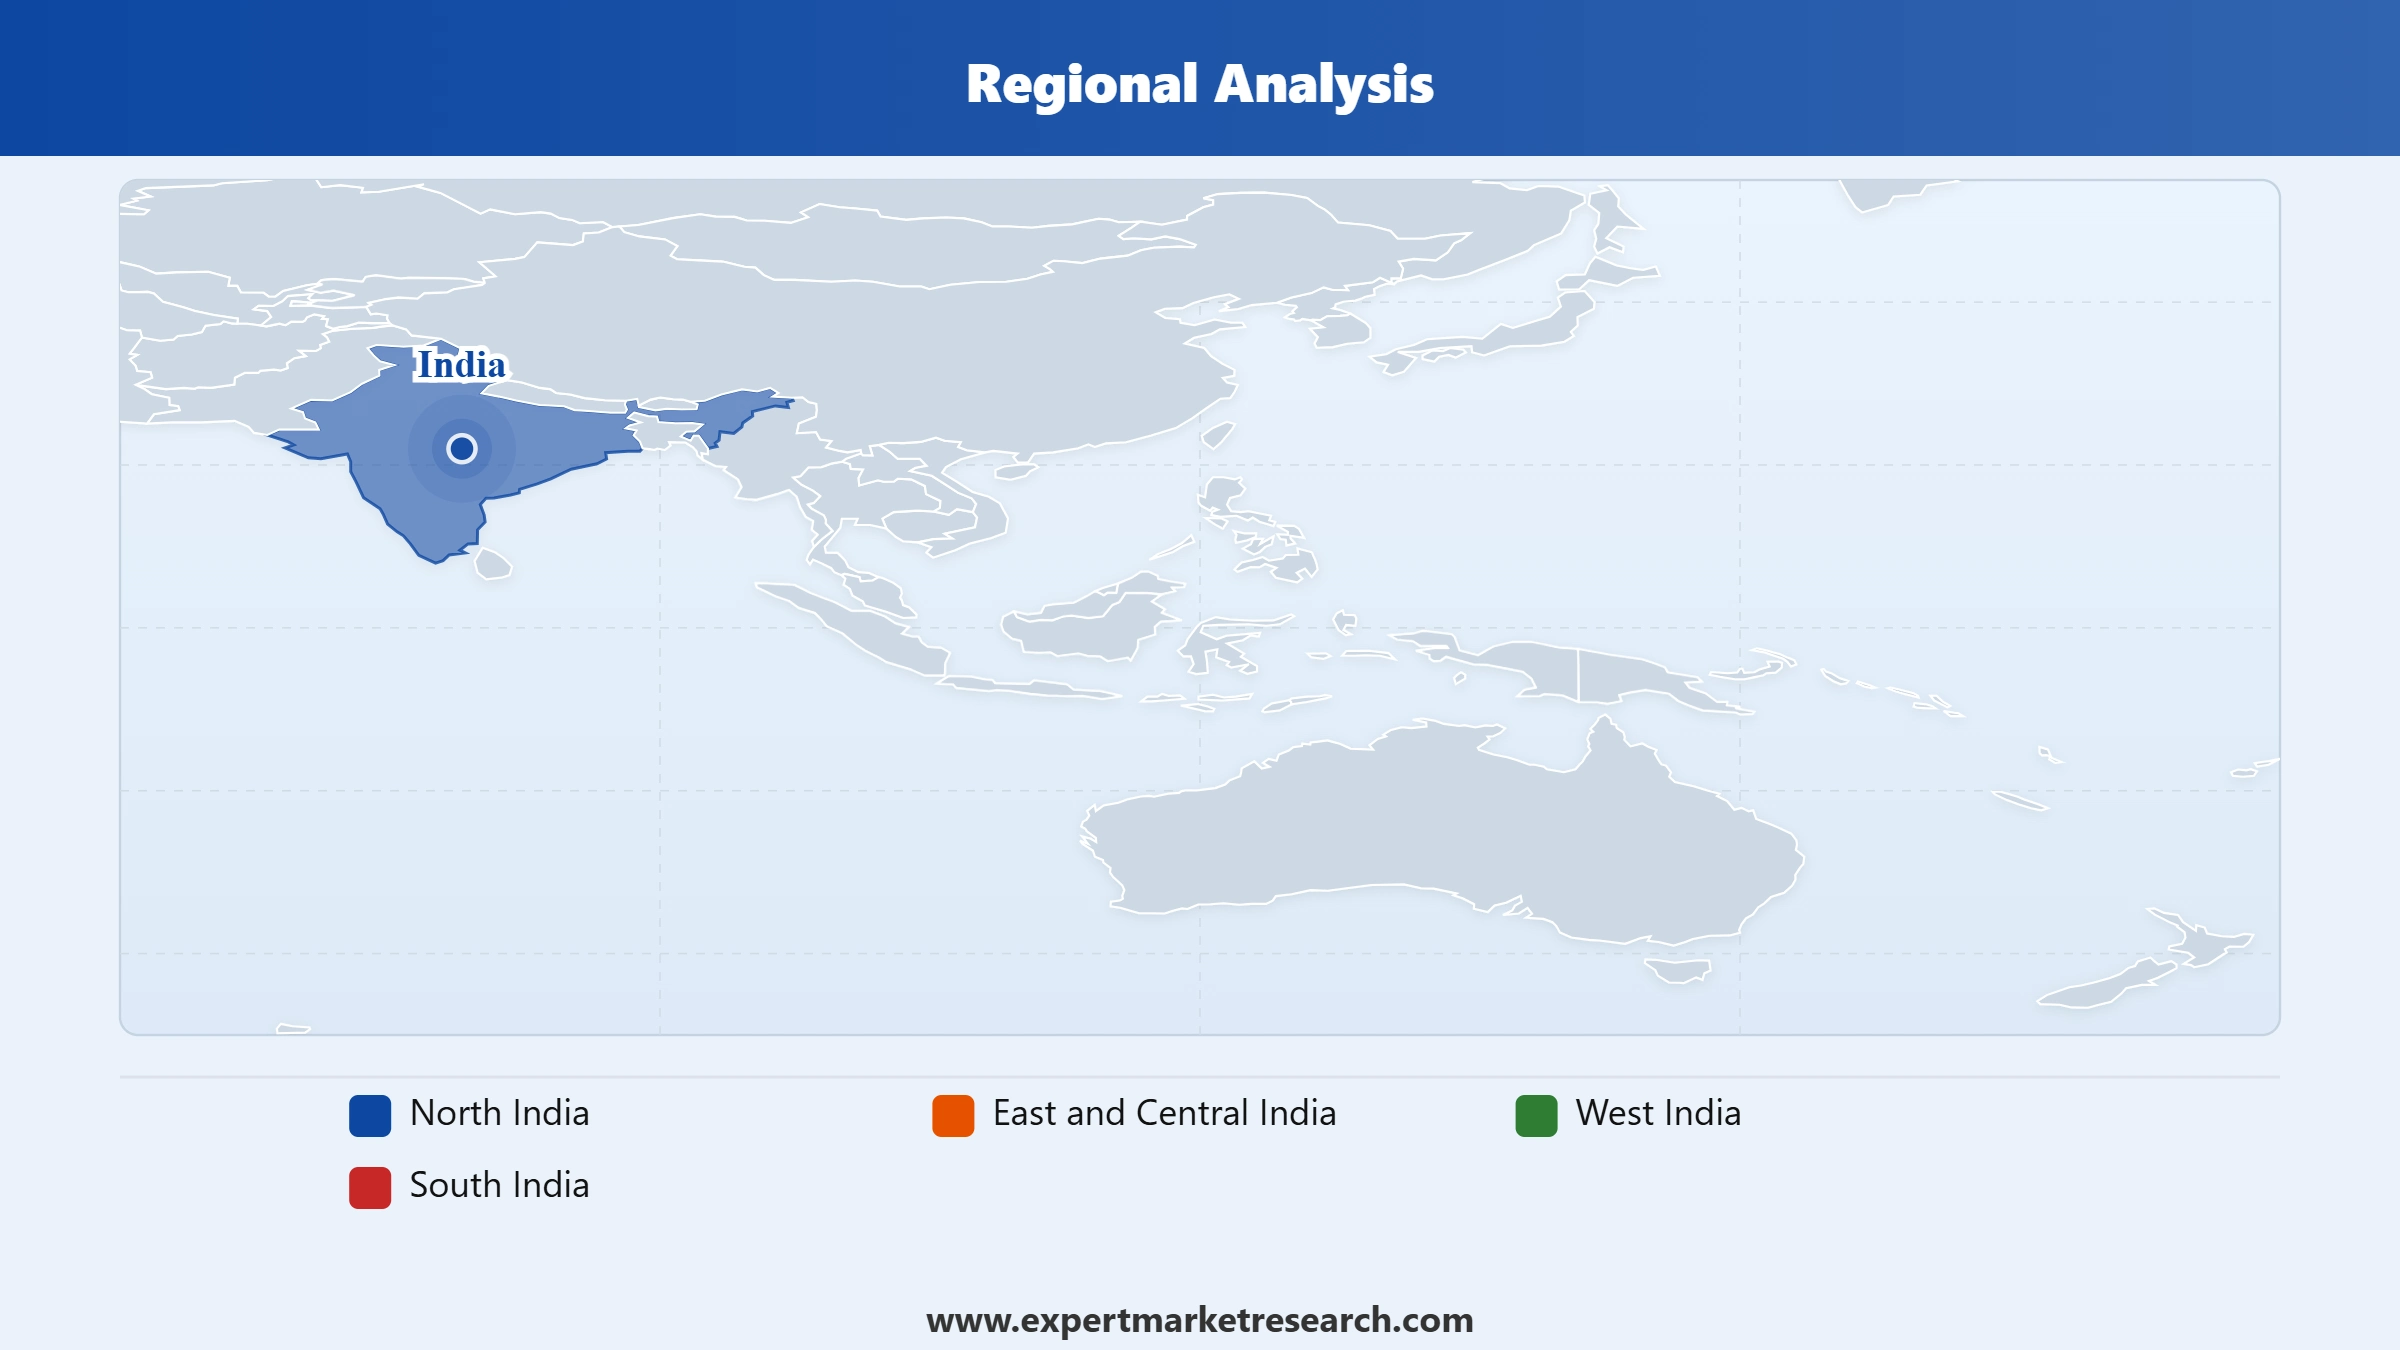
Market Breakup by Region
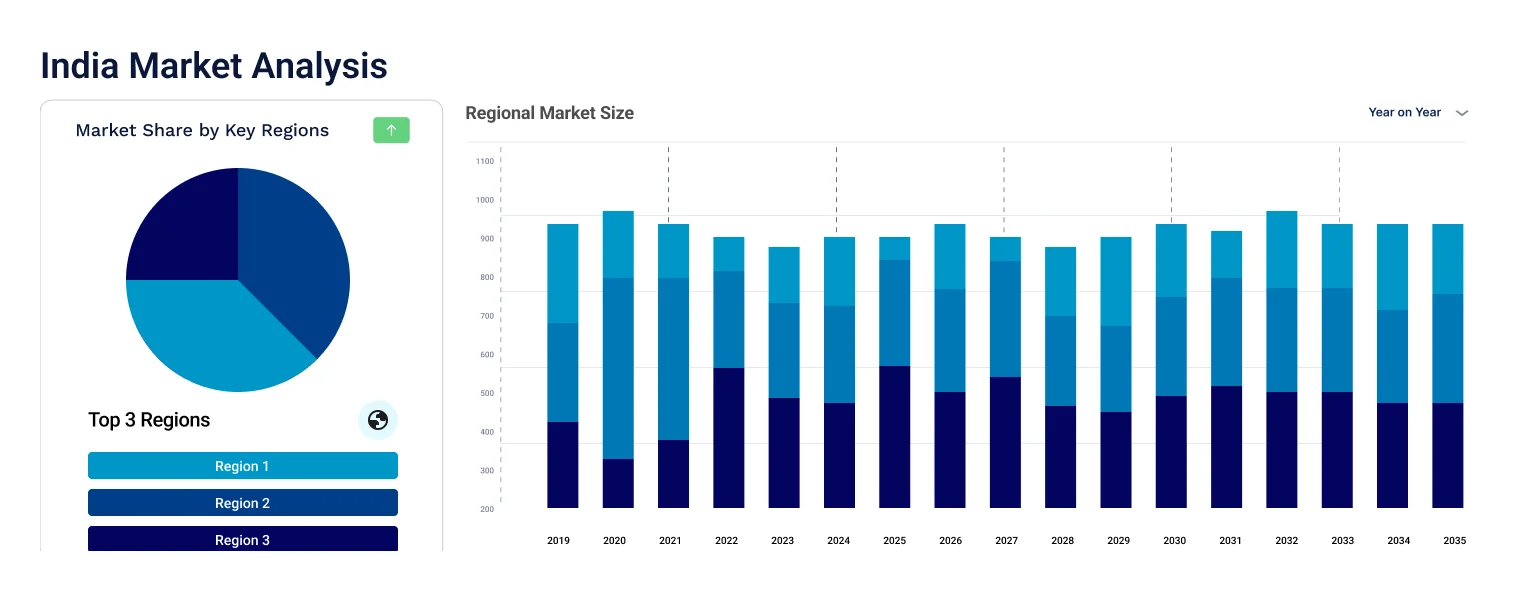
Key Insight: North India accounts for the largest share of the market, supported by its large population base and concentrated urban distribution across Delhi NCR. West India continues to represent substantial demand tied to Mumbai and Pune's dense organised retail networks. East and Central India serves a smaller but steadily expanding base as Reliance Consumer's Bihar bottling investments strengthen regional supply chains. South India is growing fastest at an estimated 7.80 percent CAGR, supported by rising urbanisation and expanding organised retail penetration across Bengaluru, Chennai, and Hyderabad, with industry data published in July 2026 highlighting Karnataka and Telangana as among the fastest-growing state-level markets for premium and functional beverage formats.
Read more about this report - REQUEST FREE SAMPLE COPY IN PDF
Carbonated continues to account for the largest share of the market, reflecting sustained consumer preference for established cola and flavoured soda formats nationwide. Industry estimates published in July 2026 confirmed Coca-Cola India commands approximately 60 percent of the carbonated soft drinks segment specifically, anchoring the dominant product type across both urban and rural distribution channels.
Read more about this report - REQUEST FREE SAMPLE COPY IN PDF
Energy and Sports Drinks is the fastest-growing product type at a projected 12.40 percent CAGR. Monster Energy expanded its Asia Pacific distribution in June 2026 through Coca-Cola's bottling network, with Coca-Cola's regional bottling partner Swire reporting a 45 percent volume increase for Monster in Greater China in 2025, reflecting accelerating energy drink category investment across the wider region.
Regular continues to account for the largest share of the market, remaining the default choice across mass-market price tiers and established consumer purchasing habits nationwide. Industry data published in July 2026 confirmed established multinational and domestic brands continue anchoring the regular formulation segment through extensive distribution networks built over decades.
Read more about this report - REQUEST FREE SAMPLE COPY IN PDF
Low/No Calorie is growing fastest as health-conscious urban consumers increasingly scrutinise sugar content. Industry data published in July 2026 confirmed accelerating consumer adoption of reformulated low-sugar options, as urban Indian consumers increasingly scrutinise nutritional labelling across mass-market beverage categories.
Plastic Bottles continues to account for the largest share of the market, offering cost-effective and lightweight packaging across mass-market carbonated and non-carbonated formats nationwide. Industry estimates published in July 2026 confirmed plastic remains the dominant packaging format across India's soft drinks sector, supported by established bottling infrastructure and lower per-unit costs.
Read more about this report - REQUEST FREE SAMPLE COPY IN PDF
Metal Cans is the fastest-growing packaging format, tracking closely with accelerating energy and sports drinks demand. Industry data published in July 2026 showed energy drink brands growing at approximately 22 to 25 percent annually, reinforcing accelerating demand for single-serve can formats favoured by functional and performance beverage manufacturers nationwide.
Hypermarkets/Supermarkets continues to account for the largest share of the market, offering broad assortment across mass and premium brands through organised retail nationwide. Industry estimates published in July 2026 confirmed established distribution networks continue to anchor the bulk of category-wide sales volume across urban and suburban markets.
Read more about this report - REQUEST FREE SAMPLE COPY IN PDF
Online Channels is the fastest-growing distribution channel at a projected 9.80 percent CAGR. Industry data published in August 2026 showed India's leading quick-commerce platforms collectively operating more than 3,500 dark stores across ten major cities, reinforcing accelerating investment in rapid, on-demand beverage delivery infrastructure nationwide.
Delhi NCR and surrounding urban centres continue to anchor the region's outsized contribution to national soft drinks demand, supported by dense organised retail networks and sustained multinational and domestic brand investment across North India.
Read more about this report - REQUEST FREE SAMPLE COPY IN PDF
West India continues to represent substantial demand tied to Mumbai and Pune's dense organised retail networks, while East and Central India serves a smaller but steadily expanding base as Reliance Consumer's Bihar bottling investments strengthen regional supply chains. South India is the fastest-growing region at an estimated 7.80 percent CAGR, supported by rising urbanisation and expanding organised retail penetration across Bengaluru, Chennai, and Hyderabad.
The industry is fragmented, with India soft drinks market companies ranging from established multinational conglomerates to aggressively expanding domestic challengers competing across product type, packaging, and distribution channel segments nationwide.
Competitive dynamics among India soft drinks players are increasingly shaped by the pace of manufacturing capacity expansion, the depth of low-sugar reformulation, and the strength of quick-commerce distribution partnerships. Manufacturers are investing in disruptive pricing, regional bottling infrastructure, and functional beverage innovation to secure long-term relationships with increasingly health-conscious and digitally native consumers.
Founded in 1892 and headquartered in Atlanta, United States, Coca-Cola India commands approximately 56.7 percent of the overall Indian soft drinks market, including roughly 60 percent of the carbonated soft drinks segment. The company launched INR10 zero-sugar variants across flagship brands including Coke Zero and Sprite Zero in March 2025, extending its reformulation strategy to address rising health consciousness among urban consumers. Coca-Cola's unmatched distribution network across 250 to 350 million retail touchpoints differentiates its offering from smaller domestic competitors.
Founded in 1965 and headquartered in New York, United States, PepsiCo India is the second-largest player in India's soft drinks market, serving carbonated, juice, and sports beverage consumers through a diversified portfolio. The company launched its Pepsi No-Sugar variant at an INR10 price point in March 2025 alongside Coca-Cola's parallel reformulation push, marking its first India-market entry into mass-market diet beverages. PepsiCo's integrated snack-and-beverage retail relationships differentiate its offering from single-category beverage competitors.
Founded in 1966 and headquartered in Mumbai, India, Reliance Industries revived the legacy Campa Cola brand in 2023 and has since committed up to Rs8,000 crore toward national beverage expansion. The company reported in April 2026 that Campa Cola now operates across 12 manufacturing plants nationwide, leveraging Reliance's retail network of more than 18,000 stores and JioMart digital presence to challenge the established multinational duopoly. Reliance's disruptive INR10 pricing and integrated retail-digital distribution infrastructure differentiate its offering from both multinational and smaller domestic competitors.
Founded in 1985 and headquartered in Mumbai, India, Parle Agro is one of India's leading homegrown beverage companies, known for iconic brands including Frooti, Appy, and Bailley. The company continued generating approximately Rs9,000 crore in annual turnover as of 2026, maintaining its position among India's most significant domestic beverage businesses. Parle Agro's decades-long brand heritage and iconic product portfolio differentiate its offering from newer domestic entrants and multinational competitors alike.
Other key players in the India soft drinks market include Red Bull GmbH, Monster Beverage Corporation, Nestlé S.A., HAMMER NUTRITION INDIA B.V., PRIME Hydration, LLC, and NAM VIET FOODS & BEVERAGE JSC, among others.
*Please note that this is only a partial list; the complete list of key players is available in the full report. Additionally, the list of key players can be customized to better suit your needs.*
Unlock the latest insights with our India soft drinks market trends 2026 report. Discover regional growth patterns, product type and distribution channel adoption trends, and key industry players. Stay ahead of competition with trusted data and expert analysis. Download your free sample report today and drive informed decisions in the market.


Upto 15% Off
USD
$2499 $2249
$3999 $3599
$4999 $4249
$5999 $5099


*While we strive to always give you current and accurate information, the numbers depicted on the website are indicative and may differ from the actual numbers in the main report. At Expert Market Research, we aim to bring you the latest insights and trends in the market. Using our analyses and forecasts, stakeholders can understand the market dynamics, navigate challenges, and capitalize on opportunities to make data-driven strategic decisions.*
In 2025, the market reached an approximate value of USD 5.89 Billion.
The market is projected to grow at a CAGR of 7.03% between 2026 and 2035.
The revenue generated from the soft drinks market is expected to reach USD 11.62 Billion in 2035.
Based on product type, the soft drinks market is divided into carbonated, non-carbonated and energy and sports drinks.
The key players in the market include The Coca-Cola Company, PepsiCo, Inc., Reliance Industries Limited, Parle Agro Pvt. Ltd., Red Bull GmbH, Monster Beverage Corporation, Nestlé S.A., HAMMER NUTRITION INDIA B.V., PRIME Hydration, LLC, and NAM VIET FOODS & BEVERAGE JSC.
Based on the packaging, the market is divided into plastic bottles, metal cans, glass bottles, board cartons and boxes and others.
The soft drinks market is categorised based on distribution channels, which include supermarkets and hypermarkets, convenience stores, speciality stores, and online, among others.
Based on region, the market is broken down into North India, East and Central India, West India, and South India.
Manufacturers face intensifying competitive pressure from disruptive domestic entrants, stringent regulatory norms, fluctuating raw material prices, and rising environmental concerns tied to plastic packaging.
Expanding manufacturing capacity to challenge established incumbents, launching low-sugar and functional beverage reformulations, strengthening quick-commerce distribution partnerships, and investing in regional bottling infrastructure.
Explore our key highlights of the report and gain a concise overview of key findings, trends, and actionable insights that will empower your strategic decisions.
| REPORT FEATURES | DETAILS |
| Base Year | 2025 |
| Historical Period | 2019-2025 |
| Forecast Period | 2026-2035 |
| Scope of the Report |
Historical and Forecast Trends, Industry Drivers and Constraints, Historical and Forecast Market Analysis by Segment:
|
| Breakup by Product Type |
|
| Breakup by Type |
|
| Breakup by Packaging |
|
| Breakup by Distribution Channel |
|
| Breakup by Region |
|
| Market Dynamics |
|
| Competitive Landscape |
|
| Companies Covered |
|
Datasheet
One User
USD 2,499
USD 2,249
tax inclusive*
Single User License
One User
USD 3,999
USD 3,599
tax inclusive*
Five User License
Five User
USD 4,999
USD 4,249
tax inclusive*
Corporate License
Unlimited Users
USD 5,999
USD 5,099
tax inclusive*
*Please note that the prices mentioned below are starting prices for each bundle type. Kindly contact our team for further details.*
Flash Bundle
Small Business Bundle
Growth Bundle
Enterprise Bundle
*Please note that the prices mentioned below are starting prices for each bundle type. Kindly contact our team for further details.*
Flash Bundle
Number of Reports: 3
20%
tax inclusive*
Small Business Bundle
Number of Reports: 5
25%
tax inclusive*
Growth Bundle
Number of Reports: 8
30%
tax inclusive*
Enterprise Bundle
Number of Reports: 10
35%
tax inclusive*
How To Order

Select License Type
Choose the right license for your needs and access rights.

Click on ‘Buy Now’
Add the report to your cart with one click and proceed to register.

Select Mode of Payment
Choose a payment option for a secure checkout. You will be redirected accordingly.
Strategic Solutions for Informed Decision-Making
Gain insights to stay ahead and seize opportunities.
Get insights & trends for a competitive edge.
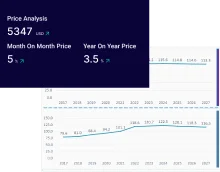
Track prices with detailed trend reports.
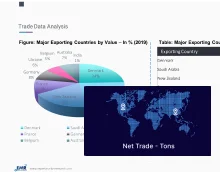
Analyse trade data for supply chain insights.
Leverage cost reports for smart savings
Enhance supply chain with partnerships.
Connect For More Information
Our expert team of analysts will offer full support and resolve any queries regarding the report, before and after the purchase.
Our expert team of analysts will offer full support and resolve any queries regarding the report, before and after the purchase.
We employ meticulous research methods, blending advanced analytics and expert insights to deliver accurate, actionable industry intelligence, staying ahead of competitors.
Our skilled analysts offer unparalleled competitive advantage with detailed insights on current and emerging markets, ensuring your strategic edge.
We offer an in-depth yet simplified presentation of industry insights and analysis to meet your specific requirements effectively.