

Consumer Insights
Uncover trends and behaviors shaping consumer choices today
Procurement Insights
Optimize your sourcing strategy with key market data
Industry Stats
Stay ahead with the latest trends and market analysis.
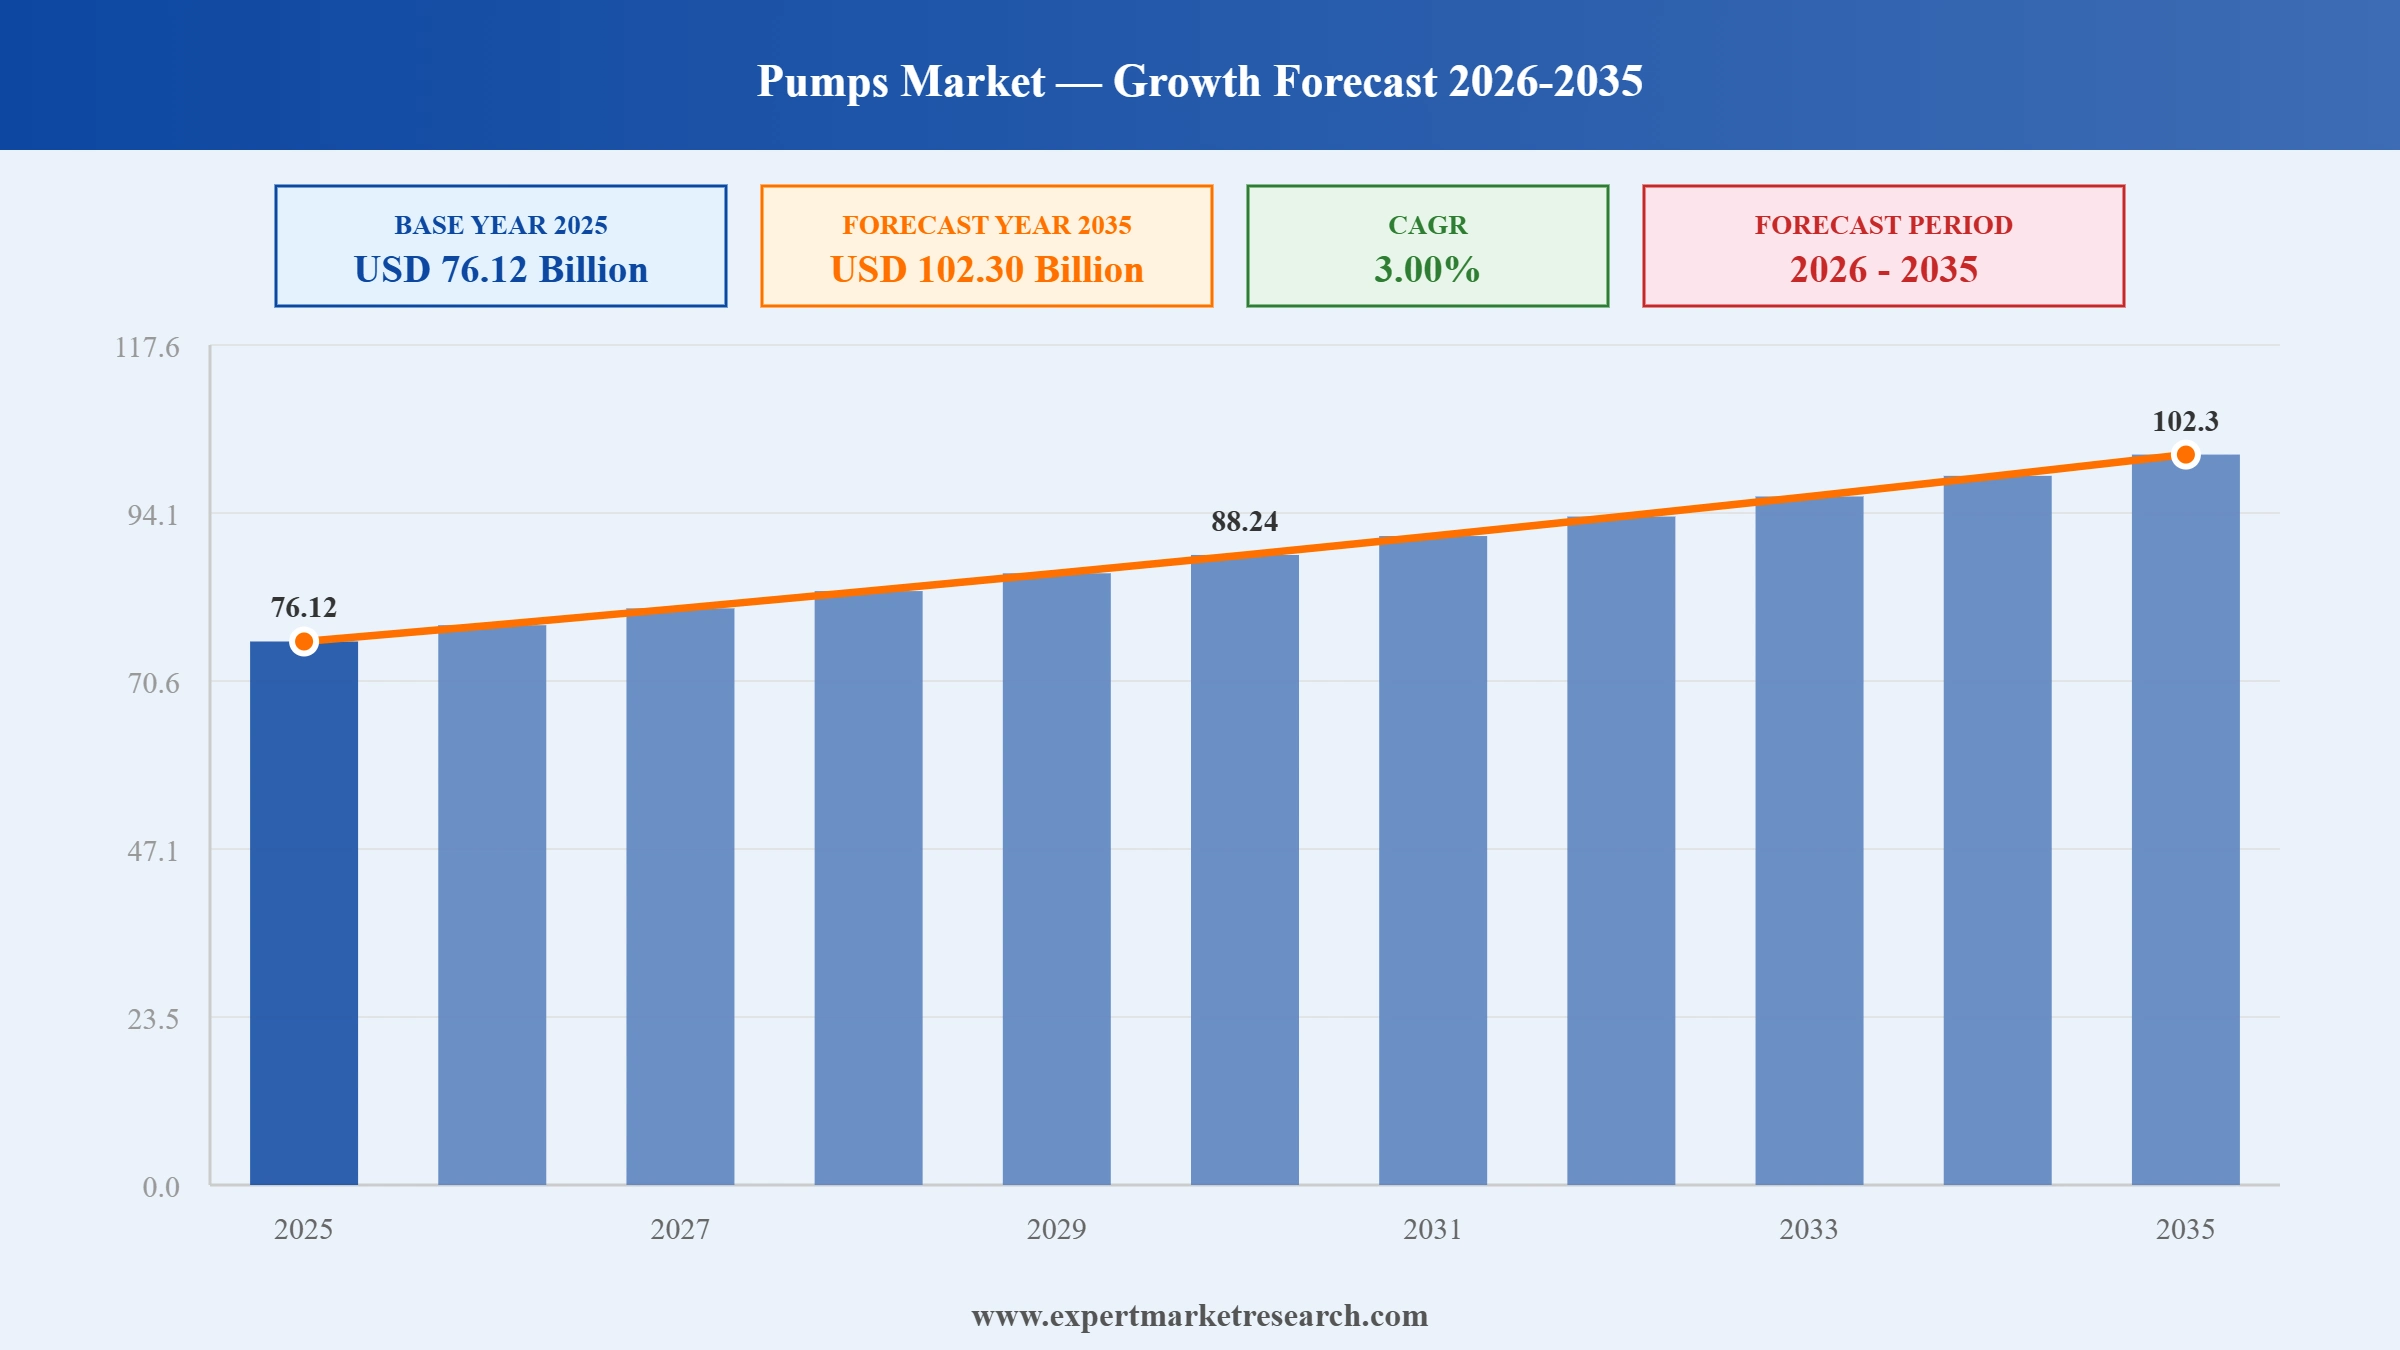
The global pumps market size was valued at USD 76.12 Billion in 2025 and is expected to grow at a CAGR of 3.00% between 2026 and 2035, reaching USD 102.30 Billion by 2035.
Pumps serve critical functions in various industries, with a significant role in boosting fluid pressure and elevating fluid pressure to ensure optimal performance. Pumps play a crucial role in applications like oil & gas exploration and infrastructure, including HDD for manufacturing processes. The growing demand for pumps, particularly those offering greater flow rates, is set to drive market growth.
The forecast period indicates increasing adoption of pumps for fluid and reagent metering, enhancing efficiency in different sectors.
The fleet of electric vehicles is expected to grow from 30 million in 2022 to 240 million in 2030, aiding the demand for mining for battery production.
According to the United Nations, in 2020, 56% of household wastewater flows were treated safely, aiding the demand for pumps.
Read more about this report - REQUEST FREE SAMPLE COPY IN PDF
| Global Pumps Market Report Summary | Description | Value |
| Base Year | USD Billion | 2025 |
| Historical Period | USD Billion | 2019-2025 |
| Forecast Period | USD Billion | 2026-2035 |
| Market Size 2025 | USD Billion | 76.12 |
| Market Size 2035 | USD Billion | 102.30 |
| CAGR 2019-2025 | Percentage | XX% |
| CAGR 2026-2035 | Percentage | 3.00% |
| CAGR 2026-2035 - Market by Region | Asia Pacific | 3.4% |
| CAGR 2026-2035 - Market by Country | India | 4.3% |
| CAGR 2026-2035 - Market by Country | China | 3.9% |
| CAGR 2026-2035 - Market by Type | Centrifugal Pumps | 3.2% |
| CAGR 2026-2035 - Market by End Use | Water and Wastewater | 3.5% |
| Market Share by Country 2025 | Italy | 3.1% |
Pumps are central to fluid management, driving market growth across various sectors. The construction sector, urban development, and agricultural investments are key drivers of pump demand, with pumps playing a critical role in infrastructure applications such as HDD. Wastewater treatment and water & wastewater management further highlight the importance of pumps in environmental management. Technology advancements continue to enhance pump performance, boosting market growth. Agriculture, particularly in farming and irrigation, also contributes significantly to pump demand. Overall, these factors combine to support substantial market growth for pumps across multiple industries.
The global market for pumps is intensively competitive, driven by continuous design innovation and advancements. The development of pumps relies on key internal components such as impellers, bearings, and diaphragms. Research and development (R&D) plays a crucial role in improving pump efficiency. With evolving regional markets, the worldwide market for pumps continues to grow, driven by innovative pump design and performance.
The pumps market sees increasing competition, with both local brands and global players vying for market share. To meet market requirements, companies are focusing on strengthening their brand reputation through innovation and expanding their technological capabilities and product portfolios. Strategic expansion, mergers and acquisitions, collaborations, and partnerships are becoming common strategies for companies aiming to improve their geographical reach and market presence. Regional needs also influence market dynamics, as businesses adapt to local demands. By leveraging advanced technological capabilities, companies are positioning themselves to meet evolving market trends and ensure long-term success in a highly competitive environment.
The global pump market is experiencing intense competitive dynamics as companies strive to capture a larger market share. Technological advancements are driving growth, with a focus on energy-efficient solutions and innovative, high-efficiency pumps. Research and development (R&D) plays a pivotal role in the continuous improvement of pump performance, catering to the needs of end-users across various sectors. Sustainability is a key focus, with regulatory pressures encouraging the development of eco-friendly pumps. As the demand for advanced pump technologies increases, companies are investing in innovation to meet the evolving expectations of the market, ensuring long-term growth and success in this rapidly changing landscape.
The global pumps market is witnessing significant shifts in market dynamics, driven by sustainability and energy conservation efforts. Key players are increasingly focusing on engineering pumps that promote energy-efficient operations, reducing the carbon footprint. Modern pumps, including metering pumps, are being designed with Variable Frequency Drivers (VFDs) to optimise pump speed and flow, improving efficiency. The rise of digital control systems and the Industrial Internet of Things (IoT) are enhancing the functionality and performance of pumps, enabling better control and monitoring. In the consumer sector, demand for energy-efficient solutions is growing, and innovations in pump technology continue to shape the market, providing advanced, sustainable solutions for various industries.
The global pump market is increasingly focused on reducing installation and maintenance costs while promoting energy-efficient and environmentally friendly alternatives. Government regulations are pushing for solutions that lower energy consumption and reduce emissions, driving companies to innovate in pump design. The shift towards sustainable technologies is vital as industries seek to meet stringent environmental standards, aligning with the growing demand for greener, cost-effective solutions in the pump sector.
Sustainable water use is becoming a priority, with the demand for pumps rising due to wastewater treatment regulations. Effective water management in sectors like desalination plants, water recycling, and sewage treatment is essential for meeting regulatory demands, pushing growth in the pump market. Wastewater treatment is critical to maintaining water quality and addressing global resource challenges.
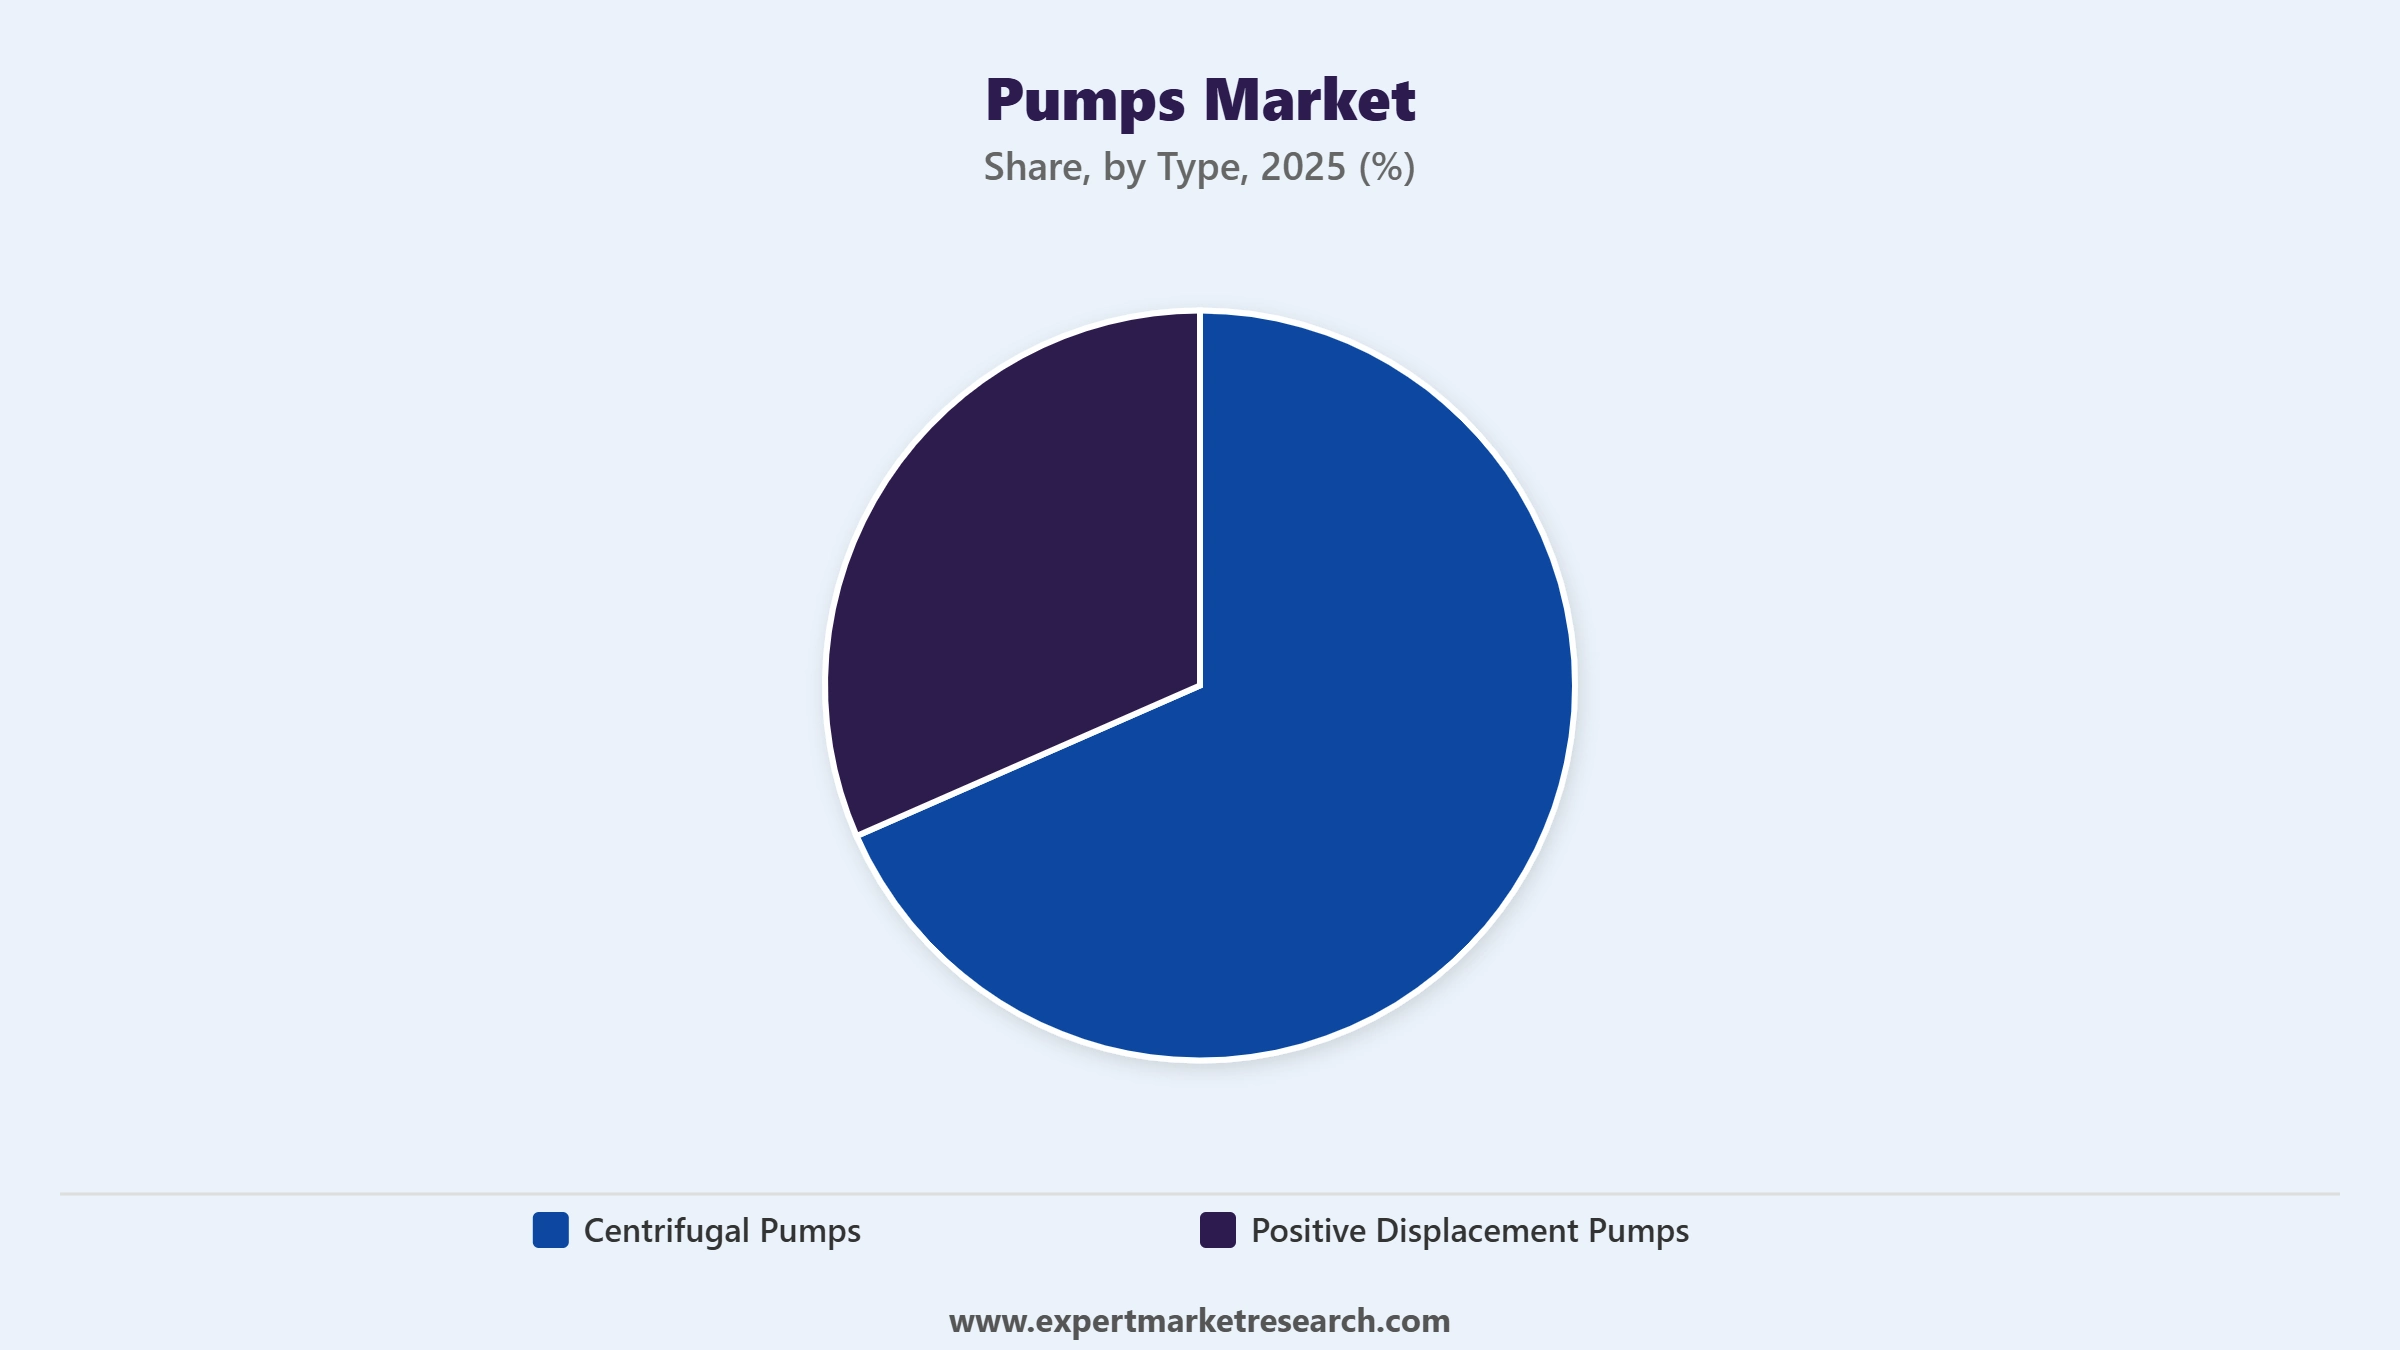
Centrifugal pumps are widely used in the global pumps market due to their ability to handle large volumes of liquids efficiently at relatively low to moderate pressures. They offer simple construction, making them cost-effective and easy to maintain. These pumps are versatile, capable of transferring a wide range of liquids, including water, chemicals, and oils. Their adaptability, low operational costs, and reliable performance in various industries such as water treatment, oil and gas, and HVAC systems contribute to their widespread use.
Read more about this report - REQUEST FREE SAMPLE COPY IN PDF
Positive displacement pumps are highly valued in the global pumps market for their ability to provide accurate flow rates and handle high-pressure applications. These pumps are ideal for transferring viscous fluids or fluids with varying viscosities, ensuring consistent output regardless of changes in pressure or flow. Their precision makes them particularly useful in industries such as chemical processing, food and beverage, and pharmaceuticals, where consistent and controlled fluid delivery is essential. The durability and efficiency of positive displacement pumps drive their demand for critical fluid handling tasks.
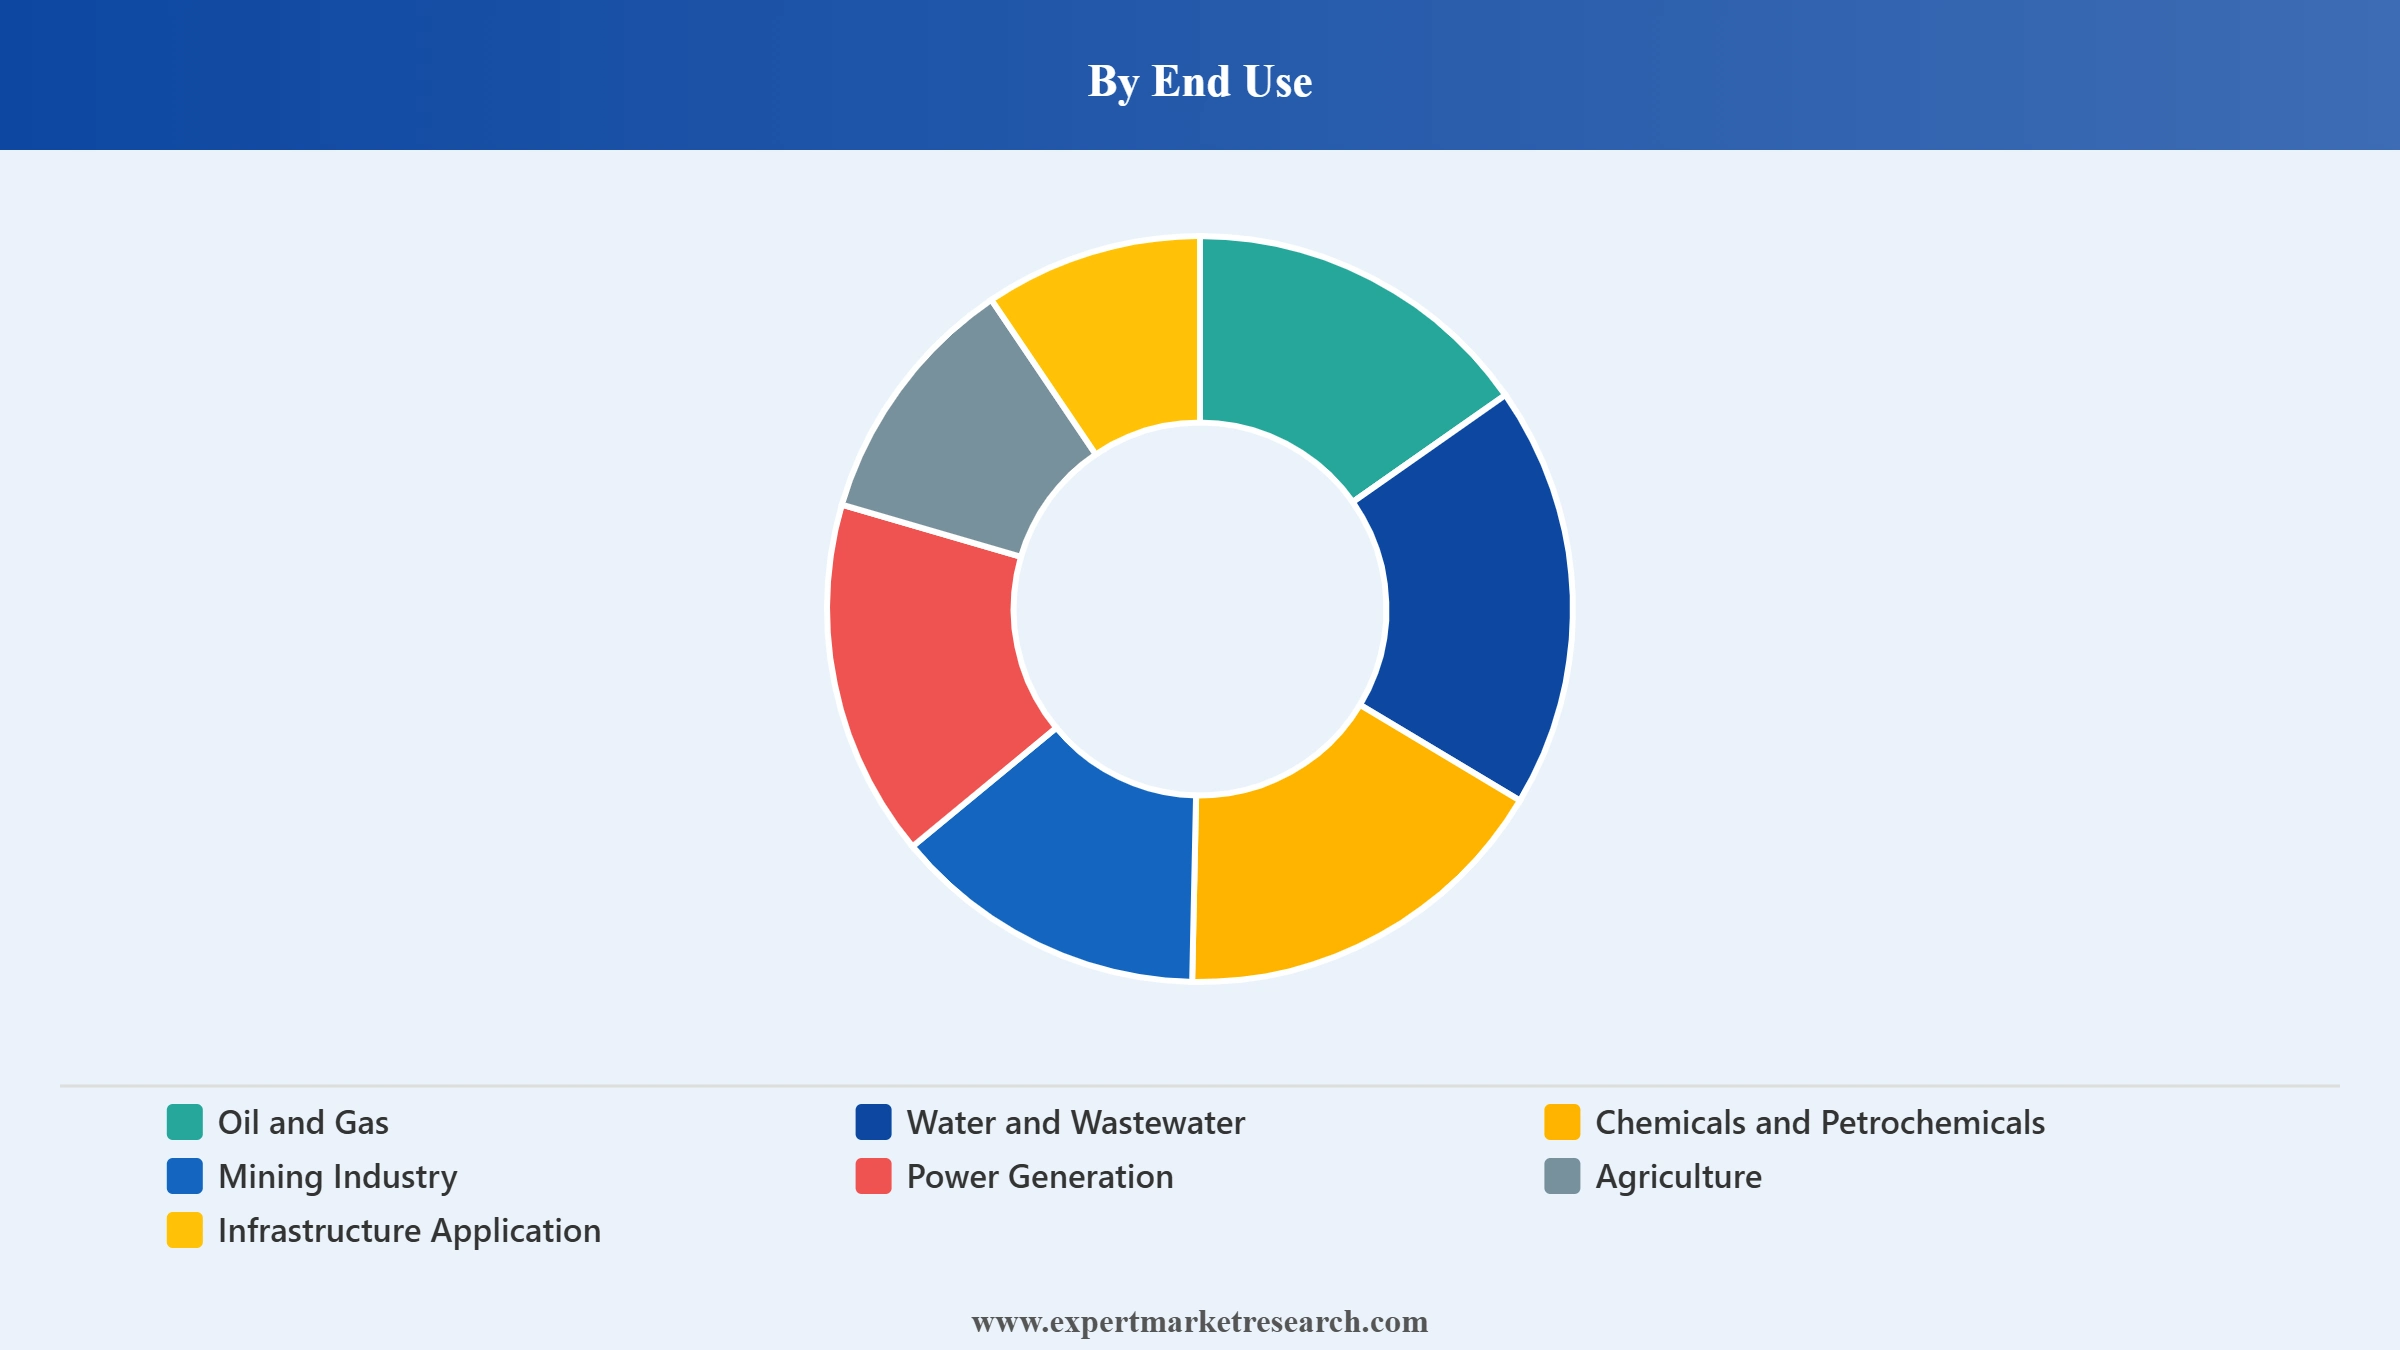
In the global pumps market, the agriculture sector plays a crucial role by driving demand for reliable and efficient pumping solutions. Pumps are essential for irrigation, livestock watering, and the transportation of agricultural chemicals. They enable farmers to optimise water usage, particularly in regions with scarce water resources, ensuring crops receive adequate hydration through advanced irrigation systems. Additionally, pumps are used for draining excess water from fields, improving crop yield and soil quality. With the increasing focus on sustainable farming, energy-efficient pumps are helping reduce operational costs while maintaining productivity. The growing demand for food, coupled with technological advancements in pump systems, supports the continued expansion of the agricultural sector in the global pumps market.
Read more about this report - REQUEST FREE SAMPLE COPY IN PDF
The water and wastewater treatment sector are a significant driver in the global pumps market, with pumps playing a vital role in maintaining clean water supply and efficient waste management. Pumps are integral in transporting water for municipal, industrial, and residential use, as well as in wastewater treatment plants, where they facilitate the movement of water and sewage through filtration and purification systems. With increasing global population and urbanisation, the need for advanced water management systems is rising. Pumps designed for energy efficiency and reliability contribute to reducing energy consumption and emissions. As regulations around water quality and wastewater treatment become stricter, demand for innovative and efficient pumps continues to grow, supporting sustainable water management practices worldwide.
The North American pumps market plays a pivotal role globally, driven by industrial applications in oil and gas, water and wastewater treatment, chemicals, agriculture, and power generation. The market's growth is supported by a rising focus on energy efficiency and sustainability, pushing the adoption of pumps with improved operational performance and reduced environmental impact. Technological innovations, such as digital control systems and IoT, are enhancing pump functionalities. Additionally, growing regulatory pressures related to water management and wastewater treatment are motivating industries to invest in eco-friendly, energy-efficient pump solutions, aligning with environmental goals.
The U.S. is the largest contributor to North America’s pumps market, supported by its diverse industrial base, including oil and gas, power generation, and chemicals. The U.S. is upgrading its aging water and wastewater infrastructure, driving the demand for advanced pumps. Regulatory standards, focusing on energy efficiency and environmental impacts, are prompting industries to adopt energy-efficient, low-emission pumps. Moreover, increasing concerns about water scarcity and pollution control are fuelling demand for innovative pumping solutions. The country is expected to maintain its growth trajectory as the government and industries prioritise sustainable water management practices.
Read more about this report - REQUEST FREE SAMPLE COPY IN PDF
Europe's pumps market is highly developed, influenced by industrial sectors like chemicals, pharmaceuticals, water treatment, and food and beverage. The market's growth is shaped by stringent environmental regulations and a focus on energy-efficient pumps. European countries, such as Germany, France, and the UK, lead pump consumption due to their industrial activities. Compliance with EU energy standards and the increasing demand for water and wastewater treatment systems are propelling market growth. The region is embracing sustainable technologies and innovations in pump design, addressing both operational efficiency and environmental impact.
Germany is a key player in the European pumps market, known for its advanced industrial base and commitment to technological innovation. The country’s manufacturing, automotive, chemicals, and energy sectors rely heavily on pumps. With a strong emphasis on energy efficiency and sustainability, Germany is leading the way in the development of eco-friendly pumping solutions. The renewable energy sector’s growth, including wind and solar power, is contributing to the rising demand for pumps in energy generation. Germany's focus on reducing environmental impact and enhancing operational efficiency continues to drive technological advancements in pump designs.
France’s pumps market is primarily driven by sectors like chemical manufacturing, food and beverage, energy generation, and water treatment. The country is a significant consumer of pumps, particularly for water management and treatment systems. As part of the EU, France must adhere to strict environmental standards, encouraging the adoption of energy-efficient and low-emission pumps. The focus on sustainability in the food and chemical industries is also boosting demand for pumps with advanced monitoring and control features. Regulatory pressures and the need for efficient resource management are accelerating the transition to eco-friendly pump technologies.
The Asia Pacific pumps market is rapidly expanding, driven by industrialisation, urbanisation, and increasing demand for water and wastewater treatment. Key markets include China, India, Japan, and South Korea. Infrastructure development projects, such as water treatment plants and irrigation systems, are fueling pump demand. Additionally, industrial sectors like chemicals, food processing, and power generation require pumps for fluid handling. Rising environmental concerns and the push for energy-efficient pumps are prompting innovation. As the region continues to grow, demand for sustainable and advanced pumping solutions is expected to rise across various industries.
China is one of the world’s largest markets for pumps, driven by its manufacturing, water treatment, and energy sectors. As China continues to urbanise and expand its infrastructure, there is a significant increase in the demand for pumps in water supply, irrigation, and wastewater treatment systems. The government is encouraging sustainable technologies, leading to greater demand for energy-efficient pumps. Additionally, China’s industrial sectors, particularly chemicals, mining, and manufacturing, rely heavily on pumps. Stricter environmental regulations are driving innovation in pump designs, pushing manufacturers to develop pumps that are both efficient and environmentally friendly.
India’s pumps market is growing rapidly, driven by the expansion of industrial sectors, agriculture, and urbanisation. Pumps are crucial in India for irrigation, water supply, and wastewater management, especially in rural areas. As agriculture remains a key part of India’s economy, the demand for irrigation pumps is significant. The government is investing in modernising the country’s water infrastructure, increasing demand for efficient pumping solutions. Rising industrial activities and growing environmental concerns are boosting the demand for energy-efficient and cost-effective pumps. India’s focus on sustainability and water management continues to drive the market’s growth.
Latin America’s pumps market is influenced by the oil and gas, mining, agriculture, and water treatment sectors. Countries like Brazil, Mexico, and Argentina are the largest consumers of pumps. The oil and gas industry is a major driver, with pumps essential in exploration, production, and transportation. The agriculture sector also plays a key role, with pumps used in irrigation systems. Urbanisation and population growth are driving the need for better water management and wastewater treatment systems, leading to increased pump demand. Latin American countries are increasingly adopting energy-efficient and eco-friendly pump solutions, boosting market growth.
Brazil is the largest pump market in Latin America, driven by oil and gas, agriculture, and water management needs. As one of the region’s top oil producers, Brazil’s oil and gas sector is a key consumer of pumps, particularly for offshore exploration and production. The agricultural sector, essential for the country’s economy, requires pumps for irrigation and water management. Brazil is also investing in its water and wastewater infrastructure, creating demand for high-performance pumps. The focus on sustainability and energy efficiency in Brazil is pushing the market toward more eco-friendly and technologically advanced pump solutions.
The Middle East and Africa (MEA) pumps market is growing, driven by key industries like oil and gas, water management, construction, and agriculture. The region’s oil and gas sector remains a dominant force, with pumps essential for fluid handling and transportation. Water scarcity, particularly in the Middle East, is driving investments in water desalination and wastewater treatment, creating significant demand for pumping systems. The region’s rapid urbanisation and infrastructure development are creating new opportunities for pump manufacturers, particularly in construction and water management. Energy-efficient and sustainable pump solutions are increasingly in demand.
Saudi Arabia’s pumps market is one of the largest in the Middle East, driven by the oil and gas sector, water desalination, and wastewater treatment. The country’s harsh desert climate and water scarcity issues make efficient water management critical. Pumps play a significant role in desalination plants, sewage treatment, and irrigation systems. Saudi Arabia’s Vision 2030 initiative, which focuses on economic diversification and environmental sustainability, is driving the demand for energy-efficient and eco-friendly pumps. Additionally, the oil and gas industry continue to fuel pump demand, with pumps being used in extraction, refining, and transportation processes.
In March 2025, KSB's MultiTec Plus high-pressure pump series was developed to transport drinking water with optimal hydraulic efficiency. It combined low energy consumption with flexibility in installation. Featuring synchronous reluctance motors, variable speed systems, and KSB Guard monitoring, the pumps ensured energy efficiency and reduced carbon footprint, with quiet operation and long service life.
In March 2025, Flowserve launched the INNOMAG® TB-MAG™ Dual Drive™ Pump, the world’s first sealless pump with true secondary containment. It featured double hermetic sealing and an independent containment system to prevent leaks and safeguard against hazardous chemical handling. The pump set a new safety standard with enhanced protection for chemical plant operations.
In March 2022, Ingersoll Rand, through Elmo Rietschle, launched the SVT Series of high-efficiency rotary screw vacuum pumps. Designed for industries like electronics and food & beverage, the pumps offer minimal power usage, no water requirements, and a compact design. The series provides significant energy savings, space optimisation, and reduced maintenance costs with intelligent, variable speed control.
In July 2021, Weir Minerals launched the Multiflo® Mudflo™ submersible slurry pump, designed for abrasive applications and large particle handling. It featured a hydraulically driven wet-end, Warman® MGS pump-end, Multiflo® CB32 hydraulic cutters, and ESCO® excavation teeth. The pump efficiently managed tailings, sludge ponds, and water retention dams, offering high wear resistance and clog prevention.
In September 2021, Pentair released a new range of energy-efficient commercial pumps for HVAC applications, exceeding U.S. DOE efficiency standards. These upgraded pumps, under the Pentair Aurora and Fairbanks Nijhuis brands, feature enhanced durability, higher pressure thresholds, and easier maintenance. The launch also includes an improved online tool for simplified pump selection and project management.
The global pumps market has experienced significant revenue growth, driven by industry trends and innovations across various sub-segments. At global, regional, and country levels, demand for pumps continues to rise due to expanding applications in industries such as manufacturing and water management. Market growth is also shaped by type, end use, and region-specific dynamics.
Type Outlook (Revenue, Billion, 2026-2035)
End Use Outlook (Revenue, Billion, 2026-2035)
Region Outlook (Revenue, Billion, 2026-2035)


Read more about this report - REQUEST FREE SAMPLE COPY IN PDF
Upto 15% Off
USD
$3999 $3599
$2499 $2249
$4999 $4249
$5999 $5099


*While we strive to always give you current and accurate information, the numbers depicted on the website are indicative and may differ from the actual numbers in the main report. At Expert Market Research, we aim to bring you the latest insights and trends in the market. Using our analyses and forecasts, stakeholders can understand the market dynamics, navigate challenges, and capitalize on opportunities to make data-driven strategic decisions.*
In 2025, the pumps market reached an approximate value of USD 76.12 Billion.
The market is expected to grow at a CAGR of 3.00% between 2026 and 2035.
The market is estimated to witness a healthy growth in the forecast period of 2026-2035 to reach USD 102.30 Billion by 2035.
The pumps commonly deployed at wastewater treatment plants include progressive cavity, centrifugal, and positive displacement pumps.
In mechanical pumps, the gas present in a vacuum system is moved from a low-pressure to a higher-pressure area. The pump must simultaneously provide a finite pumping speed and compression to be efficient.
The growing fluid handling needs across industries such as water and wastewater treatment, as well as chemical and power generation, have been driving the market. Additionally, regulatory compliance and technological innovations in pump technology, particularly for energy-efficient pumps, are further fueling market growth.
Key trends aiding market expansion include an expanding chemical manufacturing sector, rising demand for clean water, and growing demand for energy-efficient pumps.
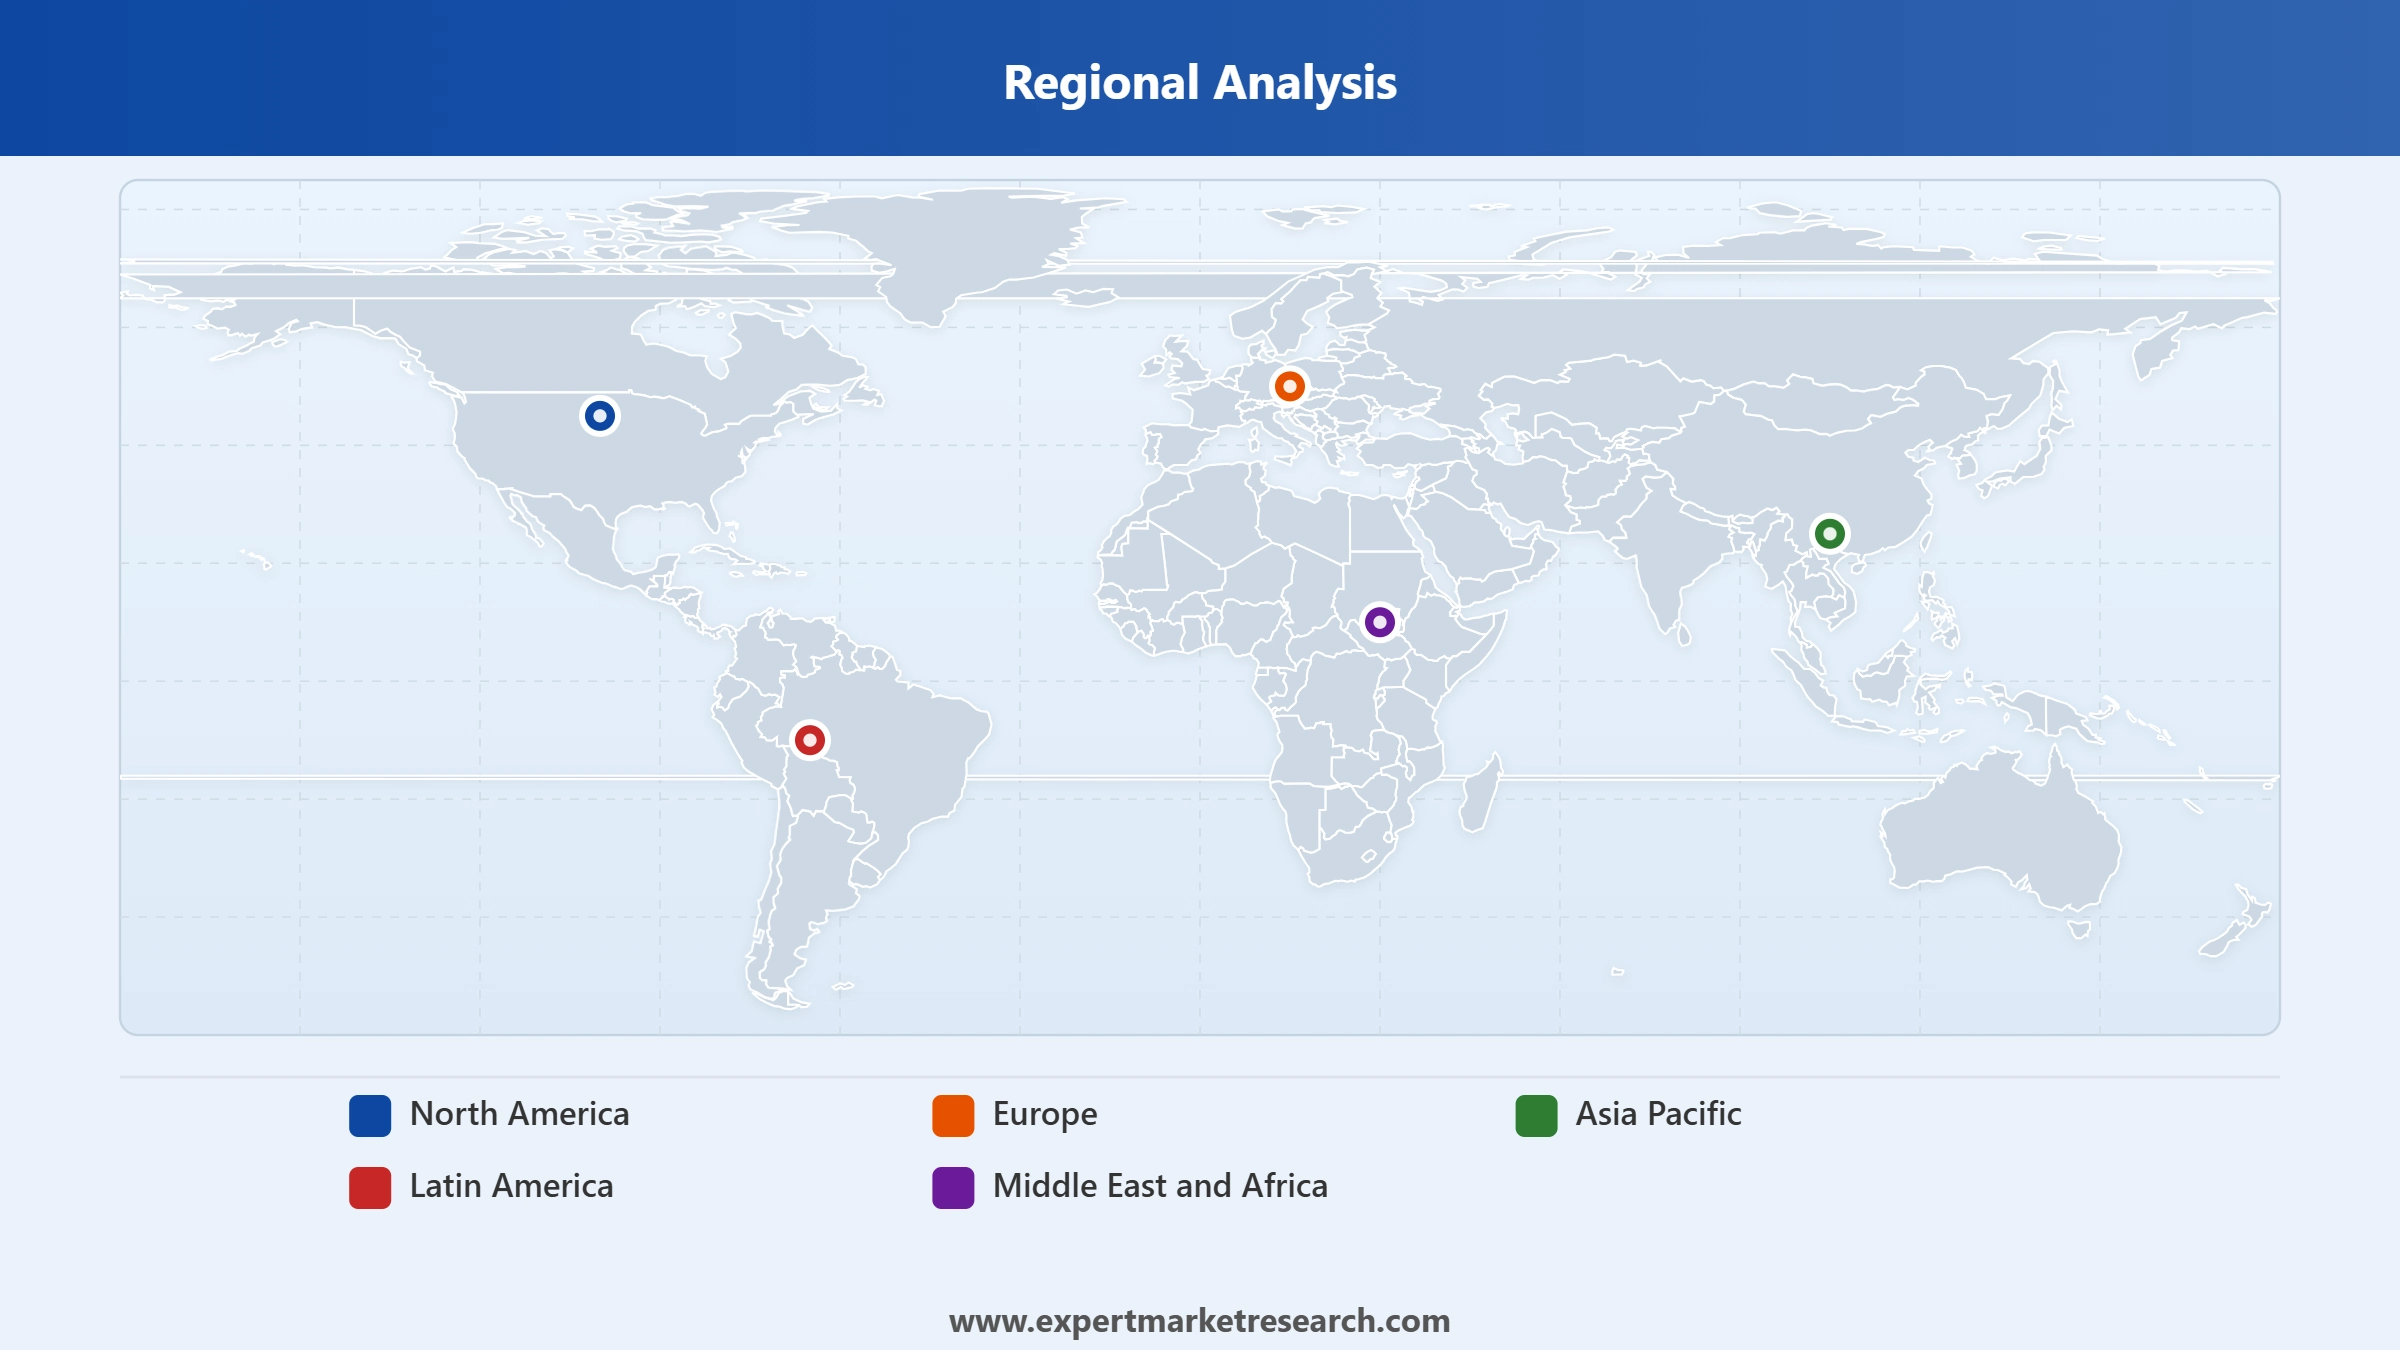
Major regions in the market are North America, Europe, Asia Pacific, Latin America, and Middle East and Africa.
The common types of pumps are centrifugal pumps, positive displacement pumps, and others.
The key players in the pumps market include Flowserve Corporation, Grundfos Holding A/S, KSB Limited, ITT Inc., Sulzer AG, Ebara Corporation, The Weir Group PLC, Schlumberger Limited, Baker Hughes Company, Dover Corporation, SLB, Ingersoll Rand, Vaughan Company, Pentair, Xylem, IWAKI CO., LTD., and SPX FLOW, Inc., among others.
The Asia Pacific region led the pump market due to increased growth and capital investment in end-use industries, including chemicals, power generation, agriculture, and water treatment.
Explore our key highlights of the report and gain a concise overview of key findings, trends, and actionable insights that will empower your strategic decisions.
| REPORT FEATURES | DETAILS |
| Base Year | 2025 |
| Historical Period | 2019-2025 |
| Forecast Period | 2026-2035 |
| Scope of the Report |
Historical and Forecast Trends, Industry Drivers and Constraints, Historical and Forecast Market Analysis by Segment:
|
| Breakup by Type |
|
| Breakup by End Use |
|
| Breakup by Region |
|
| Market Dynamics |
|
| Competitive Landscape |
|
| Companies Covered |
|
Single User License
One User
USD 3,999
USD 3,599
tax inclusive*
Datasheet
One User
USD 2,499
USD 2,249
tax inclusive*
Five User License
Five User
USD 4,999
USD 4,249
tax inclusive*
Corporate License
Unlimited Users
USD 5,999
USD 5,099
tax inclusive*
*Please note that the prices mentioned below are starting prices for each bundle type. Kindly contact our team for further details.*
Flash Bundle
Small Business Bundle
Growth Bundle
Enterprise Bundle
*Please note that the prices mentioned below are starting prices for each bundle type. Kindly contact our team for further details.*
Flash Bundle
Number of Reports: 3
20%
tax inclusive*
Small Business Bundle
Number of Reports: 5
25%
tax inclusive*
Growth Bundle
Number of Reports: 8
30%
tax inclusive*
Enterprise Bundle
Number of Reports: 10
35%
tax inclusive*
How To Order

Select License Type
Choose the right license for your needs and access rights.

Click on ‘Buy Now’
Add the report to your cart with one click and proceed to register.

Select Mode of Payment
Choose a payment option for a secure checkout. You will be redirected accordingly.
Strategic Solutions for Informed Decision-Making
Gain insights to stay ahead and seize opportunities.

Get insights & trends for a competitive edge.

Track prices with detailed trend reports.

Analyse trade data for supply chain insights.

Leverage cost reports for smart savings

Enhance supply chain with partnerships.

Connect For More Information
Our expert team of analysts will offer full support and resolve any queries regarding the report, before and after the purchase.
Our expert team of analysts will offer full support and resolve any queries regarding the report, before and after the purchase.
We employ meticulous research methods, blending advanced analytics and expert insights to deliver accurate, actionable industry intelligence, staying ahead of competitors.
Our skilled analysts offer unparalleled competitive advantage with detailed insights on current and emerging markets, ensuring your strategic edge.
We offer an in-depth yet simplified presentation of industry insights and analysis to meet your specific requirements effectively.


