

Consumer Insights
Uncover trends and behaviors shaping consumer choices today
Procurement Insights
Optimize your sourcing strategy with key market data
Industry Stats
Stay ahead with the latest trends and market analysis.
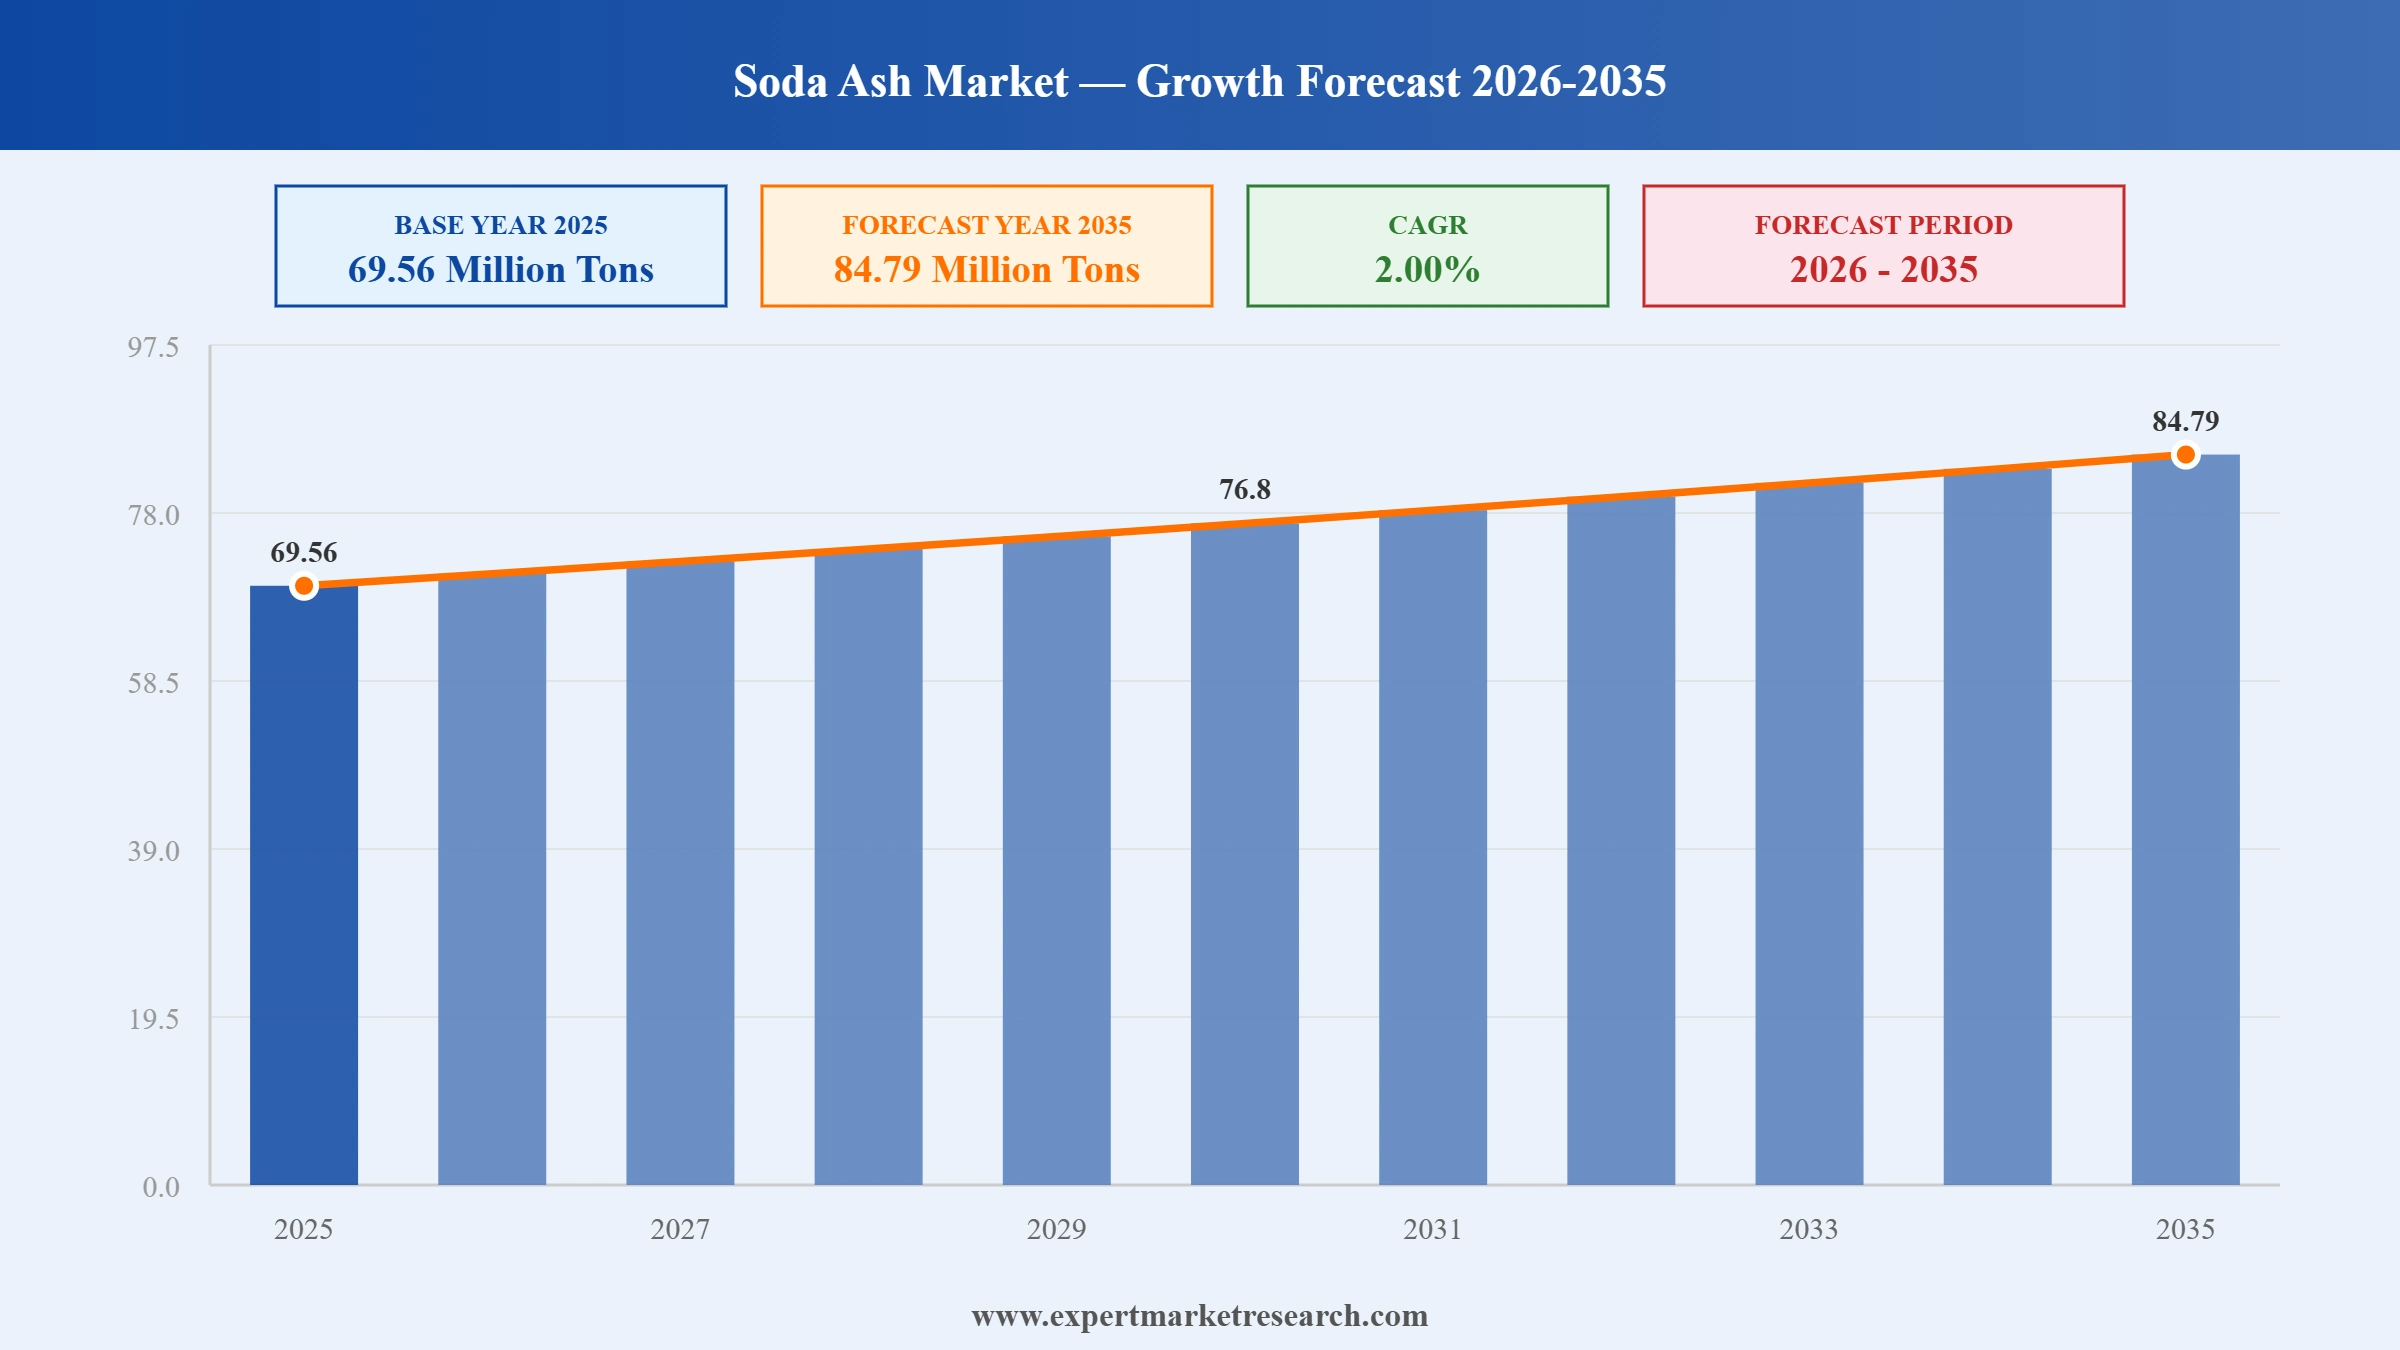
The global soda ash market stood at a production volume of 69.56 Million Tons at 2025 and is projected to grow at a compound annual growth rate (CAGR) of 2.00% during the forecast period of 2026-2035, reaching a volume of 84.79 Million Tons by 2035. Soda ash chemically known as sodium carbonate (Na₂CO₃) is one of the world's most important industrial chemicals, produced in volumes exceeding 68 million metric tonnes annually and serving as a foundational raw material across the glass, detergents, chemicals, paper, and water treatment industries. The soda ash market is a volume-driven commodity market characterised by modest growth rates reflecting the mature demand profile of its principal end-use applications in flat glass and container glass manufacturing, alongside newer growth vectors in lithium processing and water treatment.
The soda ash market is driven by the growing demand from the flourishing glass industry where soda ash plays a crucial role in glass production, with flat glass production consuming nearly 27% of soda ash produced globally. The construction industry's demand for flat glass used in windows, facades, solar panels, and automotive glazing provides the most consistent volume demand driver for soda ash globally. Container glass encompassing food and beverage glass packaging, pharmaceutical glass, and personal care glass represents the second-largest soda ash application, benefiting from growing consumer preference for sustainable glass packaging over plastic alternatives. Since 2010, global demand for soda ash has grown at approximately 3.5% per year while trade growth reached 4.3% per year, reflecting the geographic diversification of soda ash production toward lower-cost Trona-mining regions in the United States and new synthetic capacity in China and Turkey.
China and India are expected to be the leading markets for soda ash throughout the forecast period, with China's solar glass manufacturing expansion creating a sustained new demand driver alongside traditional flat and container glass production. The United States soda ash market benefits from the world's largest natural Trona deposits in the Green River Basin of Wyoming, which provide a significant cost advantage over synthetic Solvay process soda ash producers in Europe and Asia with North American soda ash pricing reflecting this competitive cost position even as it created price pressure in export markets in early 2026.
Read more about this report - REQUEST FREE SAMPLE COPY IN PDF
The global soda ash market is reshaped by China solar glass capacity additions, US trona based natural ash expansions, Indian brownfield capacity growth, and European decarbonisation upgrades. These shifts are recalibrating the global cost curve and trade flows for glass and chemicals customers.
The soda ash market forecast for H2 2026 reads soft, with the projected global price band at USD 0.23 to 0.24 per KG, down from the USD 0.25 per KG average maintained through most of 2025, as Chinese synthetic capacity additions continued to run ahead of glass demand recovery keeping Northeast Asian prices anchored at approximately USD 0.17 per KG.
European soda ash prices held firm at approximately USD 0.36 per KG through Q2 2026, maintaining a significant premium over Asian and North American benchmark prices reflecting the relatively higher production cost structure of European Solvay process producers and the limited import arbitrage available given shipping cost and logistics factors.
North American soda ash prices experienced their sharpest decline in the dataset dropping 11% to USD 0.17 per KG in Q1 2026 as US trona-based soda ash export competition intensified, with Wyoming producers facing increased pricing pressure from Chinese synthetic soda ash in key Asian export markets including Southeast Asia and India.
China soda ash market oversupply concerns intensified as new synthetic production capacity additions primarily Inner Mongolia and Shandong province expansions continued outpacing domestic flat glass and solar glass demand recovery, maintaining downward price pressure across Northeast Asian spot markets and complicating pricing negotiations for European and US producers seeking Asian market access.
Solar Glass Push: The global soda ash market is lifted by rapid solar PV cover glass capacity additions in China, with new float glass and solar glass lines requiring ample soda ash supply and forcing capacity expansions among Asia Pacific, US, and Indian producers.
Decarbonisation Push: Global soda ash market growth is shaped by decarbonisation of Solvay process synthetic soda ash, exemplified by Solvay Rosignano low carbon evaporative crystallisation upgrade and the planned NEOM carbon neutral plant in Saudi Arabia.
India Push: The global soda ash market benefits from Indian capacity expansions, with Tata Chemicals INR 910 crore approval for soda ash and silica capacity adding 50,000 tonnes per year of soda ash capacity over 27 months for glass, detergent, and chemicals customers.
US Push: The global soda ash market is aided by US Wyoming trona producers expanding rail and port logistics, with Ciner Wyoming extraction growth and optimised rail links boosting natural soda ash exports to Asia Pacific glass and detergent customers.
Demand Push: Global soda ash market growth is being anchored by sustained detergent, glass, chemicals, and metallurgy demand across global markets, supporting capacity expansions at Solvay, Ciner, Tata Chemicals, Sisecam, and other major producers worldwide.
The report of the Expert Market Research's titled "Global Soda Ash Market Report and Forecast 2026-2035" offers a detailed analysis of the market based on the following segments:
Market Breakup by Type
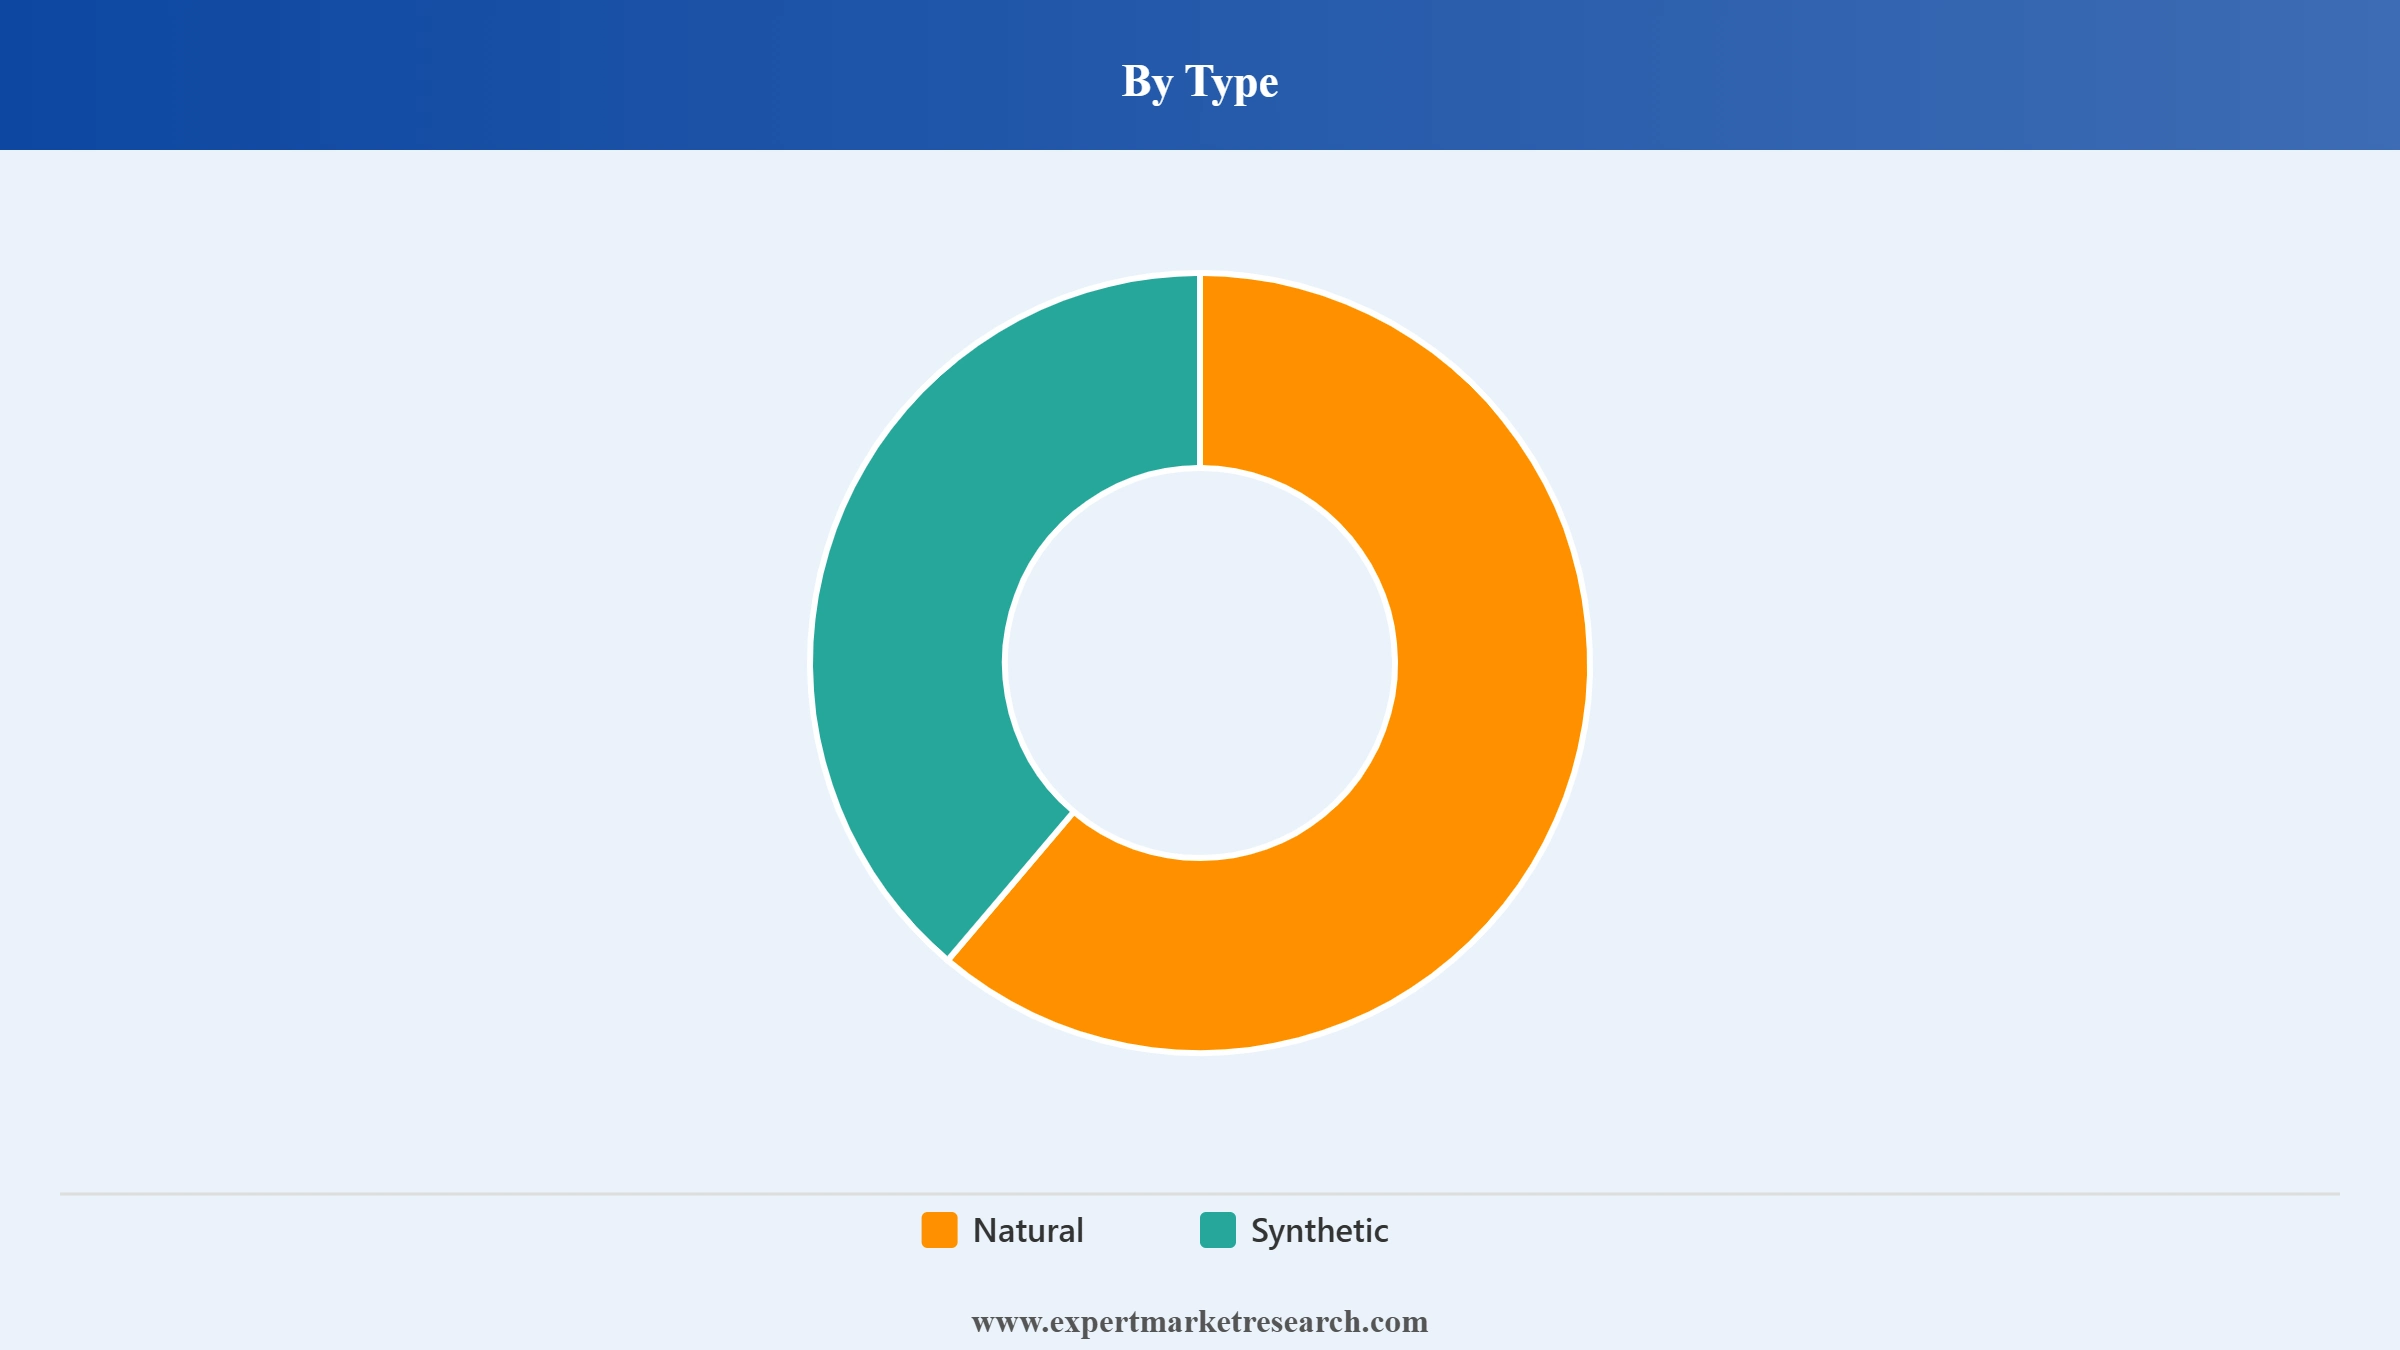
Key Insight: Synthetic soda ash dominates the type segment with broad global production through the Solvay process across Europe, China, India, and South America. Natural soda ash from trona reserves leads US output and is gaining share through Wyoming and Turkey expansions, aided by lower energy intensity and emerging low carbon credentials. Synthetic producers are responding through decarbonised evaporative crystallisation upgrades such as Solvay Rosignano and planned carbon neutral plants such as NEOM.
Market Breakup by Application
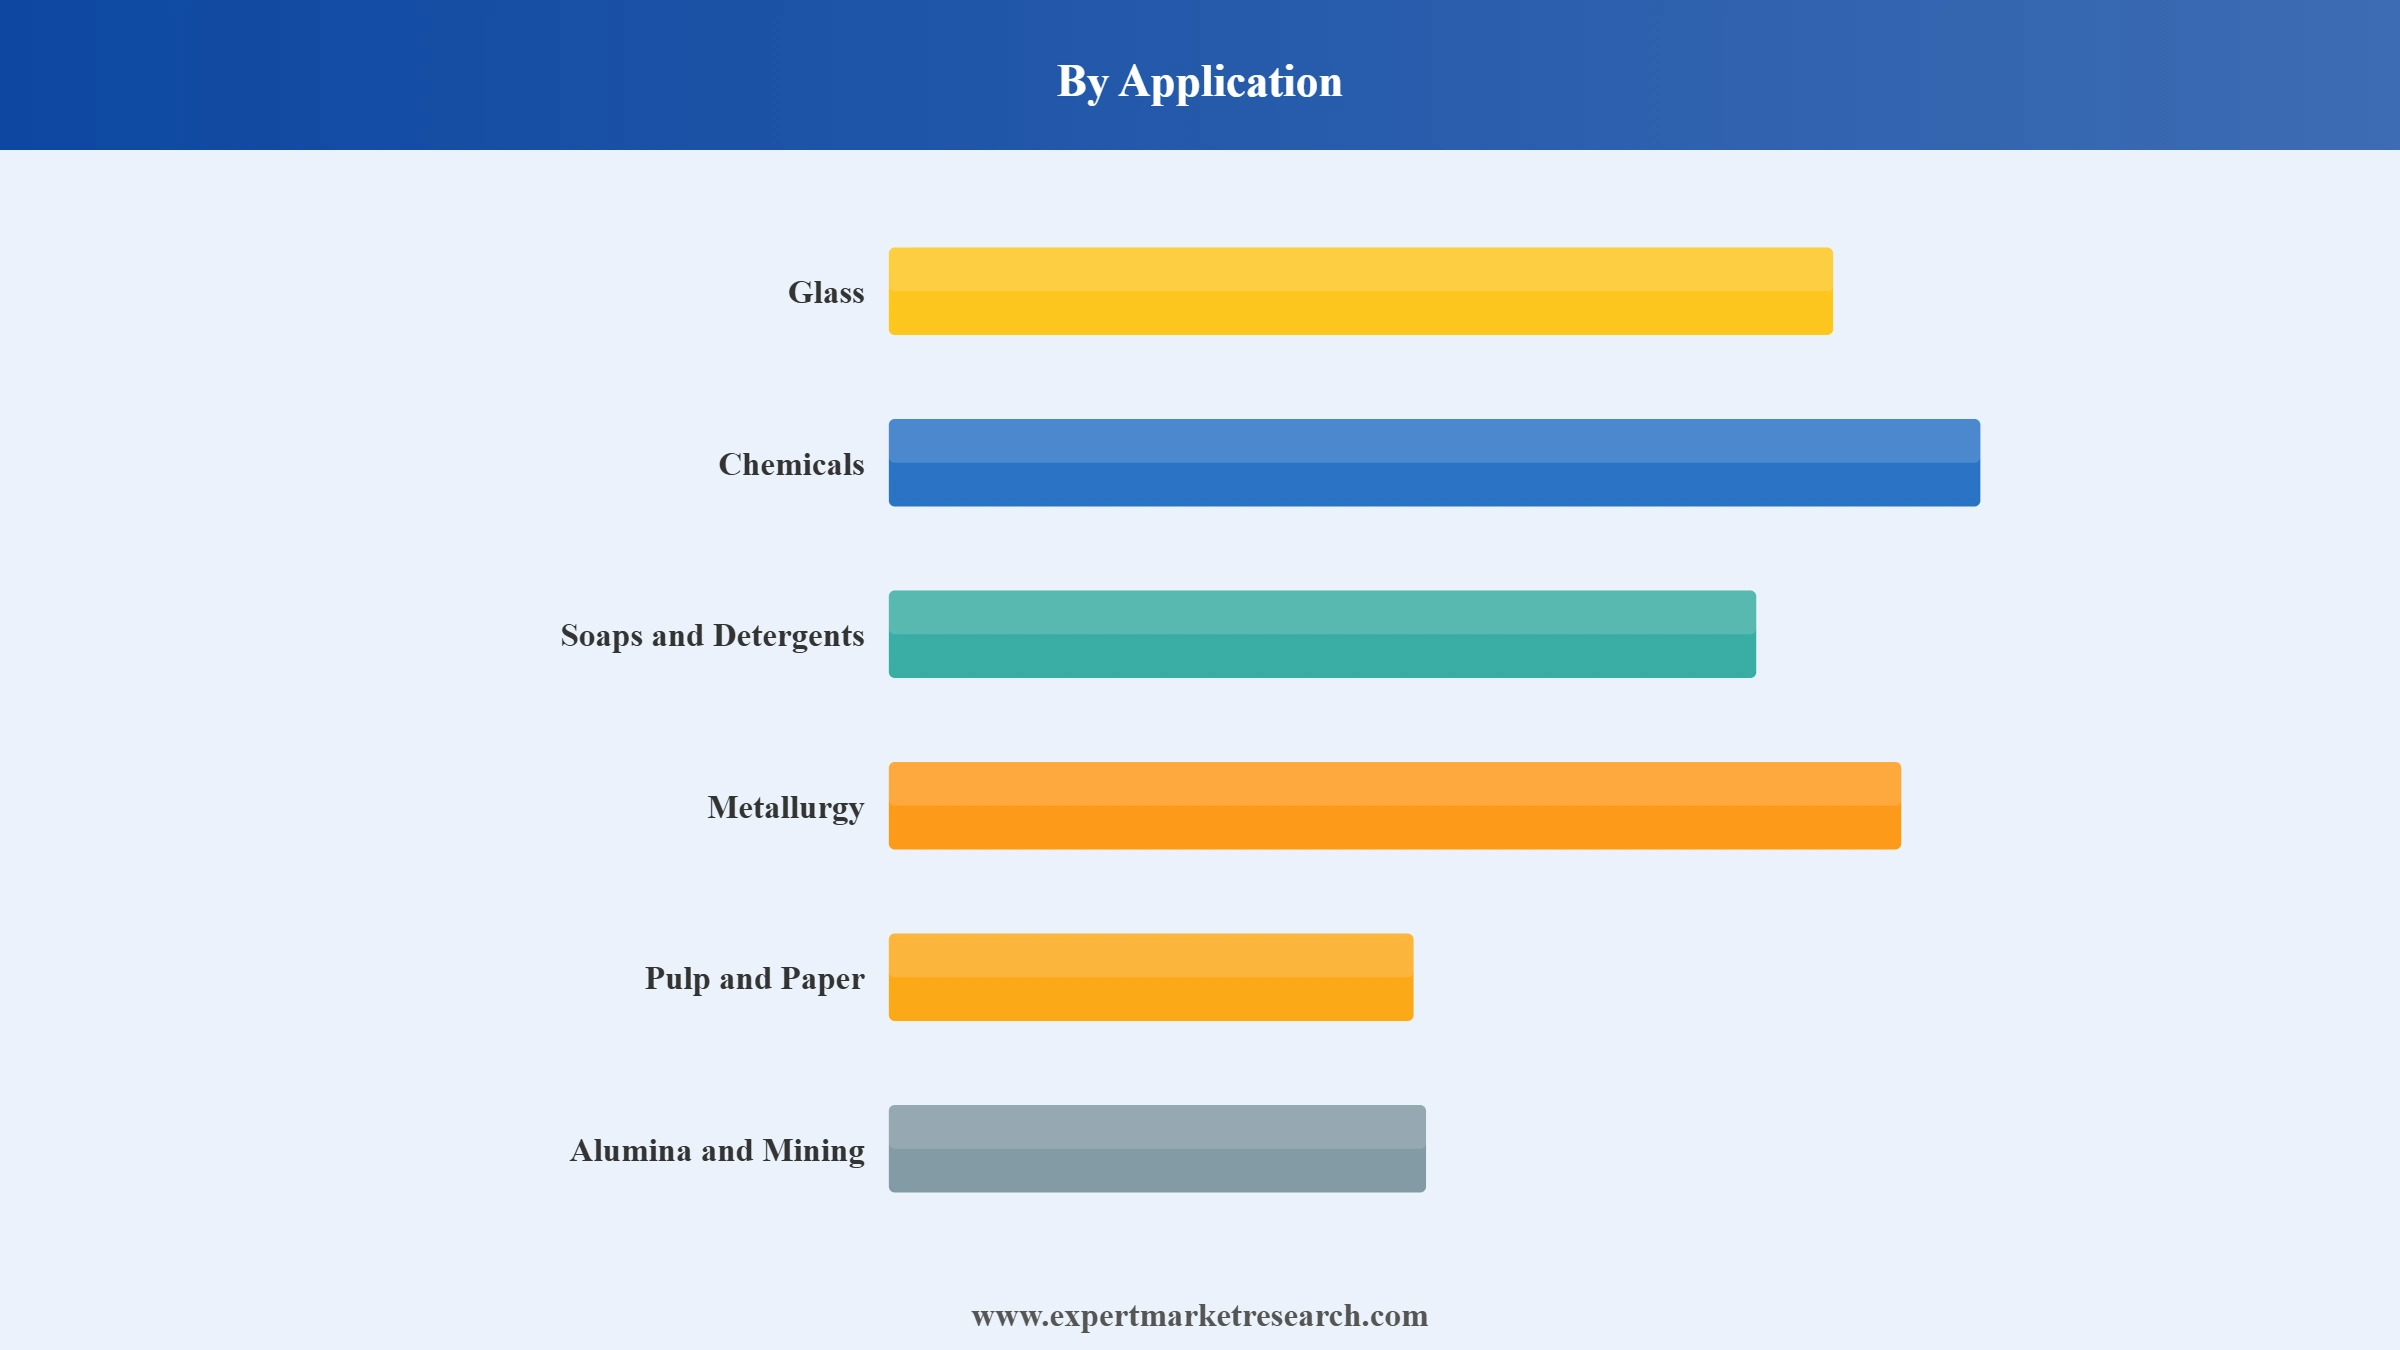
Key Insight: Glass dominates the application segment, anchored by container, float, and solar PV cover glass, with Chinese solar glass capacity additions accelerating demand. Soaps and detergents form the next worth noting pool with sustained mass household consumption. Chemicals applications including sodium silicate, sodium bicarbonate, and dyestuffs follow, while metallurgy, pulp and paper, alumina and mining round out the application pool. Solar PV glass is the fastest growing application driving capacity additions worldwide.
Market Breakup by Region
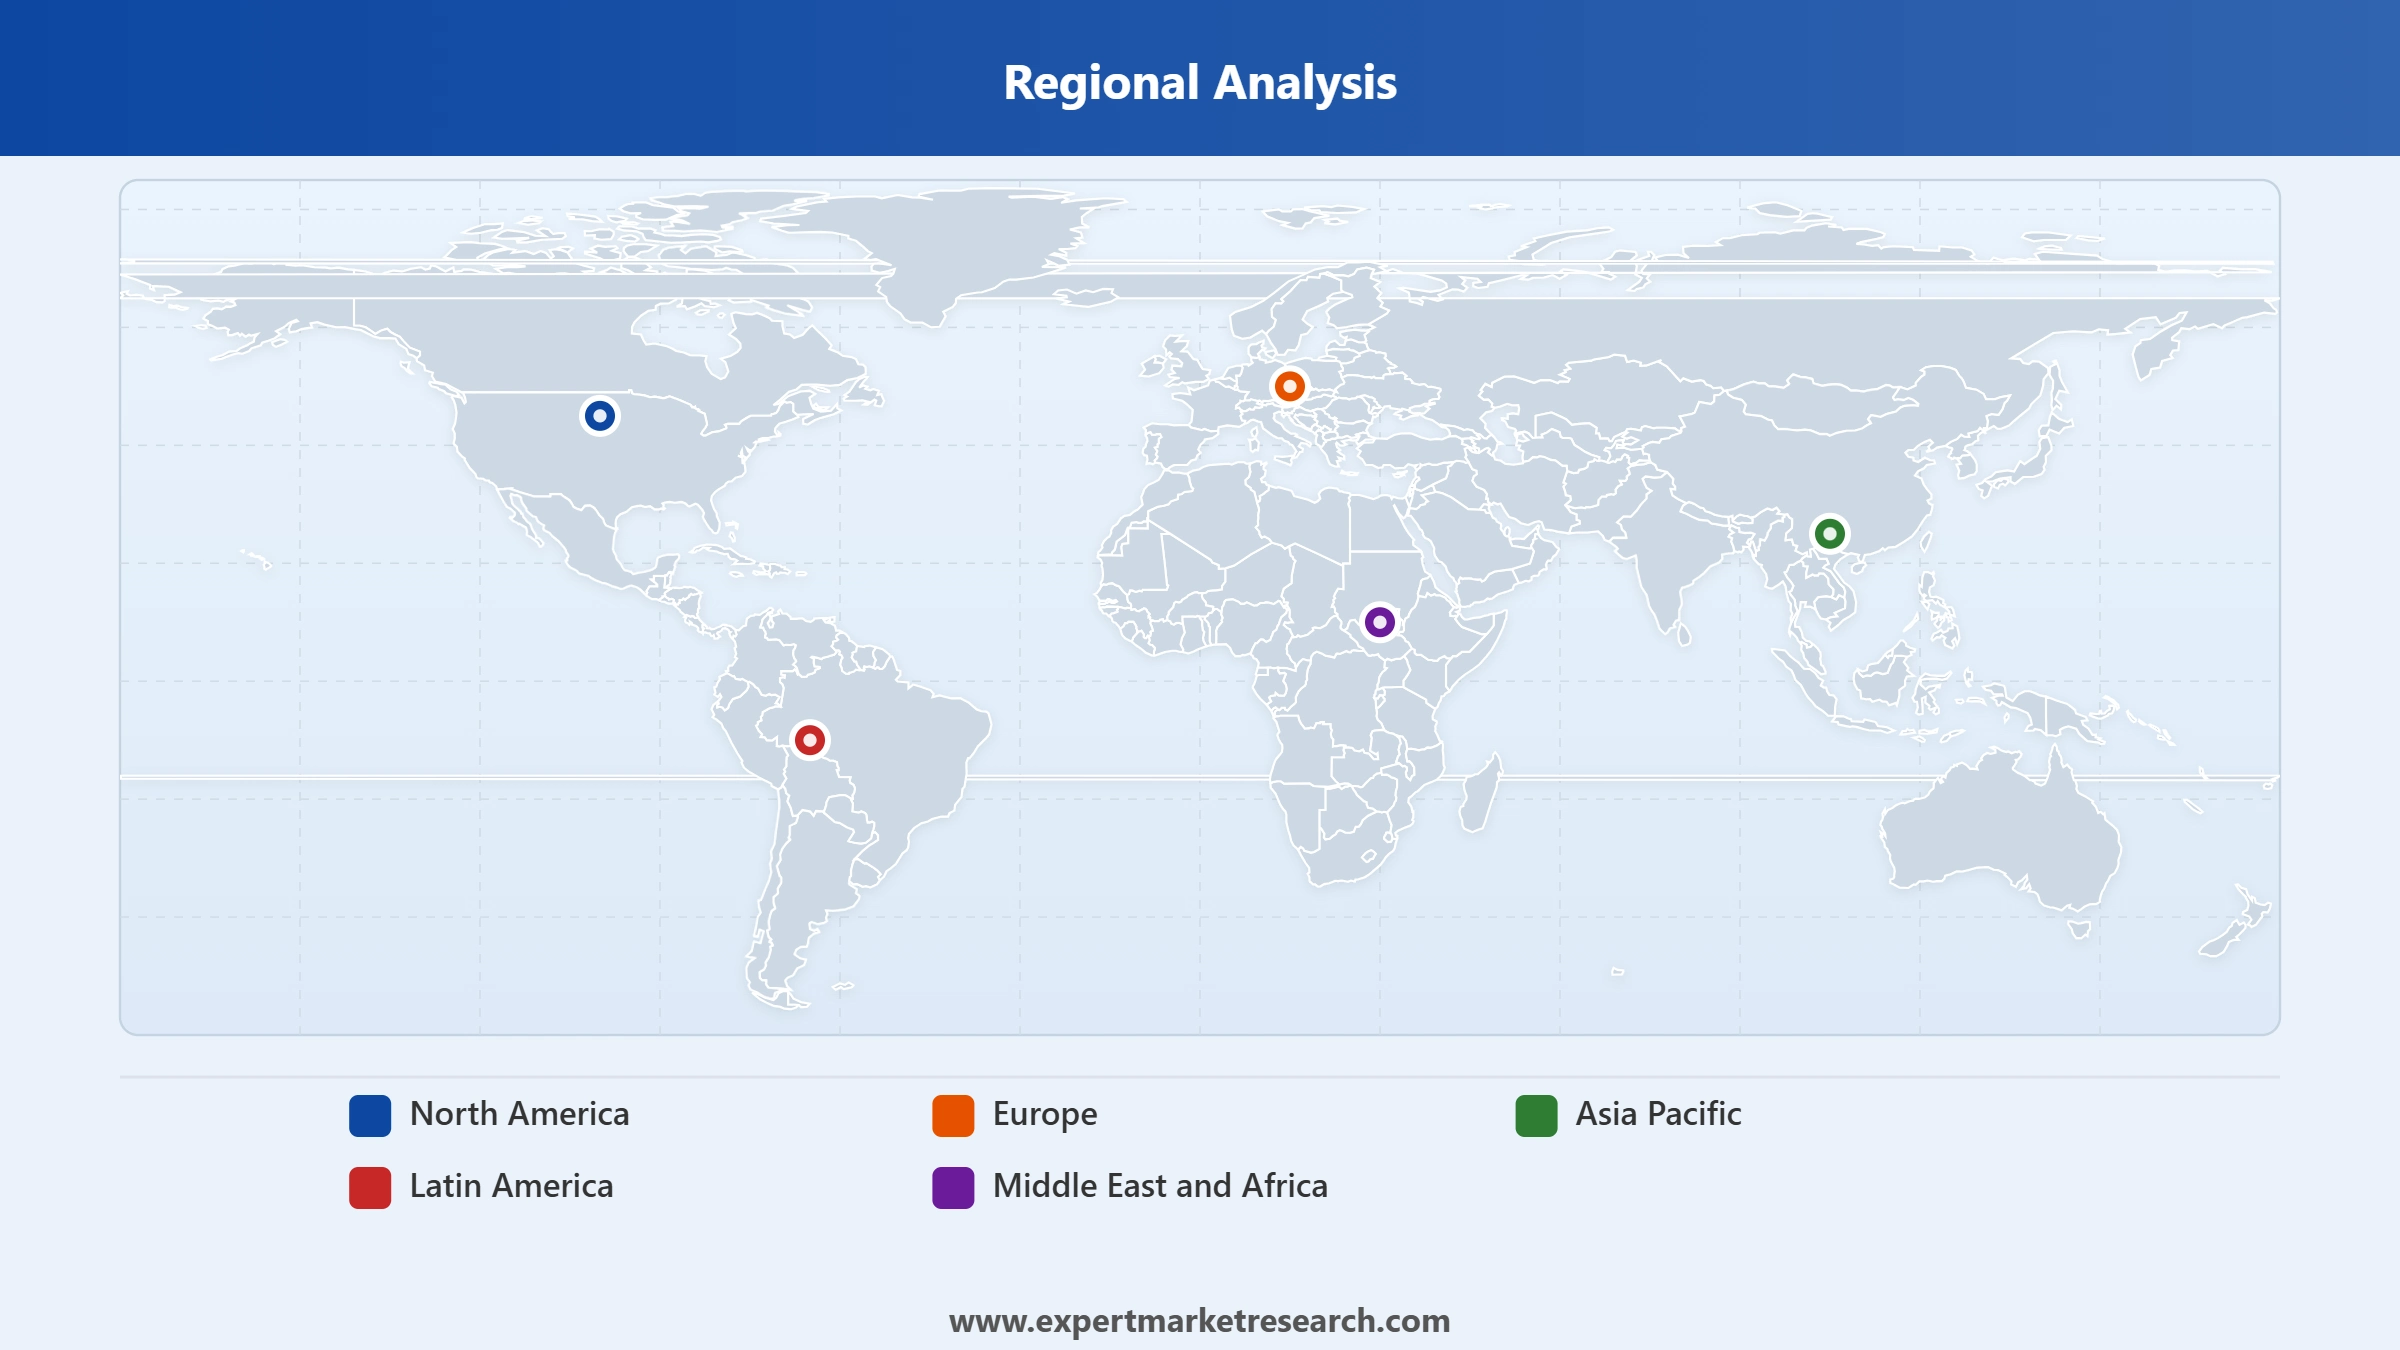
Key Insight: Asia Pacific dominates regional soda ash demand on the back of China solar and float glass capacity additions, Indian glass and detergent demand, and broad chemicals consumption. North America is the leading natural soda ash region with US Wyoming trona producers exporting to Asia. Europe contributes through decarbonised Solvay process production. Middle East and Africa are emerging on planned NEOM carbon neutral plant and Saudi and Egypt detergent and glass demand. Latin America is led by Brazil and Mexico chemicals and glass consumption.


Read more about this report - REQUEST FREE SAMPLE COPY IN PDF
By Type, Synthetic Soda Ash dominates the market due to global Solvay process production capacity
Synthetic soda ash leads the global soda ash market with broad global production capacity through the Solvay process anchored across China, Europe, India, and South America. The July 2025 Solvay Rosignano low carbon evaporative crystallisation upgrade and the planned carbon neutral NEOM plant illustrate the synthetic side decarbonisation pivot.
Natural soda ash from trona reserves leads US output and is gaining share through Wyoming and Turkey expansions, aided by lower energy intensity and emerging low carbon credentials. June 2025 Ciner Wyoming growth and rail logistics optimisation reinforce US natural ash supply to Asia Pacific glass and detergent customers, contributing to global soda ash market growth.
Read more about this report - REQUEST FREE SAMPLE COPY IN PDF
By Application, Glass accounts for the dominant share of the market due to solar, container, and float glass demand
Glass leads the global soda ash market with container, float, and solar PV cover glass demand anchoring consumption across Asia Pacific, North America, and Europe. Chinese solar PV cover glass capacity additions are forcing accelerated soda ash capacity growth, supporting the role of leading producers such as Tata Chemicals, Solvay, and Ciner in supplying glass customers.
Soaps and detergents form the next worth noting pool with mass household consumption, while chemicals, metallurgy, pulp and paper, and alumina and mining complete the application mix. March 2026 Tata Chemicals INR 910 crore approval for soda ash and silica capacity growth illustrates how Indian glass and detergent demand is supporting global soda ash market growth.
Read more about this report - REQUEST FREE SAMPLE COPY IN PDF
Asia Pacific dominates the market due to solar glass capacity additions and detergent demand
Asia Pacific leads the global soda ash market on the back of Chinese solar PV cover glass capacity additions, Indian glass and detergent consumption, and broad chemicals demand. Broadly speaking, march 2026 Tata Chemicals INR 910 crore growth approval illustrates how regional producers are scaling capacity to meet demand. China continues to anchor incremental glass and chemicals demand, while ASEAN is emerging on container and float glass.
North America is the largest natural soda ash region with US Wyoming trona producers exporting to Asia, aided by the June 2025 Ciner Wyoming growth and rail logistics optimisation. Europe contributes through decarbonised Solvay process production, exemplified by the July 2025 Solvay Rosignano upgrade. Middle East and Africa are emerging on the planned NEOM carbon neutral plant and Saudi and Egypt glass and detergent demand, contributing to global soda ash market growth.
Read more about this report - REQUEST FREE SAMPLE COPY IN PDF
The global soda ash market is moderately consolidated with global Solvay process producers, US trona based natural ash producers, Turkish and Chinese majors, and Indian brownfield expansions competing across glass, detergent, chemicals, metallurgy, pulp and paper, and alumina applications.
Companies are differentiating through low carbon and carbon neutral production, capacity expansions, and logistics optimisation. Strategic moves include the March 2026 Tata Chemicals INR 910 crore growth, July 2025 Solvay Rosignano low carbon upgrade, July 2025 Solvay ENOWA carbon neutral NEOM partnership, and June 2025 Ciner Wyoming spread and rail link.
Founded in 1978 and headquartered in Istanbul, Turkey, the company is one of the largest natural soda ash producers globally with operations in Turkey and the United States. Its Wyoming based US operations use trona reserves and rail logistics to supply natural soda ash to glass, detergent, and chemicals customers across Asia Pacific and Latin America.
Founded in 1935 and headquartered in Istanbul, Turkey, the company is a leading integrated glass and chemicals producer with major natural soda ash output from Turkish trona reserves. Its operations support glass, detergent, and chemicals customers across Europe, Asia Pacific, and the Middle East and Africa.
Founded in 1863 and headquartered in Brussels, Belgium, the company is a leading global chemicals and advanced materials supplier with worth noting Solvay process synthetic soda ash production. Its plants are located in Europe and the Americas, with recent decarbonisation moves at the Rosignano Italy plant and the planned NEOM Saudi Arabia carbon neutral facility.
Founded in 1989 and headquartered in Weifang, Shandong, China, the company is a major Chinese soda ash producer using both synthetic and natural processes. Its operations support solar glass, float glass, container glass, and detergent customers across China and exports to Asia Pacific markets, with capacity expansions linked to Chinese solar PV cover glass growth.
Other leading companies in the market are Tata Chemicals Ltd., NIRMA, DCW Ltd., Genesis Energy, L.P., Kushal Chemicals, and Others.
*Please note that this is only a partial list; the complete list of key players is available in the full report. Additionally, the list of key players can be customized to better suit your needs.*
Discover the latest insights on the global soda ash market 2026 with our comprehensive report. Stay ahead of the curve with valuable data on product innovations, consumer demand, and top growth regions. Whether you are launching a new product or expanding your brand, this report gives you the clarity you need. Download your free sample now and discover the key opportunities in the thriving Global Soda Ash.
Upto 15% Off
USD
$2499 $2249
$3999 $3599
$4999 $4249
$5999 $5099


*While we strive to always give you current and accurate information, the numbers depicted on the website are indicative and may differ from the actual numbers in the main report. At Expert Market Research, we aim to bring you the latest insights and trends in the market. Using our analyses and forecasts, stakeholders can understand the market dynamics, navigate challenges, and capitalize on opportunities to make data-driven strategic decisions.*
In 2025, the market reached an approximate volume of 69.56 Million Tons.
The market is projected to grow at a CAGR of 2.00% between 2026 and 2035.
The market is estimated to witness healthy growth in the forecast period of 2026-2035 to reach a volume of around 84.79 Million Tons by 2035.
The soda ash market is driven by several key factors, including the growing demand from the flourishing glass industry, where soda ash plays a crucial role in glass production.
The adoption of glass packaging solutions in industries, such as pharmaceutical, food and beverage, and personal care industries are expected to define the market growth in the coming years.
China and India are expected to be the leading markets for the product in the forecast period. North America, Europe, the Asia Pacific, Latin America, and the Middle East and Africa are the major regions in the market.
The leading types of soda ash are natural and synthetic.
The major application segments for the market include glass, chemicals, soaps and detergents, metallurgy, and pulp and paper, among others.
The major players in the market are Ciner, Sisecam Group, Solvay, Shandong Haihua Group, Tata Chemicals Ltd., NIRMA, DCW Ltd., Genesis Energy, L.P., Kushal Chemicals, Angel Chemicals Private Limited, Radhe Enterprise, and Tuticorin Alkali Chemicals and Fertilizers Limited (TFL), among others.
The Asia Pacific region held the major share of soda ash capacities, representing around 50% of the global production capacity.
Glass manufacturing held the highest share of the market.
Asia Pacific held the largest share in the global market in 2025.
Product adoption in the market is anticipated to be driven by rising demand in the glass production industry as well as expanding use in water treatment applications.
Explore our key highlights of the report and gain a concise overview of key findings, trends, and actionable insights that will empower your strategic decisions.
| Report Features | Details |
| Base Year | 2025 |
| Historical Period | 2019-2025 |
| Forecast Period | 2026-2035 |
| Scope of the Report |
Historical and Forecast Trends, Industry Drivers and Constraints, Historical and Forecast Market Analysis by Segment:
|
| Breakup by Type |
|
| Breakup by Application |
|
| Breakup by Region |
|
| Market Dynamics |
|
| Competitive Landscape |
|
| Companies Covered |
|
| Report Price and Purchase Option | Explore our purchase options that are best suited to your resources and industry needs. |
| Delivery Format | Delivered as an attached PDF and Excel through email, with an option of receiving an editable PPT, according to the purchase option. |
Datasheet
One User
USD 2,499
USD 2,249
tax inclusive*
Single User License
One User
USD 3,999
USD 3,599
tax inclusive*
Five User License
Five User
USD 4,999
USD 4,249
tax inclusive*
Corporate License
Unlimited Users
USD 5,999
USD 5,099
tax inclusive*
*Please note that the prices mentioned below are starting prices for each bundle type. Kindly contact our team for further details.*
Flash Bundle
Small Business Bundle
Growth Bundle
Enterprise Bundle
*Please note that the prices mentioned below are starting prices for each bundle type. Kindly contact our team for further details.*
Flash Bundle
Number of Reports: 3
20%
tax inclusive*
Small Business Bundle
Number of Reports: 5
25%
tax inclusive*
Growth Bundle
Number of Reports: 8
30%
tax inclusive*
Enterprise Bundle
Number of Reports: 10
35%
tax inclusive*
How To Order

Select License Type
Choose the right license for your needs and access rights.

Click on ‘Buy Now’
Add the report to your cart with one click and proceed to register.

Select Mode of Payment
Choose a payment option for a secure checkout. You will be redirected accordingly.
Strategic Solutions for Informed Decision-Making
Gain insights to stay ahead and seize opportunities.

Get insights & trends for a competitive edge.

Track prices with detailed trend reports.

Analyse trade data for supply chain insights.

Leverage cost reports for smart savings

Enhance supply chain with partnerships.

Connect For More Information
Our expert team of analysts will offer full support and resolve any queries regarding the report, before and after the purchase.
Our expert team of analysts will offer full support and resolve any queries regarding the report, before and after the purchase.
We employ meticulous research methods, blending advanced analytics and expert insights to deliver accurate, actionable industry intelligence, staying ahead of competitors.
Our skilled analysts offer unparalleled competitive advantage with detailed insights on current and emerging markets, ensuring your strategic edge.
We offer an in-depth yet simplified presentation of industry insights and analysis to meet your specific requirements effectively.


