

Consumer Insights
Uncover trends and behaviors shaping consumer choices today
Procurement Insights
Optimize your sourcing strategy with key market data
Industry Stats
Stay ahead with the latest trends and market analysis.
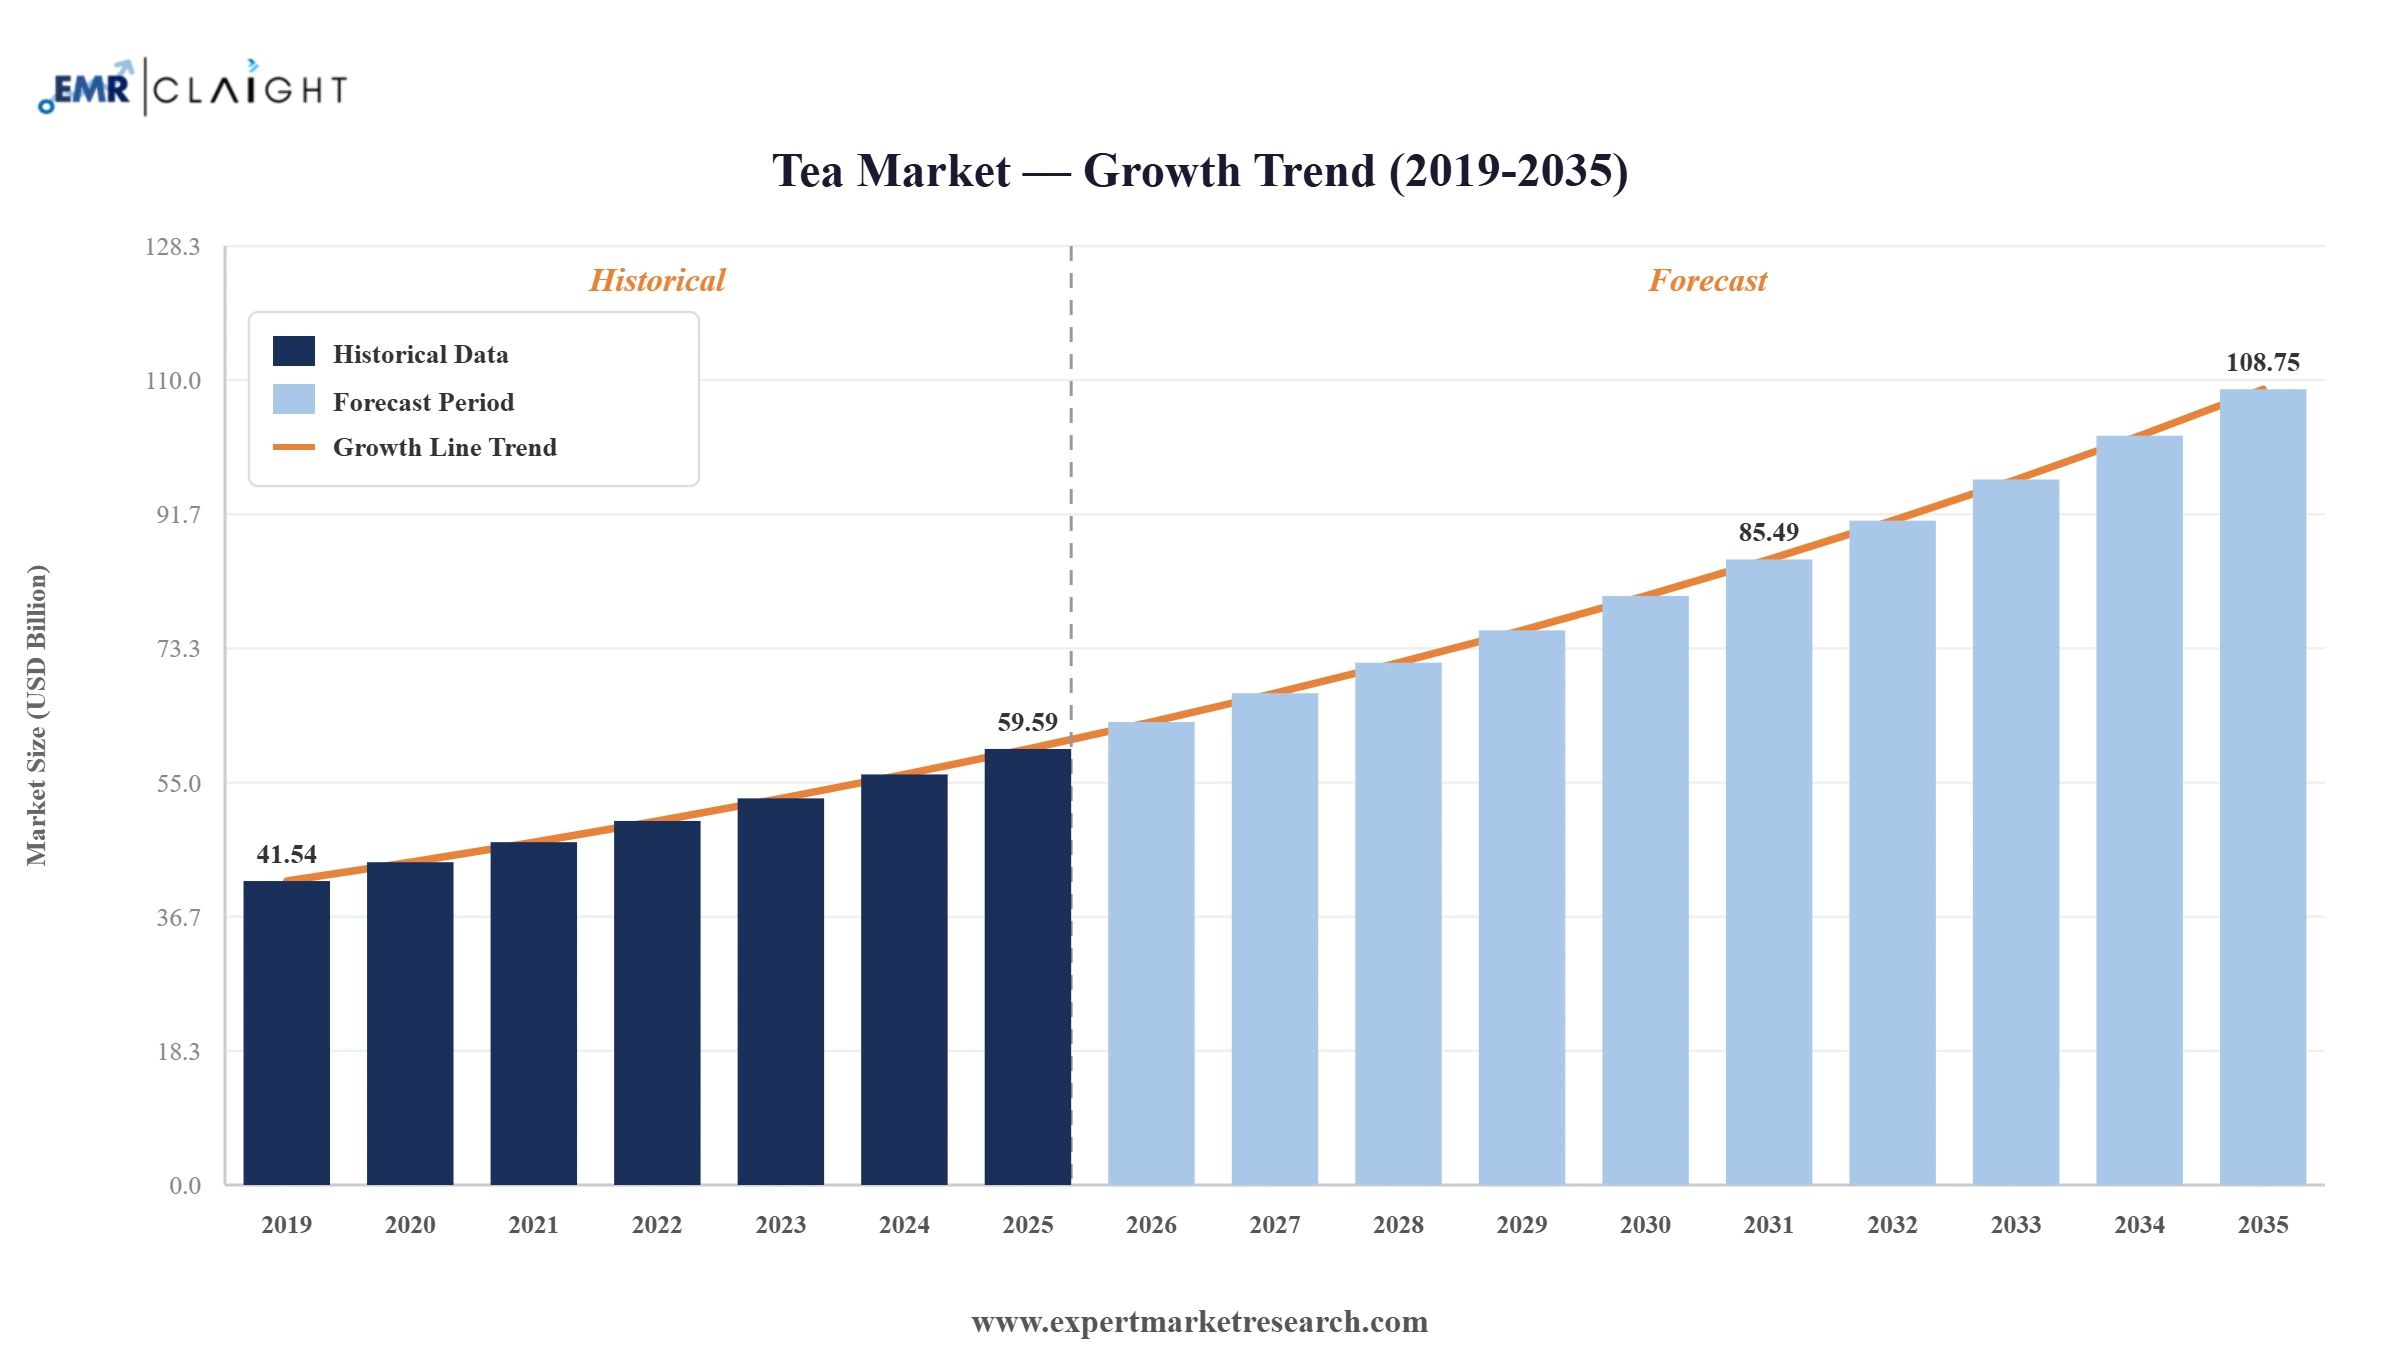
The global tea market reached a value of USD 59.59 Billion at 2025 and is projected to expand at a CAGR of around 6.20% during the forecast period of 2026-2035. With rising health and wellness consumption, premium green and specialty tea expansion, growing on the go ready to drink and bubble tea formats, and accelerating sustainability and traceability commitments by global tea brands, the market is expected to reach USD 108.75 Billion by 2035.
Read more about this report - REQUEST FREE SAMPLE
| Global Tea Market Report Summary | Description | Value |
| Base Year | USD Billion | 2025 |
| Historical Period | USD Billion | 2019-2025 |
| Forecast Period | USD Billion | 2026-2035 |
| Market Size 2025 | USD Billion | 59.59 |
| Market Size 2035 | USD Billion | 108.75 |
| CAGR 2019-2025 | Percentage | XX% |
| CAGR 2026-2035 | Percentage | 6.20% |
| CAGR 2026-2035 - Market by Region | Asia Pacific | 7.1% |
| CAGR 2026-2035 - Market by Country | India | 8.2% |
| CAGR 2026-2035 - Market by Country | China | 6.8% |
| CAGR 2026-2035 - Market by Application | Commercial | 6.6% |
| CAGR 2026-2035 - Market by Distribution Channel | Online | 9.2% |
| Market Share by Country 2025 | Germany | 4.6% |
The global tea market is reshaped by traceability platforms, sustainable plantation partnerships, plant based and compostable tea bags, and rapid premium and specialty tea adoption. These shifts are pulling specifications toward organic, traceable, and craft tea formats across retail and on trade.
Tata Consumer Products Limited launched a digital traceability platform for its Tetley teas, enabling provenance verification from plantation to cup and reinforcing premium positioning across global retail and on trade channels for branded black, green, and specialty tea SKUs.
Unilever Plc launched a new line of plant based, compostable tea bags under its Lipton brand, supporting sustainability commitments and addressing plastic free packaging demand across European, North American, and Asia Pacific modern retail channels.
Lipton Teas and Infusions partnered with Browns Investments to focus on sustainable tea cultivation, improving farmer livelihoods, and enhancing eco friendly production methods, reinforcing the broader industry pivot toward sustainable plantation partnerships and traceable supply.
Major tea brands including Yorkshire Tea, Twinings, Tetley, Clipper, and PG Tips became the first to publish supplier lists, suggesting a structural move toward supply chain transparency and traceability across global tea brand portfolios and supporting modern retail trust frameworks.
Traceability Push: The global tea market is reshaped by traceability platforms and supplier list publications, with Tata Consumer Tetley digital traceability and Twinings, Tetley, Clipper, and PG Tips supplier transparency suggesting a structural shift in global tea sourcing.
Sustainability Push: Global tea market growth is shaped by plant based and compostable tea bags, with Unilever Lipton plant based bag launches addressing plastic free packaging demand and supporting brand sustainability commitments across global modern retail channels.
Premium Push: The global tea market benefits from premium green, oolong, white, and specialty tea SKU growth, with global and regional brands launching single origin, organic, and craft assortments across modern retail, specialty stores, and on trade hospitality channels.
Bubble Tea Push: The global tea market is lifted by bubble tea franchises, ready to drink iced and matcha tea SKUs, and cold brew tea launches, with Asia Pacific and North America metro markets anchoring on the go consumption and cafe channel growth.
Plantation Push: Global tea market growth is aided by sustainable plantation partnerships, with Lipton Teas and Infusions Browns Investments collaboration anchoring eco friendly cultivation, farmer livelihoods, and tea production sustainability across Sri Lanka and other origins.
The report of the Expert Market Research's titled "Global Tea Market Report and Forecast 2026-2035" offers a detailed analysis of the market based on the following segments:
Market Breakup by Source
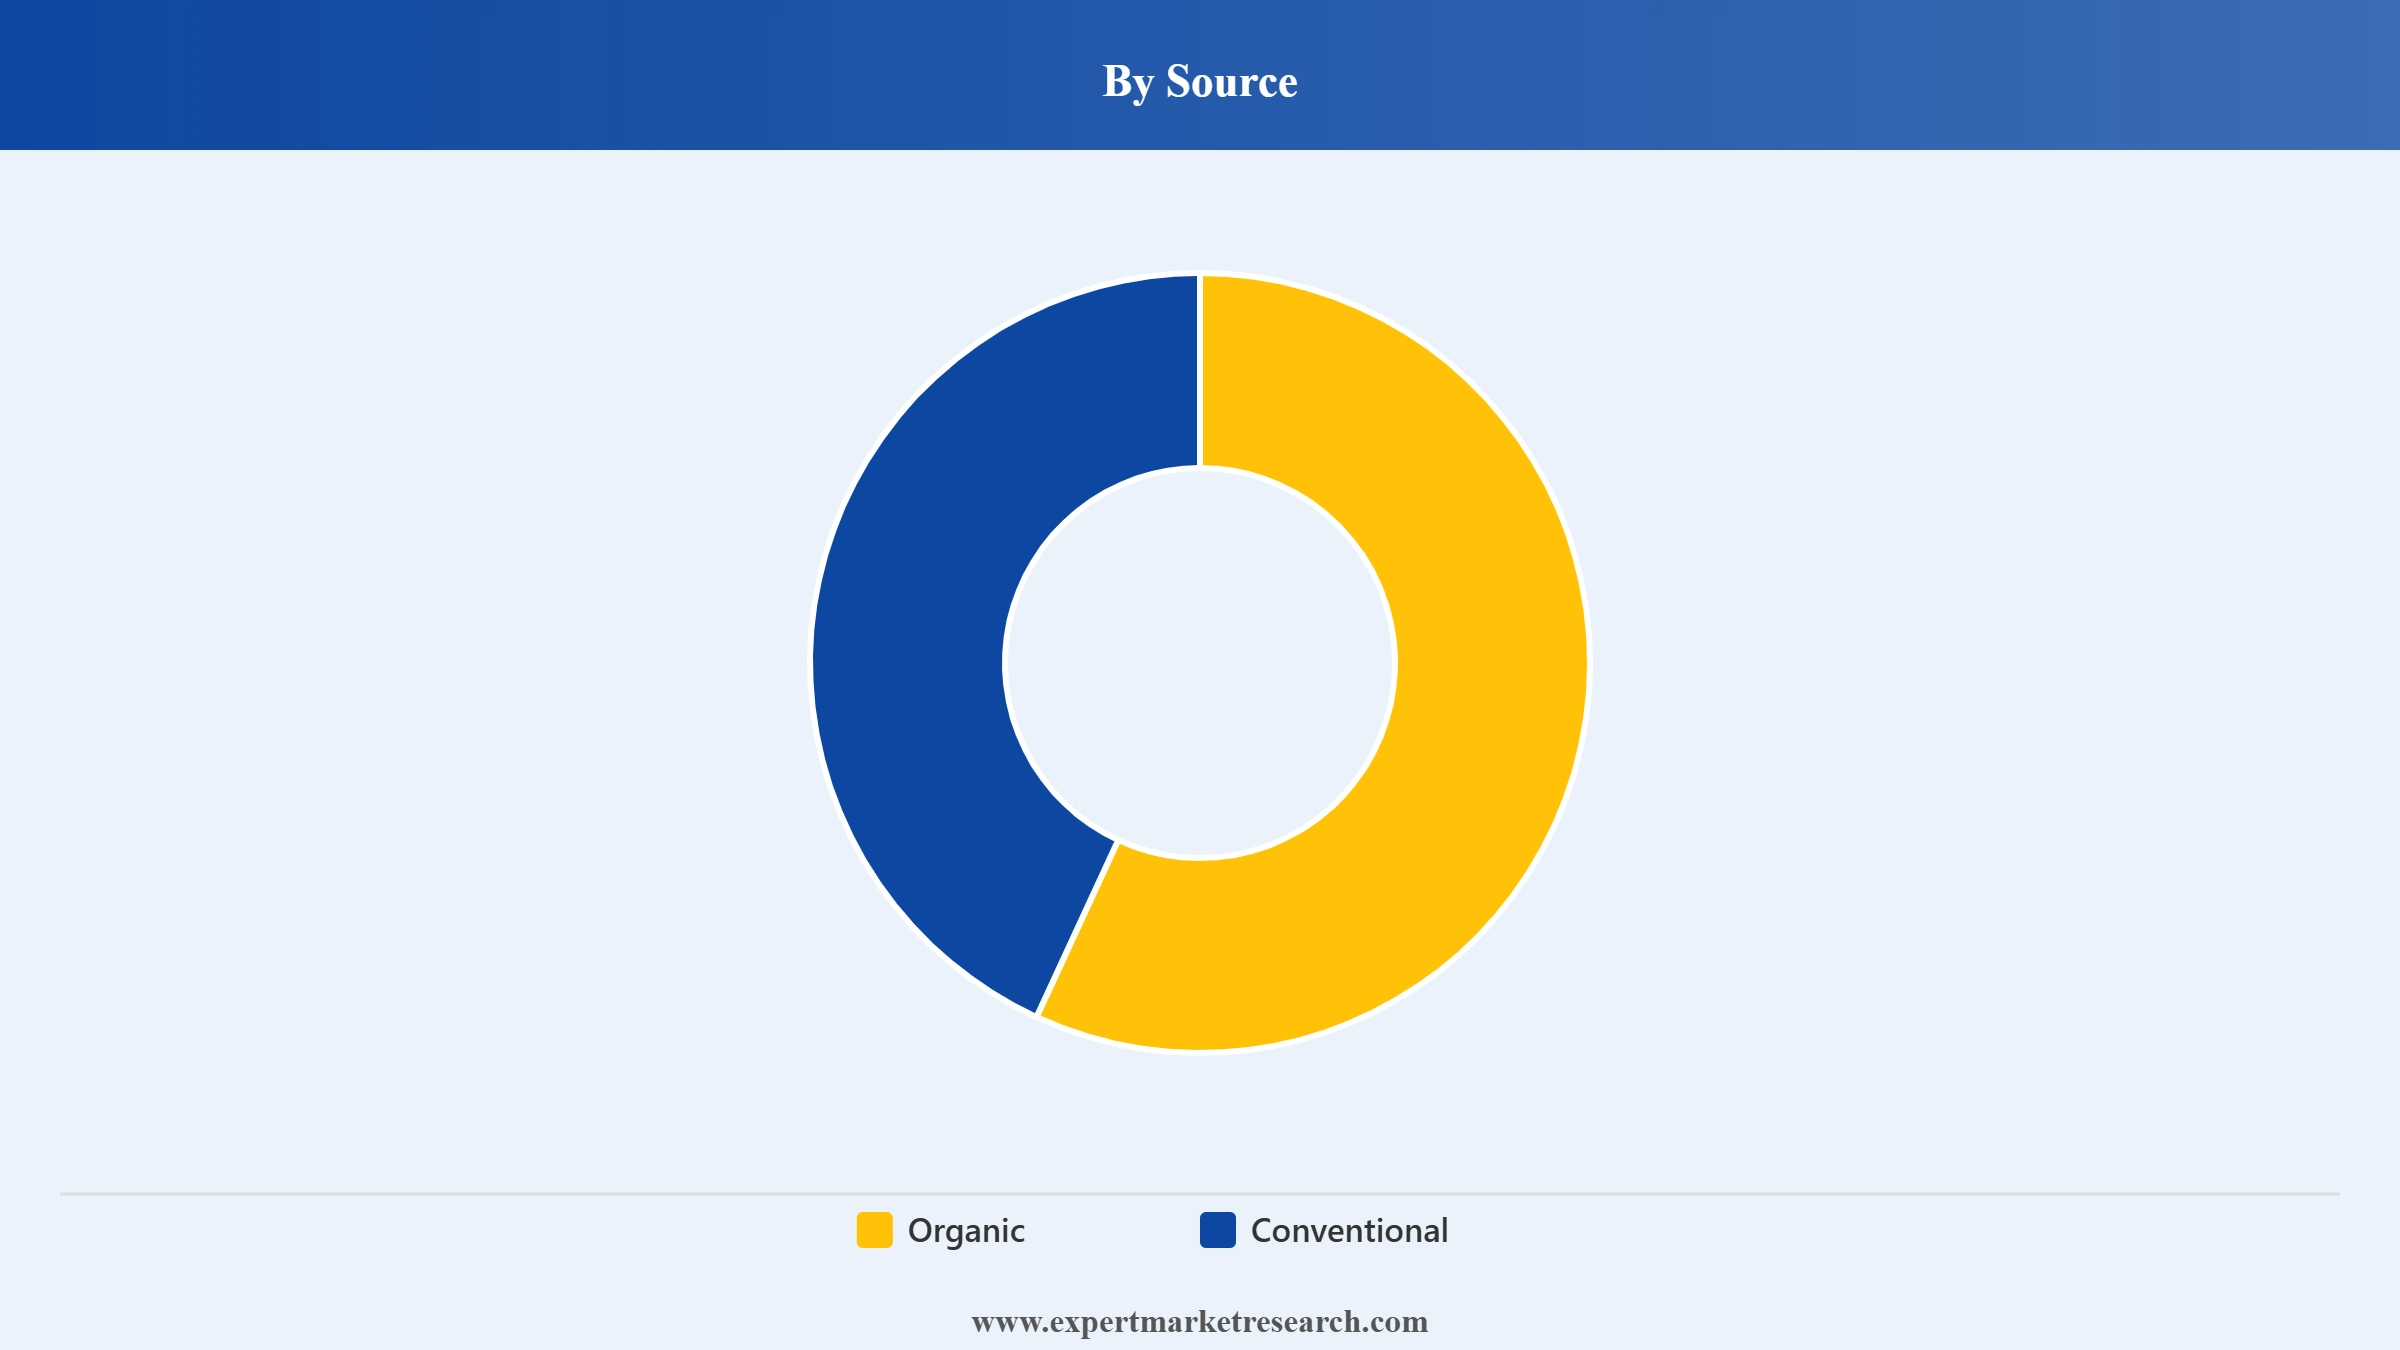
Key Insight: Conventional tea dominates the source segment with broad black, green, and specialty tea production across India, China, Sri Lanka, and Kenya. Of note, organic tea is the fastest growing pool, aided by health focused household demand, premium pricing, and modern retail and specialty store distribution. Both segments are more and more subject to sustainability and traceability programmes, reinforced by digital provenance platforms and supplier transparency commitments.
Market Breakup by Type
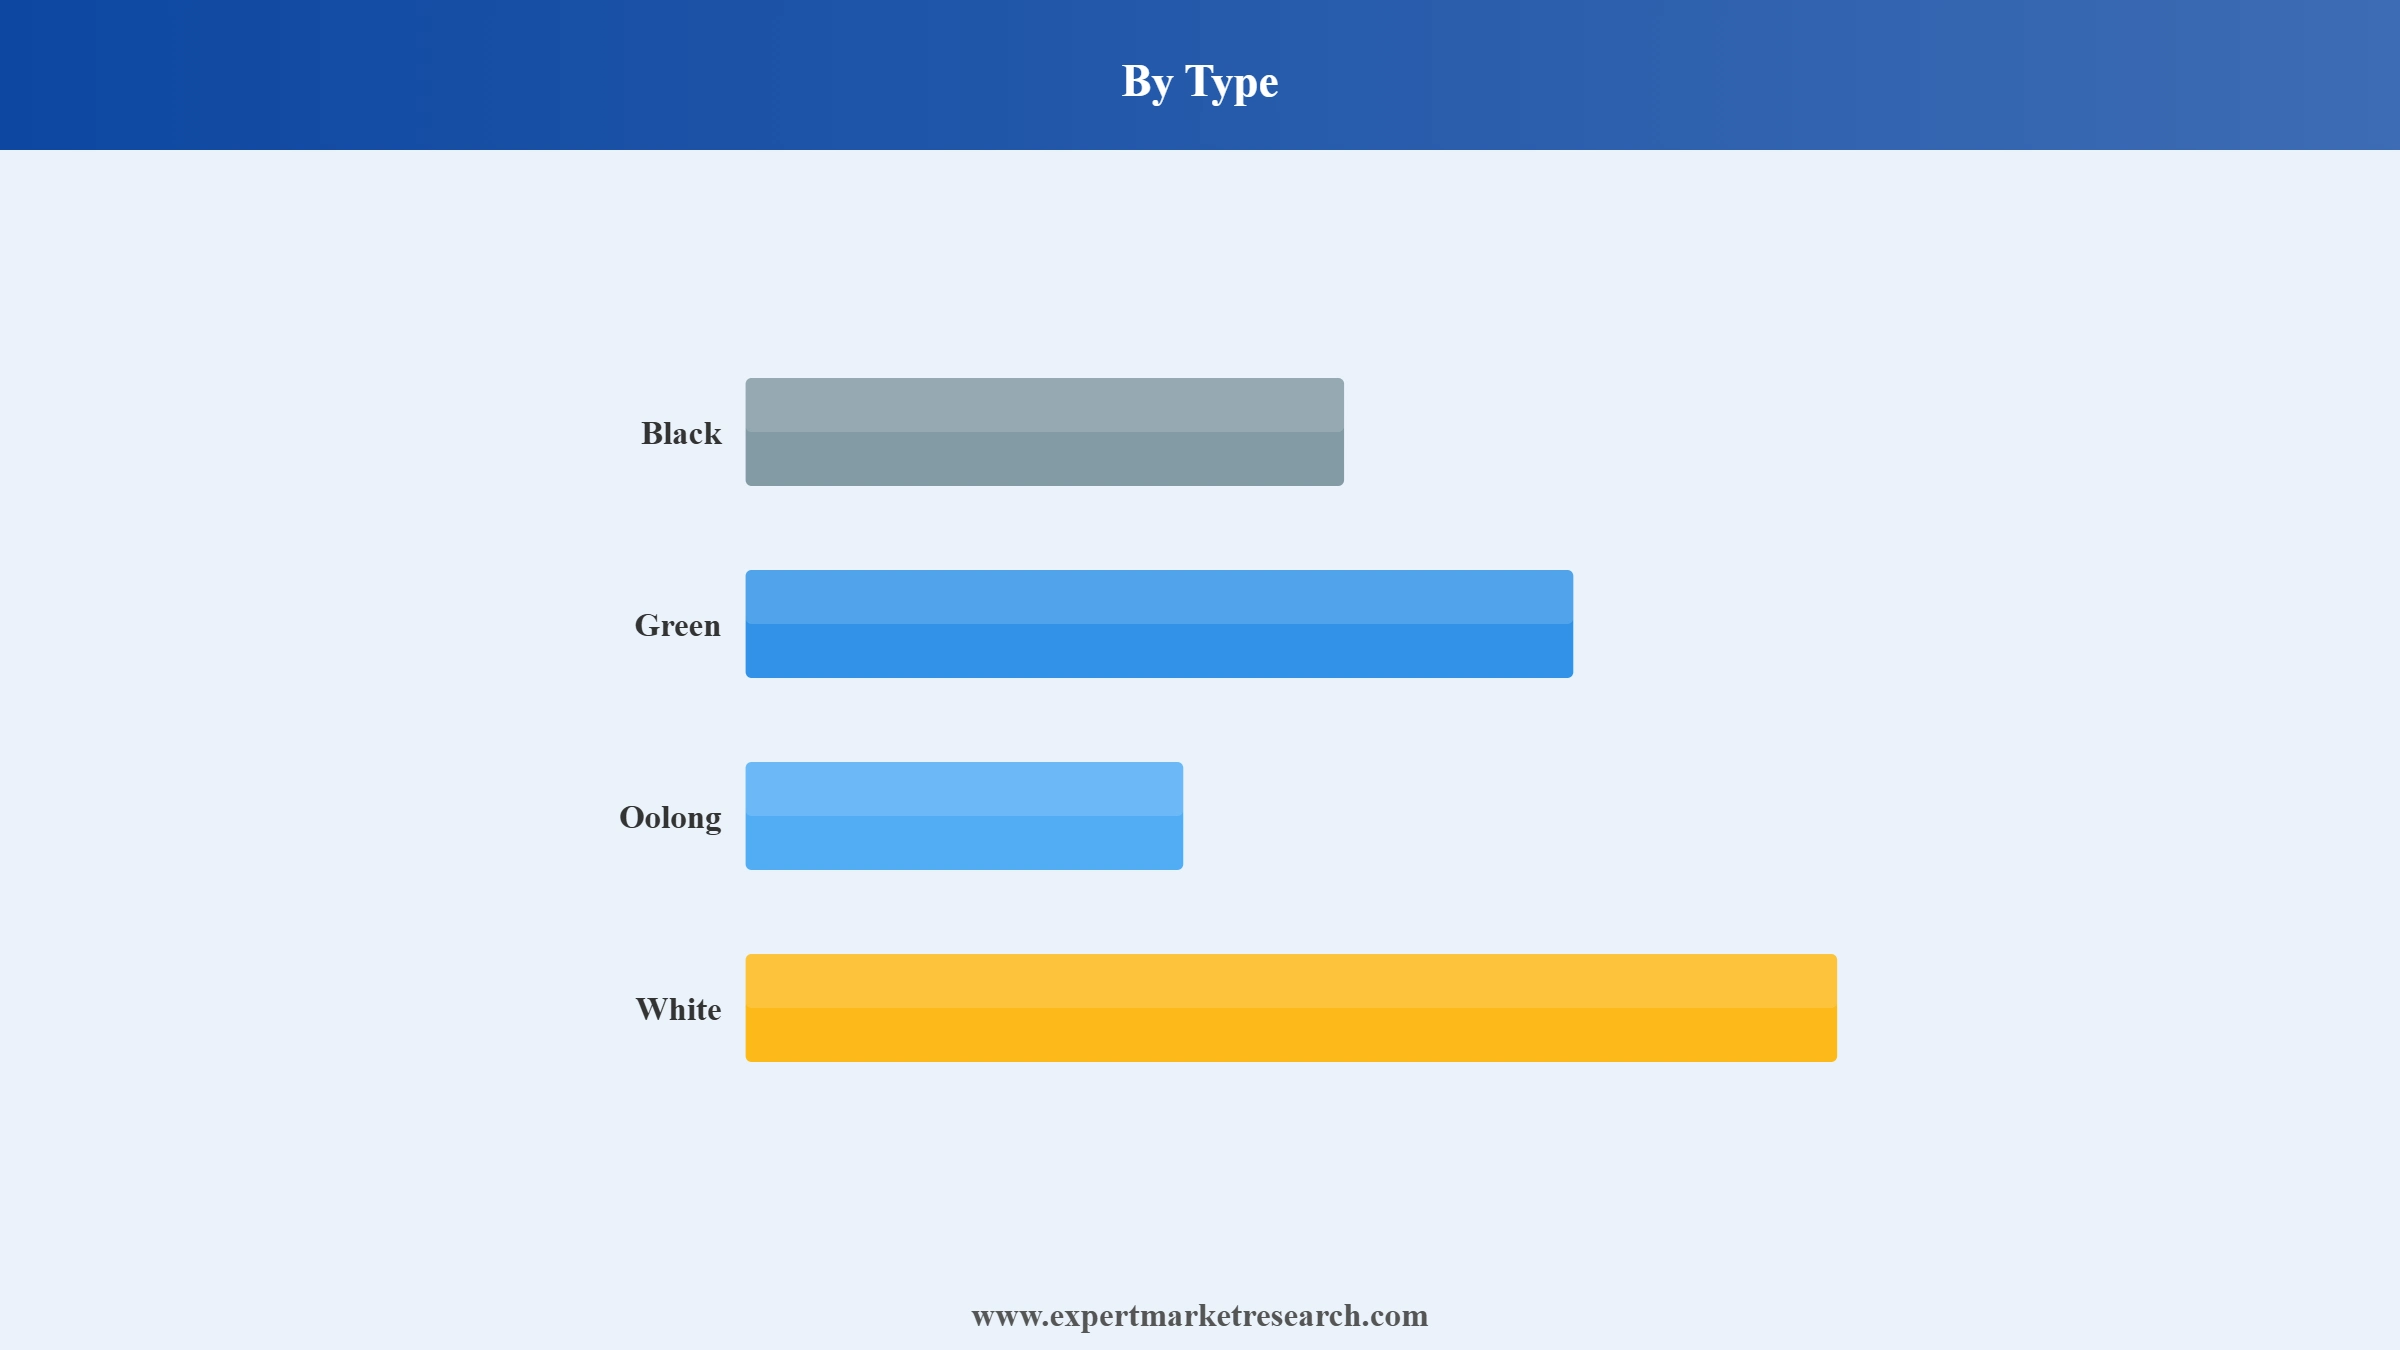
Key Insight: Black tea dominates the type segment with broad household consumption across India, the UK, Russia, and the Middle East. Green tea is the next worth noting pool, anchored by Chinese, Japanese, and Korean production. Oolong and white teas anchor premium pricing in modern retail and specialty stores. Others including herbal, fruit, and matcha teas are the fastest growing pool on health and wellness positioning across global markets.
Market Breakup by Packaging Type
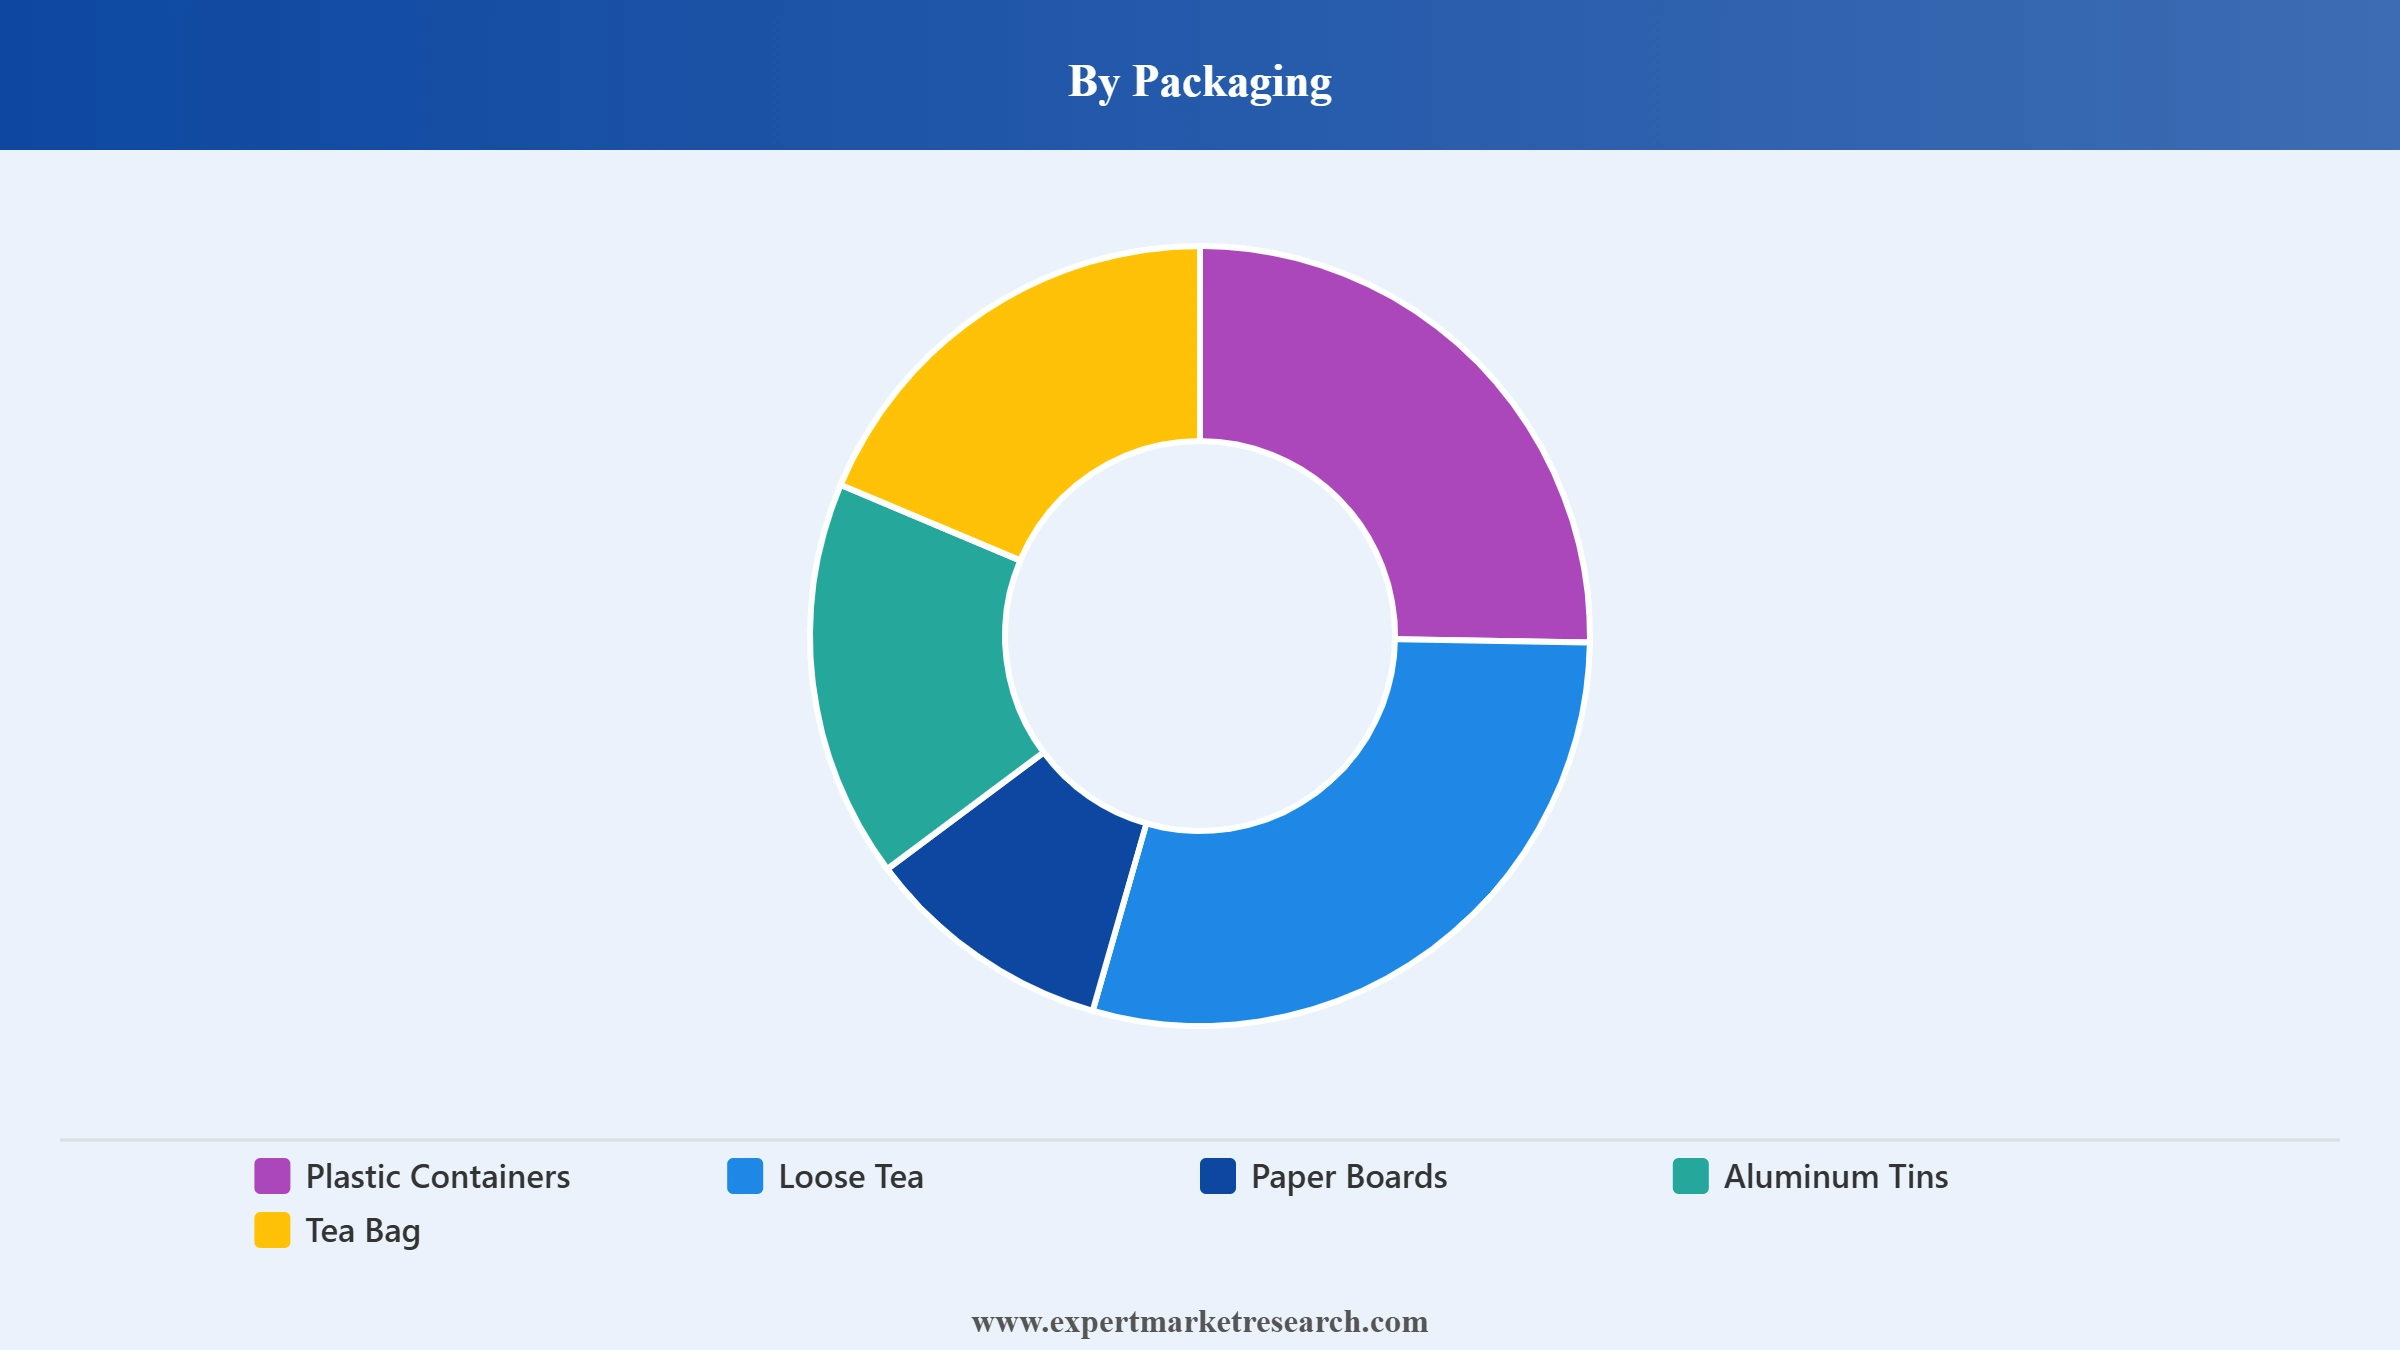
Key Insight: Tea bags dominate the packaging segment in modern retail and on trade across the UK, US, and other Western markets. That said, loose tea anchors traditional Asian and Middle Eastern consumption and specialty premium SKUs. Paper boards and aluminium tins serve premium gift and specialty assortments. Plastic containers serve mass household and on the go SKUs. Compostable plant based tea bags are the fastest growing format, exemplified by Lipton plant based launches.
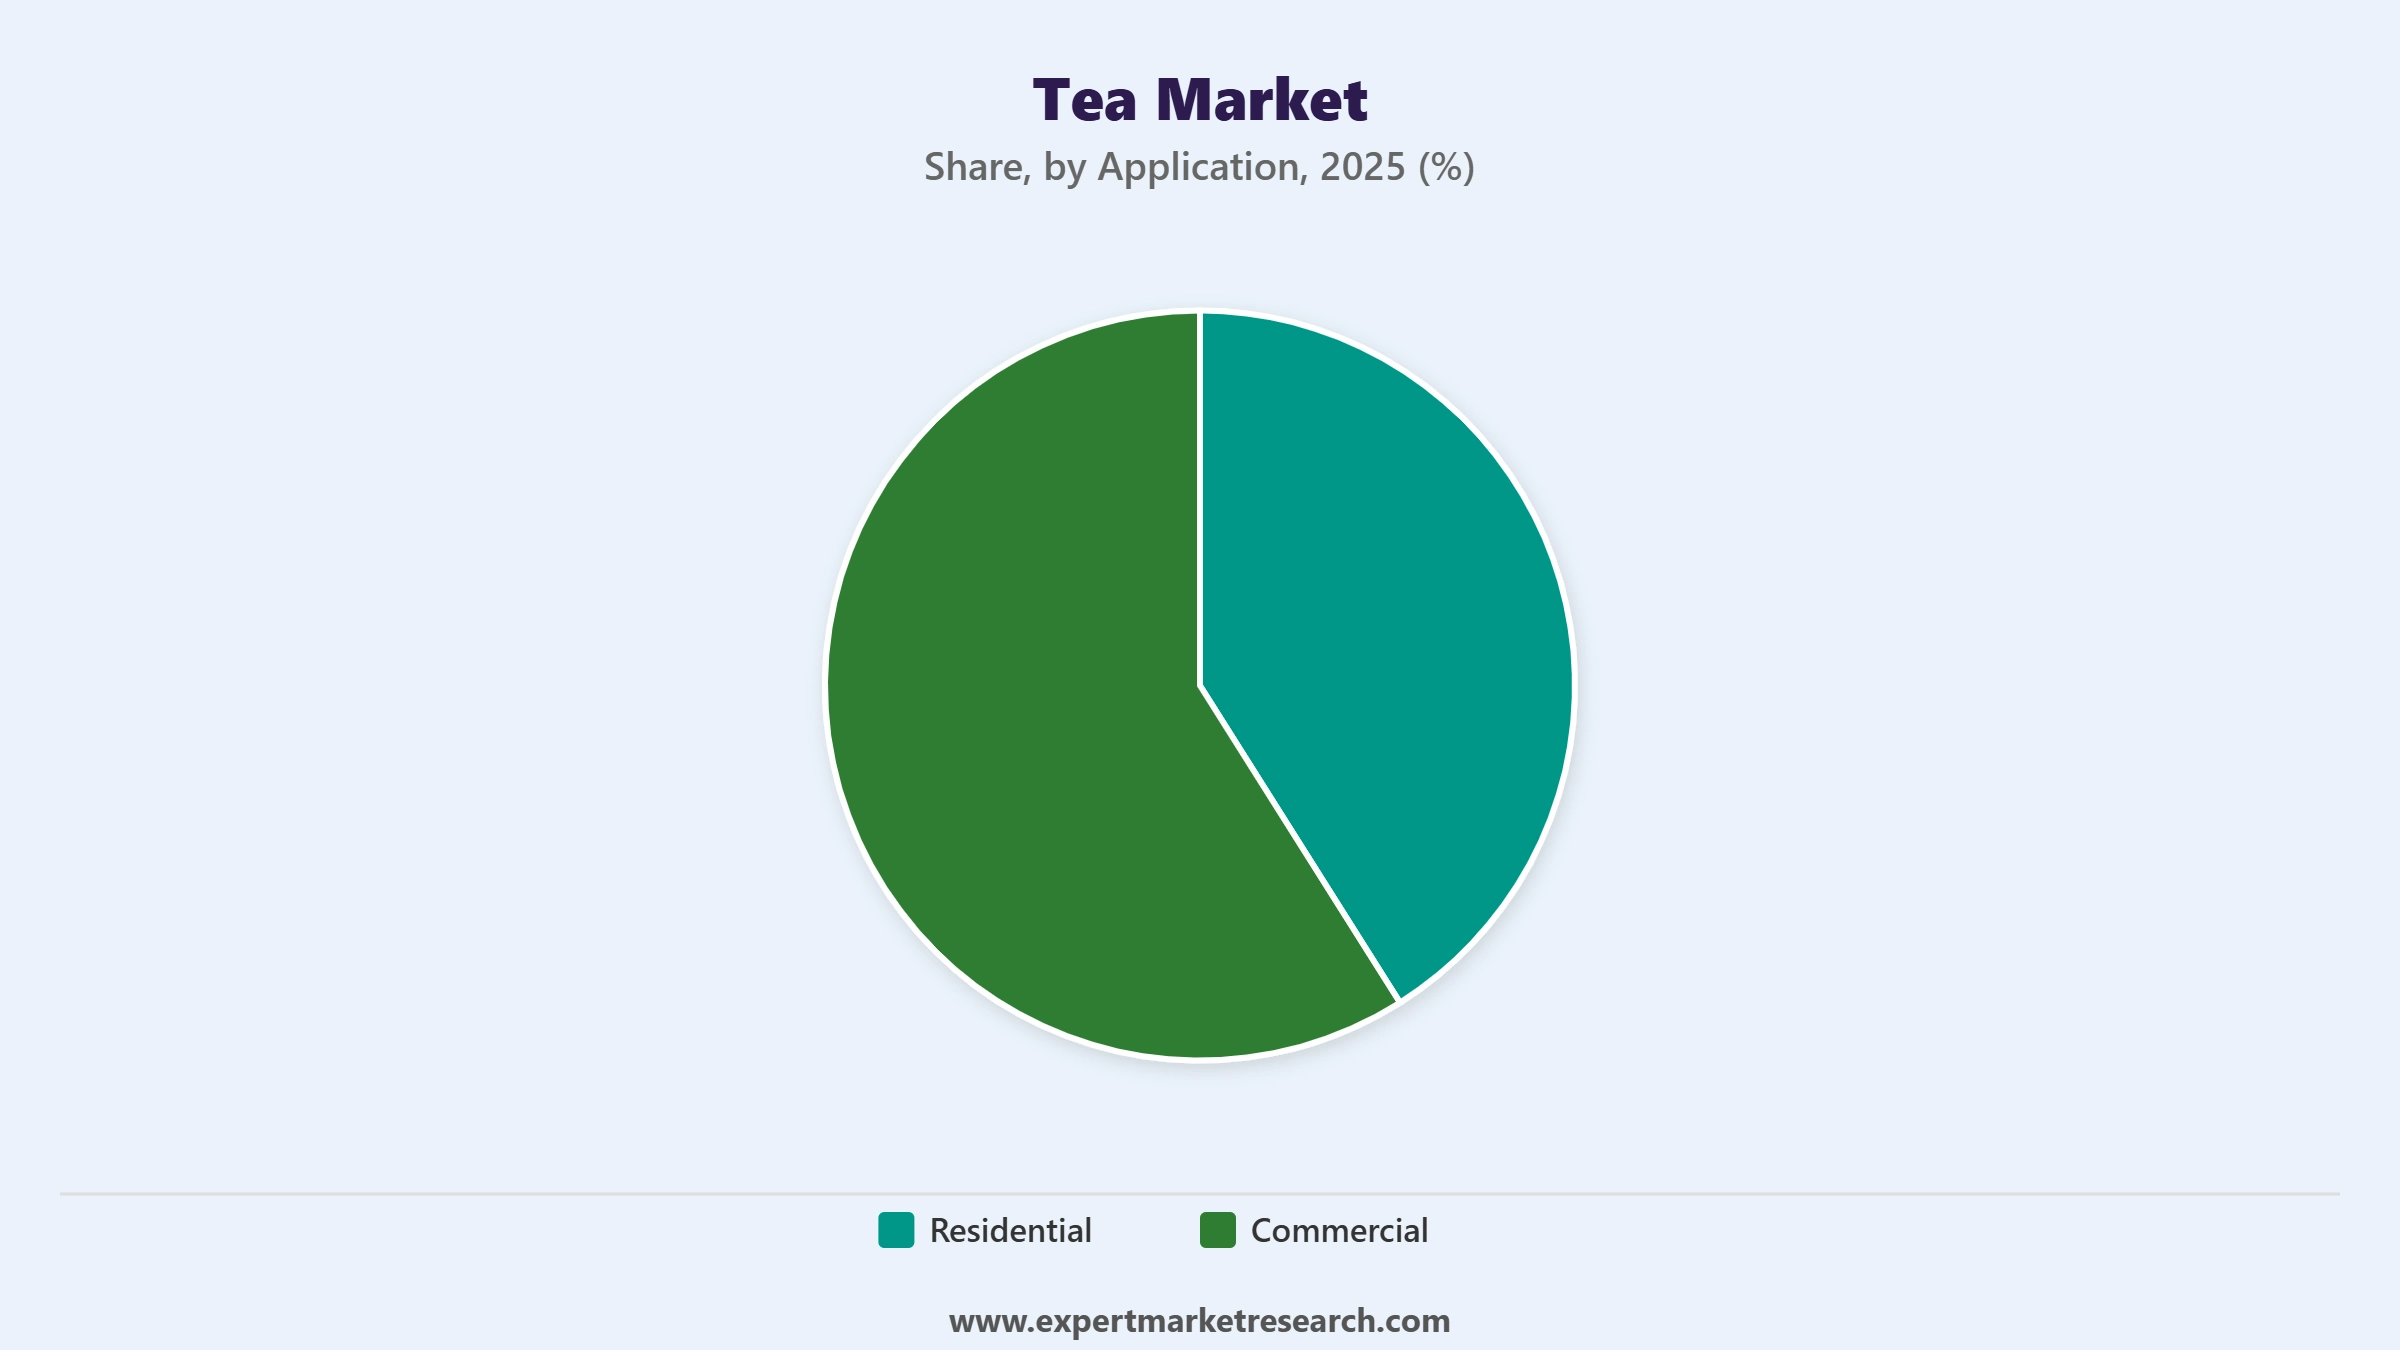
Market Breakup by Application
Key Insight: Residential applications dominate the global tea market with broad household consumption across all regions. Commercial applications are the fastest growing pool, anchored by cafe chains, hotels, restaurants, QSR, bubble tea franchises, and office break rooms. Both segments are more and more specifying premium, organic, and traceable tea SKUs, aided by Tata Consumer traceability platforms and Lipton sustainability programmes.
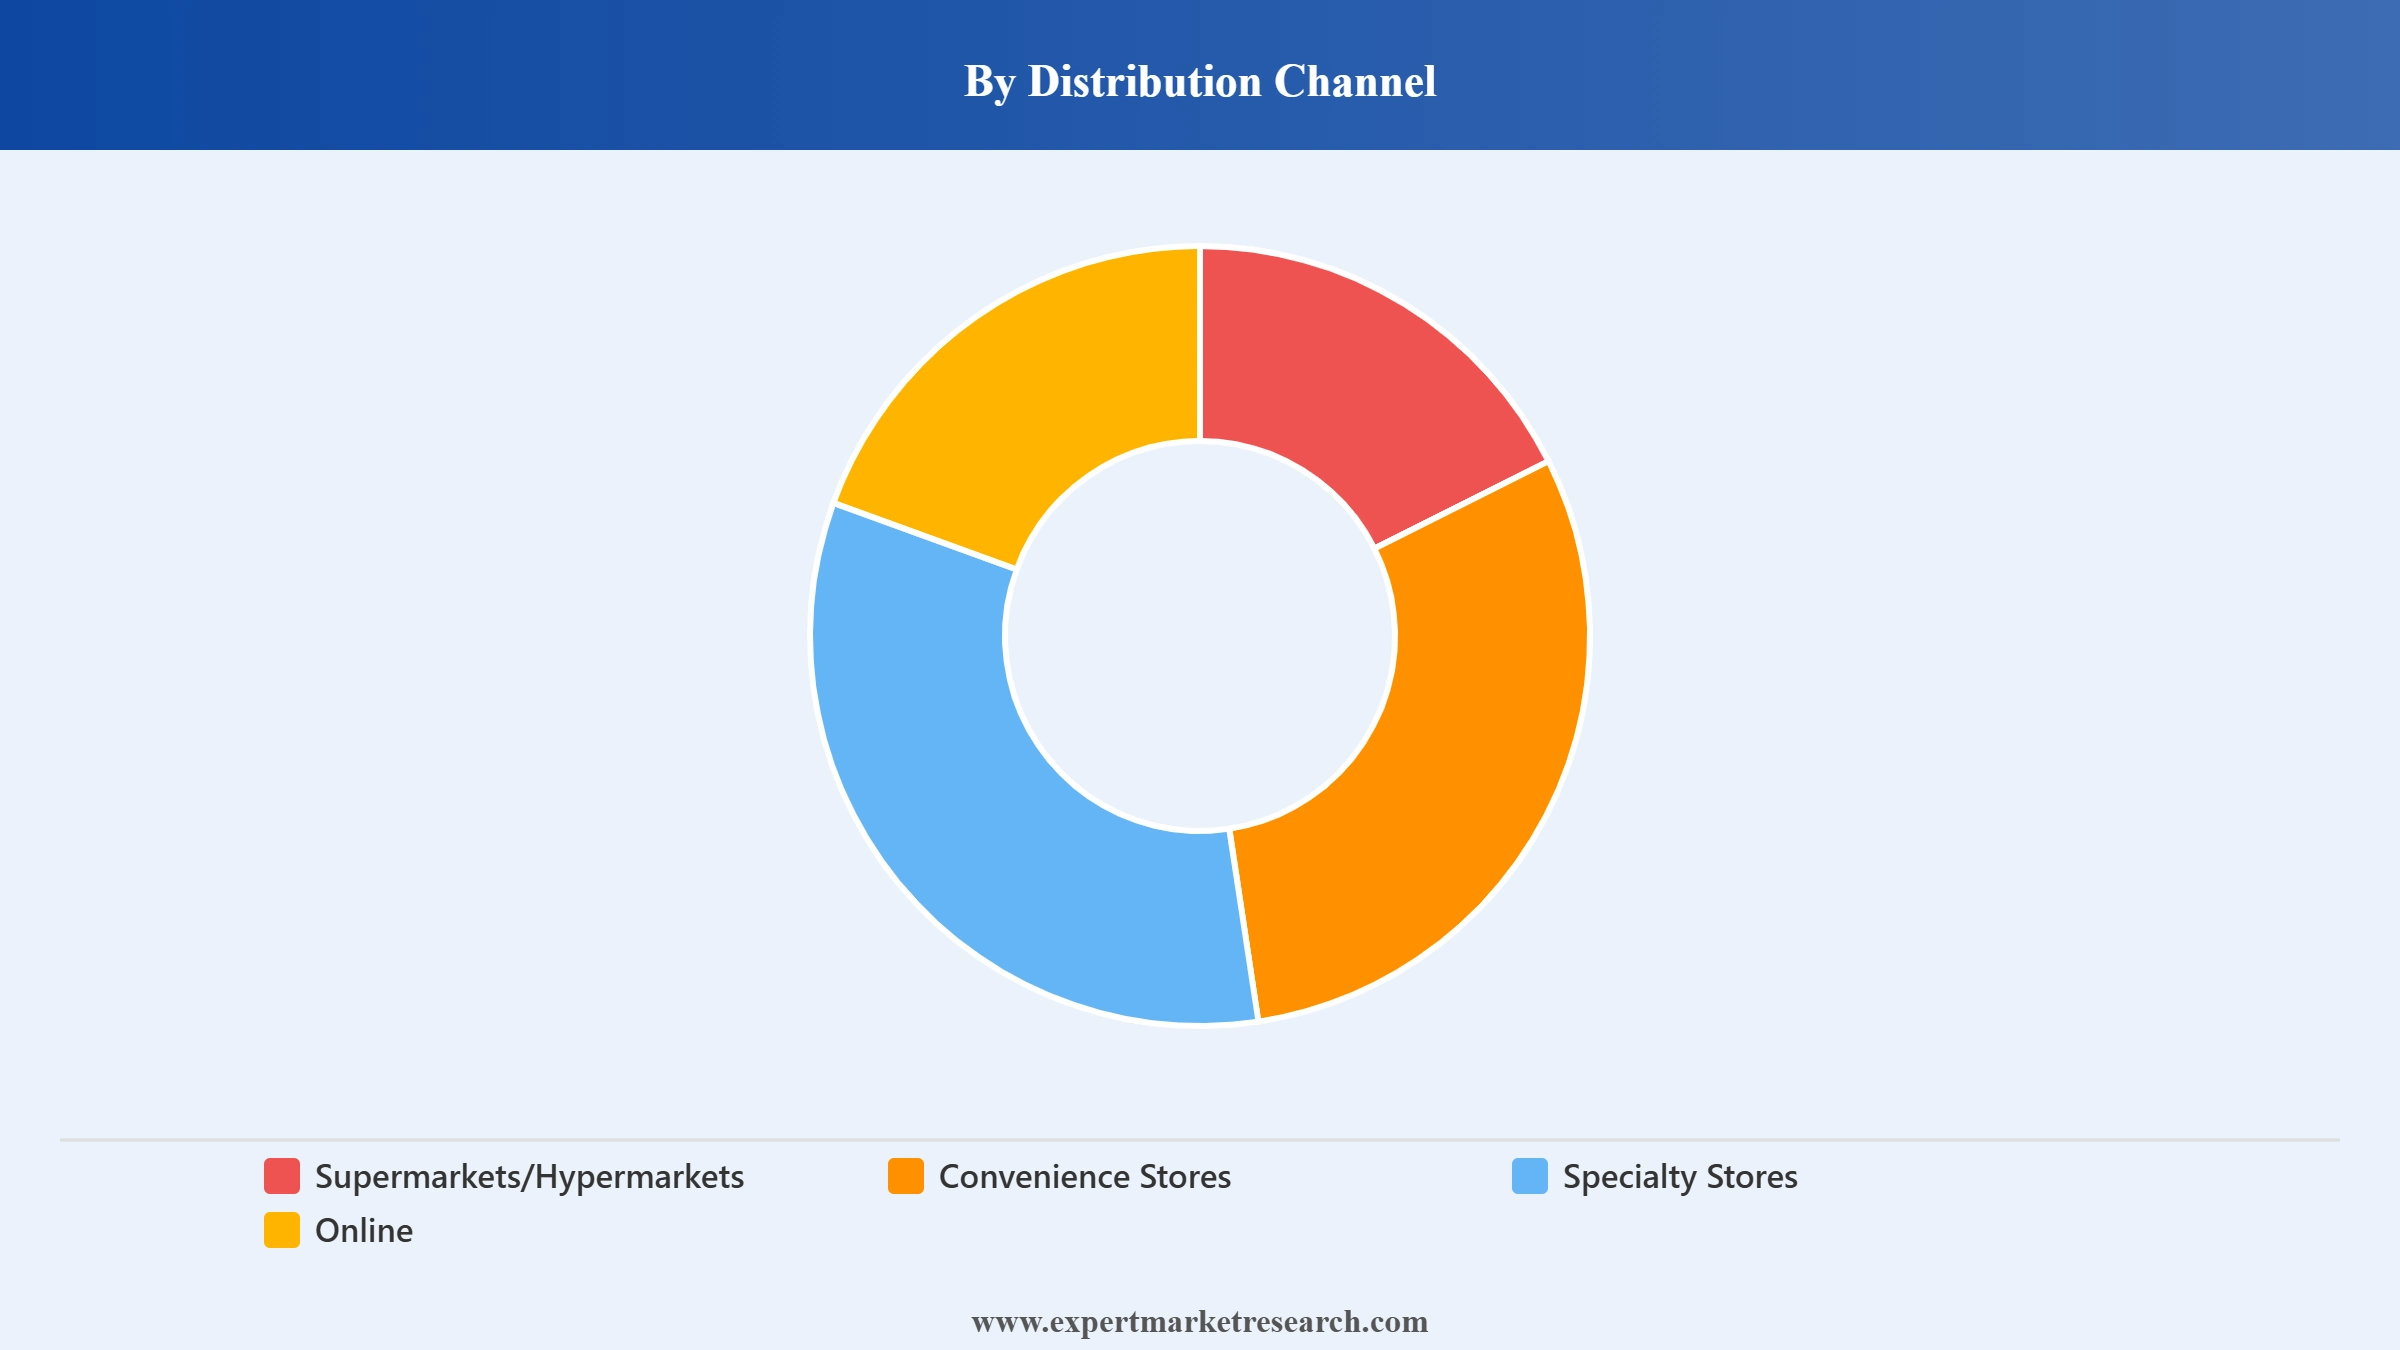
Market Breakup by Distribution Channel
Key Insight: Supermarkets and hypermarkets lead distribution with broad household and brand SKU assortments. Specialty stores anchor premium green, oolong, white, and craft teas. Convenience stores serve impulse and small format demand. Online is the fastest growing channel, aided by direct to consumer specialty tea brand growth and quick commerce. Others including foodservice distribution complete the channel pool.
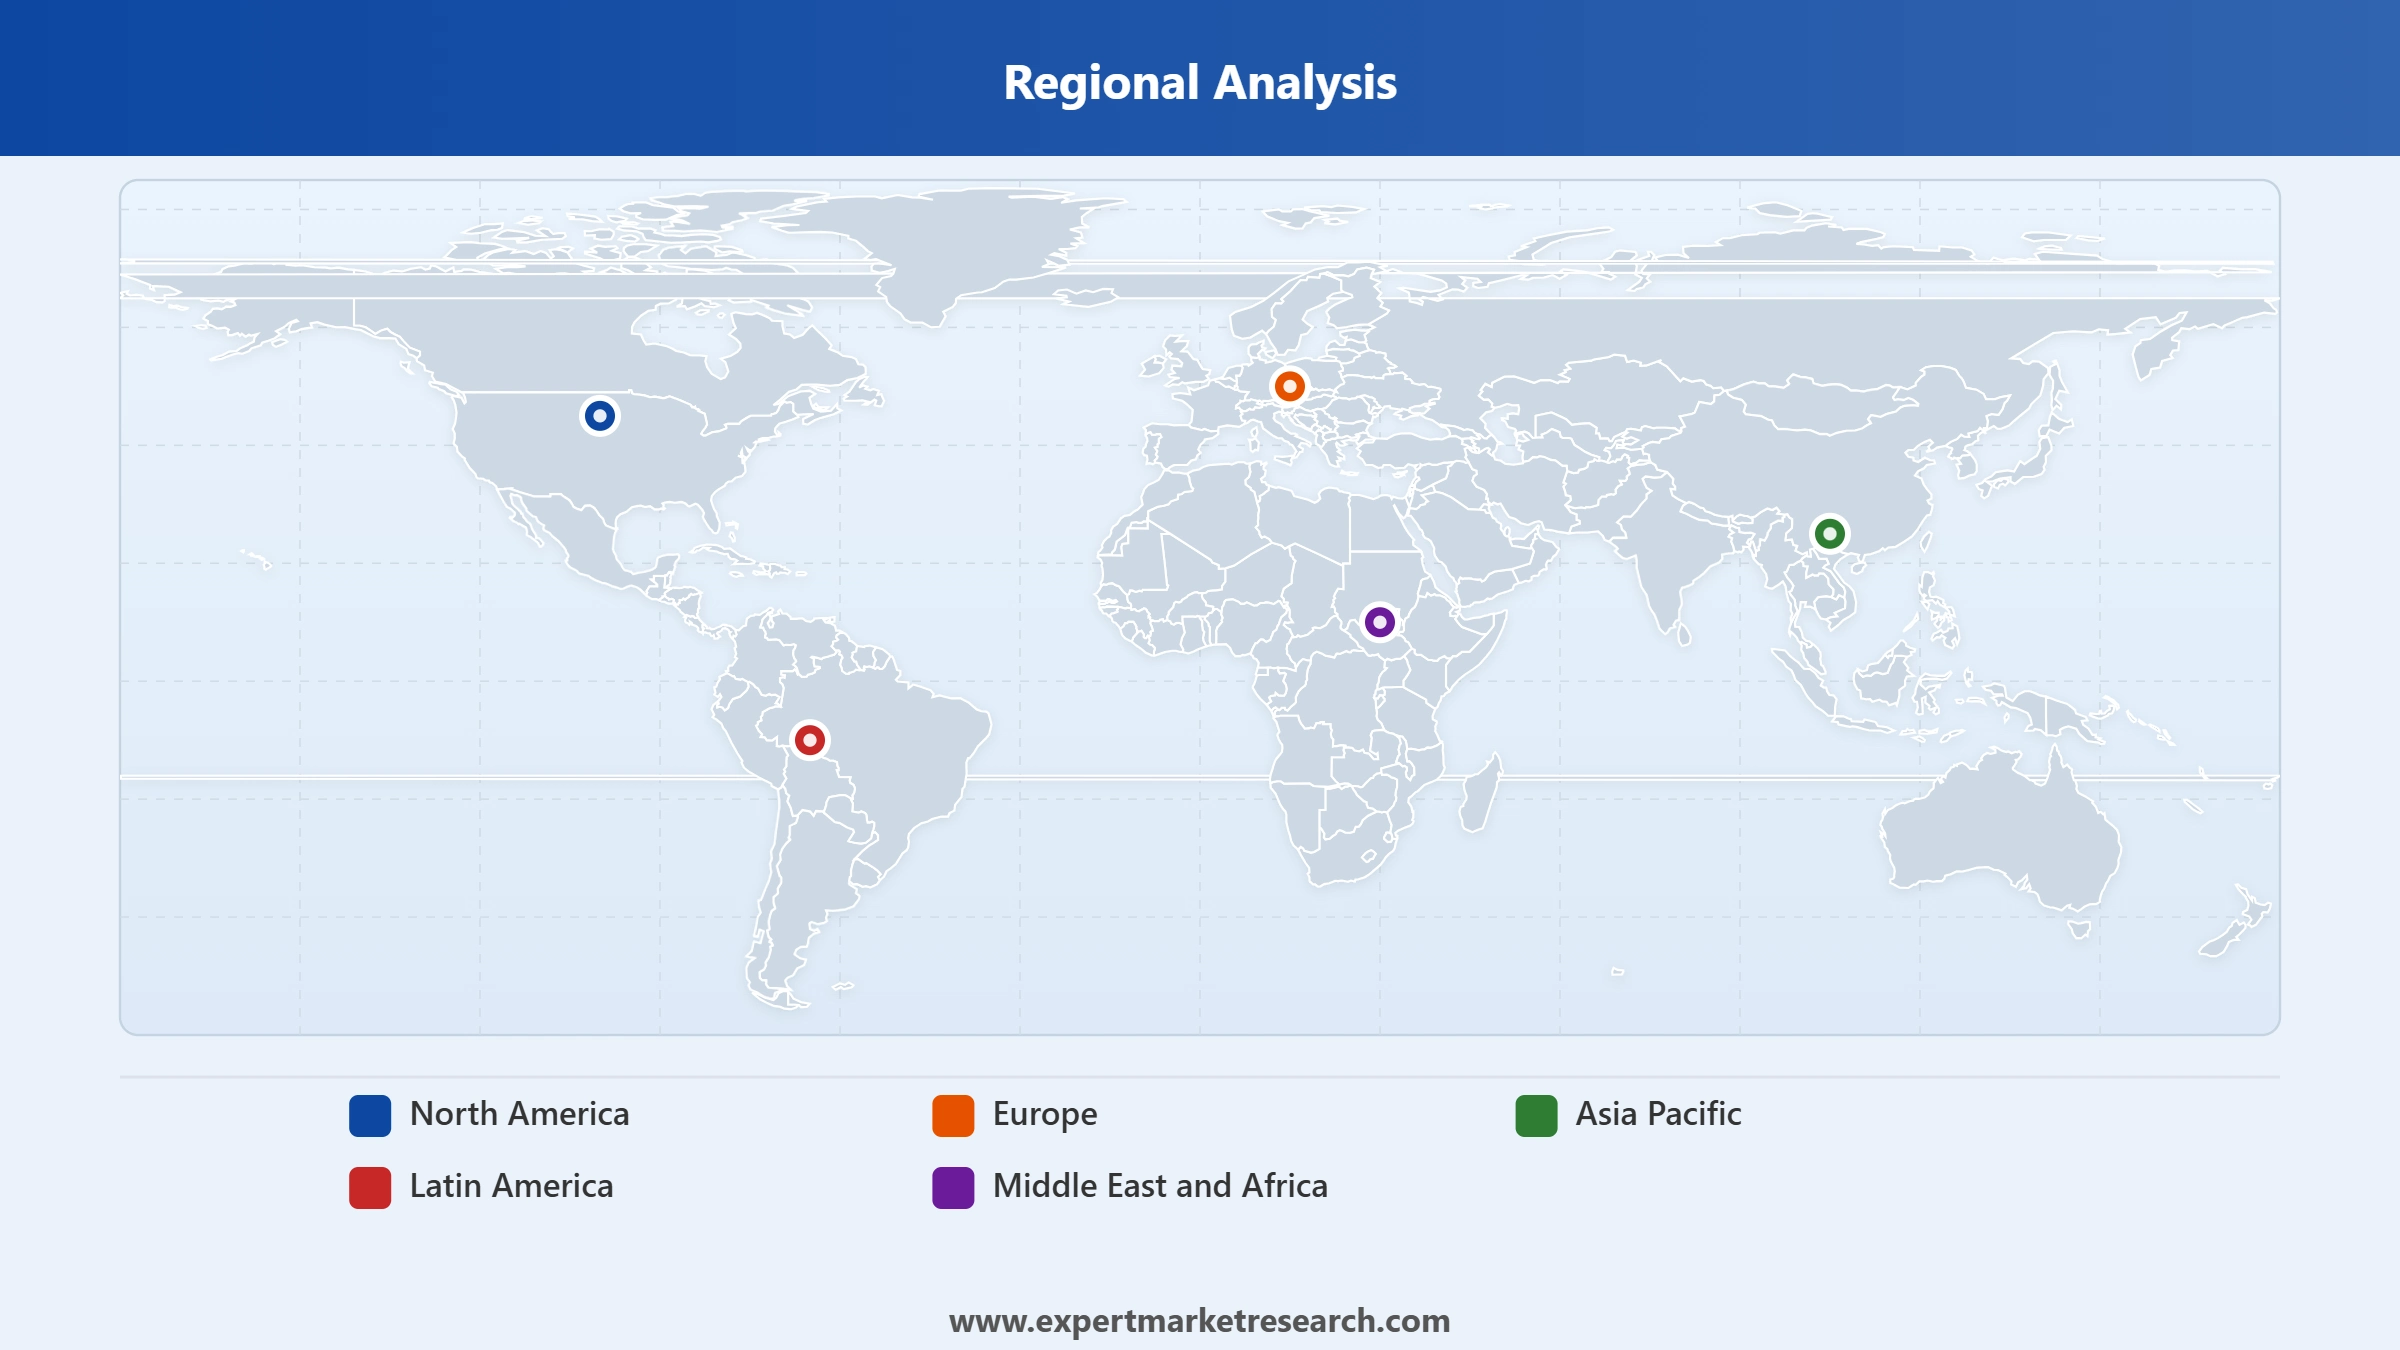
Market Breakup by Region
Key Insight: Asia Pacific leads the global tea market on the back of India, China, Japan, and Sri Lanka production and consumption. Europe is anchored by UK, Russia, and Turkey tea consumption and Twinings, Tetley, Clipper, and PG Tips brand strength. North America follows on US and Canadian premium and ready to drink tea growth. Middle East and Africa are anchored by Saudi Arabia, Iran, and Turkey household consumption. Latin America is led by Brazil and Argentina yerba mate and herbal tea.


Read more about this report - REQUEST FREE SAMPLE
By Source, Conventional Tea accounts for the dominant share of the market due to broad black, green, and specialty tea production across India, China, Sri Lanka, and Kenya
Conventional tea dominates the source segment, pointing to the scale of global black, green, and specialty tea production across the major origin nations of India, China, Sri Lanka, Kenya, and Vietnam. The breadth of conventional tea's reach across all buyer groups, retail formats, and geographic markets makes it the foundation of global tea consumption, aided by established supply chains, competitive pricing, and broad brand portfolios.
Organic tea is the fastest growing source segment, backed by health-conscious buyer demand, premium pricing, and expanding modern retail and specialty store distribution across North America, Europe, and affluent Asia Pacific markets. Both source segments are more and more subject to sustainability and traceability certification requirements, aided by digital provenance platforms and supplier transparency commitments that are reshaping procurement standards.
Read more about this report - REQUEST FREE SAMPLE
By Type, Black Tea dominates the market due to mass household consumption and breakfast tea demand
Black tea leads the global tea market on the back of broad household consumption in India, the UK, Russia, the Middle East, and East Africa, anchored by mass blends, breakfast tea, and value brand SKUs across modern retail and traditional channels. June 2025 Tata Consumer Tetley digital traceability launch illustrates how leading black tea brands are upgrading transparency and provenance.
Green tea is the next worth noting pool, anchored by Chinese, Japanese, and Korean production and global health focused consumption. Notably, oolong and white teas anchor premium pricing in modern retail and specialty stores. Others including herbal, fruit, and matcha teas are the fastest growing pool on health and wellness positioning, supporting global tea market growth.
Read more about this report - REQUEST FREE SAMPLE
By Packaging Type, Tea Bags account for the dominant share of the market due to convenience, modern retail penetration, and broad brand portfolio coverage across Western markets
Tea bags dominate the global tea packaging segment, anchored by their broad uptake in modern retail and on-trade channels across the UK, US, Germany, and other major Western markets. Their convenience, portioned dosing, and compatibility with automatic hot water dispensers make them the preferred format for household and on-trade use in Western and more and more in Asian markets. Leading tea brands continue to innovate with pyramid, round, and compostable plant-based tea bag formats, exemplified by Lipton's plant-based tea bag launches.
Loose tea anchors traditional consumption in Asian, Middle Eastern, and Eastern European markets and specialty premium SKUs where whole leaf quality and custom blending are valued. Paper boards and aluminium tins serve premium gift and specialty assortments, while plastic containers serve mass household and on-the-go SKUs. Compostable and biodegradable packaging formats are the fastest growing sub-category across all packaging types, pointing to sustainability mandates from retail customers and consumer expectations.
Read more about this report - REQUEST FREE SAMPLE
By Application, Residential accounts for the dominant share of the market due to broad household consumption
Residential applications dominate the global tea market with broad household consumption across all regions, anchored by black, green, herbal, and specialty SKUs in modern retail and traditional channels. Lipton plant based compostable tea bag launches and Tetley traceability platform illustrate how leading brands are upgrading household tea consumption experience and sustainability credentials.
Commercial applications are the fastest growing pool, anchored by cafe chains, hotels, restaurants, QSR, bubble tea franchises, and office break rooms. Bubble tea growth in Asia Pacific and North America metro markets, plus ready to drink iced tea and matcha launches, are widening the commercial pool and contributing to global tea market growth.
Read more about this report - REQUEST FREE SAMPLE
By Distribution Channel, Supermarkets and Hypermarkets account for the dominant share of the market due to broad household and branded SKU assortment distribution
Supermarkets and hypermarkets lead distribution in the global tea market, providing the broadest range of household and premium branded tea SKUs across black, green, herbal, and specialty categories. Their wide retail network, promotional capacity, and ability to carry both mainstream mass-market and premium tea ranges make them the primary distribution channel for household tea consumption across all major markets globally.
Specialty stores anchor the premium green, oolong, white, and craft tea segment, catering to discerning consumers and the growing artisanal tea movement. Online channels are the fastest growing distribution pathway, backed by direct-to-consumer specialty tea brand growth and quick commerce platforms. Convenience stores serve impulse and small-format demand, while foodservice and other channels complete the addressable distribution pool.
Read more about this report - REQUEST FREE SAMPLE
Asia Pacific dominates the market due to production and household consumption
Asia Pacific leads the global tea market on the back of India, China, Japan, and Sri Lanka production and consumption, with strong household and on trade demand. Tata Consumer Products Tetley June 2025 digital traceability launch and ongoing sustainability programmes by major Indian and Sri Lankan tea producers reinforce premium positioning and global brand presence across modern retail channels.
Europe is anchored by UK, Russia, and Turkey tea consumption and Twinings, Tetley, Clipper, and PG Tips brand strength, aided by February 2025 supplier list publication for transparency. North America follows on premium and ready to drink tea growth. Middle East and Africa are anchored by Saudi Arabia, Iran, and Turkey household consumption. Latin America is led by Brazil and Argentina yerba mate and herbal tea, supporting global tea market growth across regions.
Read more about this report - REQUEST FREE SAMPLE
The global tea market is moderately consolidated with global FMCG tea majors, Indian and Sri Lankan integrated tea companies, Chinese green tea producers, and specialty premium brands competing across black, green, oolong, white, and herbal categories. Competitive priorities revolve around sustainability, traceability, plant based packaging, premium SKUs, and ready to drink growth.
Companies are differentiating through sustainability commitments, traceability platforms, premium and specialty SKUs, and plant based compostable packaging. Strategic moves include the June 2025 Tata Consumer Tetley digital traceability launch, March 2025 Unilever Lipton plant based compostable bag launch, February 2025 Lipton Browns Investments plantation partnership, and major brand supplier list publications.
Founded in 1929 and headquartered in London, UK, the company is a leading global FMCG firm with major tea brands including Lipton, Brooke Bond, PG Tips, and Pukka. Its operations span tea sourcing, plantation partnerships, and modern retail distribution across global markets, with strong sustainability commitments and recent plant based compostable bag launches under Lipton brand.
Founded in 1935 and headquartered in London, UK, the company is a diversified food, ingredients, and retail firm with the leading premium tea brand Twinings under its food portfolio. Its operations span tea sourcing, blending, and modern retail distribution across the UK, Europe, North America, Asia Pacific, and Middle East premium tea markets.
Founded in 2020 from Tata Global Beverages reorganisation and headquartered in Mumbai, India, the company is a leading global tea firm with Tata Tea, Tetley, Good Earth, and other tea brands. Its operations span Indian tea plantations, blending, distribution, and recent digital traceability platforms supporting premium positioning across global retail channels.
Founded in 1966 and headquartered in Tokyo, Japan, the company is a leading Japanese tea firm with green tea, oolong, black tea, and ready to drink tea portfolio. Its operations span Japanese tea sourcing, blending, and modern retail distribution across Japan, Asia Pacific, North America, and global premium tea markets.
Other leading companies in the market are Taiwan Tea Corporation, Dilmah Ceylon Tea Company PLC., Barry's Tea, and Others.
*Please note that this is only a partial list; the complete list of key players is available in the full report. Additionally, the list of key players can be customized to better suit your needs.*
Discover the latest insights on the global tea market 2026 with our comprehensive report. Stay ahead of the curve with valuable data on product innovations, consumer demand, and top growth regions. Whether you are launching a new product or expanding your brand, this report gives you the clarity you need. Download your free sample now and discover the key opportunities in the thriving Global Tea.
Australia Earl Grey Tea Market
Indian Premium Tea Market
Elderflower Tea Market
Kombucha Tea Market
Functional Tea Beverage Innovation Trends
Botanical Herbal Beverage Market Outlook
Ready-to-Drink Tea Convenience Insights
Upto 15% Off
USD
$2999 $2699
$4839 $4355
$5999 $5099
$7259 $6170


*While we strive to always give you current and accurate information, the numbers depicted on the website are indicative and may differ from the actual numbers in the main report. At Expert Market Research, we aim to bring you the latest insights and trends in the market. Using our analyses and forecasts, stakeholders can understand the market dynamics, navigate challenges, and capitalize on opportunities to make data-driven strategic decisions.*
In 2025, the market reached an approximate value of USD 59.59 Billion.
The market is projected to grow at a CAGR of 6.20% between 2026 and 2035.
The revenue generated from the market is expected to reach USD 108.75 Billion in 2035.
Key strategies driving the market include product innovation with health-focused blends, expanding ready-to-drink and premium offerings, digital marketing and e-commerce growth, sustainability initiatives like eco-friendly packaging, and targeting younger consumers through trendy flavours and experiential retail. Collaborations and global distribution also boost market reach.
The key trend guiding the growth of the tea market include the availability of tea in different flavours, which satisfies every consumer’s taste.
The market is broken down into North America, Europe, Asia Pacific, Latin America, and Middle East and Africa.
The market is categorised according to the type, which includes black, green, oolong, white, and others.
Plastic containers, loose tea, paper boards, aluminium tins, and tea bags, among others, are the significant packaging types for the product in the market.
Based on the distribution channel, the market is divided into supermarkets and hypermarkets, convenience stores, speciality stores, online, and others.
Based on the application, the market is divided into commercial and residential.
The key players in the market report include Dilmah Ceylon Tea Company PLC., Barry’s Tea, Tata Consumer Products Limited, The Hain Celestial Group, Inc, Unilever Plc, Associated British Foods Plc, ITO EN, LTD., Taiwan Tea Corporation, SAC Leão, and Tenfu's TEA, among others.
The market is categorised according to the source, which includes organic and conventional.
The Asia Pacific region dominates the market due to its deep-rooted cultural, agricultural, and economic ties to tea.
Explore our key highlights of the report and gain a concise overview of key findings, trends, and actionable insights that will empower your strategic decisions.
| REPORT FEATURES | DETAILS |
| Base Year | 2025 |
| Historical Period | 2019-2025 |
| Forecast Period | 2026-2035 |
| Scope of the Report |
Historical and Forecast Trends, Industry Drivers and Constraints, Historical and Forecast Market Analysis by Segment:
|
| Breakup by Source |
|
| Breakup by Type |
|
| Breakup by Packaging |
|
| Breakup by Application |
|
| Breakup by Distribution Channel |
|
| Breakup by Region |
|
| Market Dynamics |
|
| Competitive Landscape |
|
| Companies Covered |
|
| Report Price and Purchase Option | Explore our purchase options that are best suited to your resources and industry needs. |
| Delivery Format | Delivered as an attached PDF and Excel through email, with an option of receiving an editable PPT, according to the purchase option. |
Datasheet
One User
USD 2,999
USD 2,699
tax inclusive*
Single User License
One User
USD 4,839
USD 4,355
tax inclusive*
Five User License
Five User
USD 5,999
USD 5,099
tax inclusive*
Corporate License
Unlimited Users
USD 7,259
USD 6,170
tax inclusive*
*Please note that the prices mentioned below are starting prices for each bundle type. Kindly contact our team for further details.*
Flash Bundle
Small Business Bundle
Growth Bundle
Enterprise Bundle
*Please note that the prices mentioned below are starting prices for each bundle type. Kindly contact our team for further details.*
Flash Bundle
Number of Reports: 3
20%
tax inclusive*
Small Business Bundle
Number of Reports: 5
25%
tax inclusive*
Growth Bundle
Number of Reports: 8
30%
tax inclusive*
Enterprise Bundle
Number of Reports: 10
35%
tax inclusive*
How To Order

Select License Type
Choose the right license for your needs and access rights.

Click on ‘Buy Now’
Add the report to your cart with one click and proceed to register.

Select Mode of Payment
Choose a payment option for a secure checkout. You will be redirected accordingly.
Strategic Solutions for Informed Decision-Making
Gain insights to stay ahead and seize opportunities.

Get insights & trends for a competitive edge.

Track prices with detailed trend reports.

Analyse trade data for supply chain insights.

Leverage cost reports for smart savings

Enhance supply chain with partnerships.

Connect For More Information
Our expert team of analysts will offer full support and resolve any queries regarding the report, before and after the purchase.
Our expert team of analysts will offer full support and resolve any queries regarding the report, before and after the purchase.
We employ meticulous research methods, blending advanced analytics and expert insights to deliver accurate, actionable industry intelligence, staying ahead of competitors.
Our skilled analysts offer unparalleled competitive advantage with detailed insights on current and emerging markets, ensuring your strategic edge.
We offer an in-depth yet simplified presentation of industry insights and analysis to meet your specific requirements effectively.


