

Consumer Insights
Uncover trends and behaviors shaping consumer choices today
Procurement Insights
Optimize your sourcing strategy with key market data
Industry Stats
Stay ahead with the latest trends and market analysis.
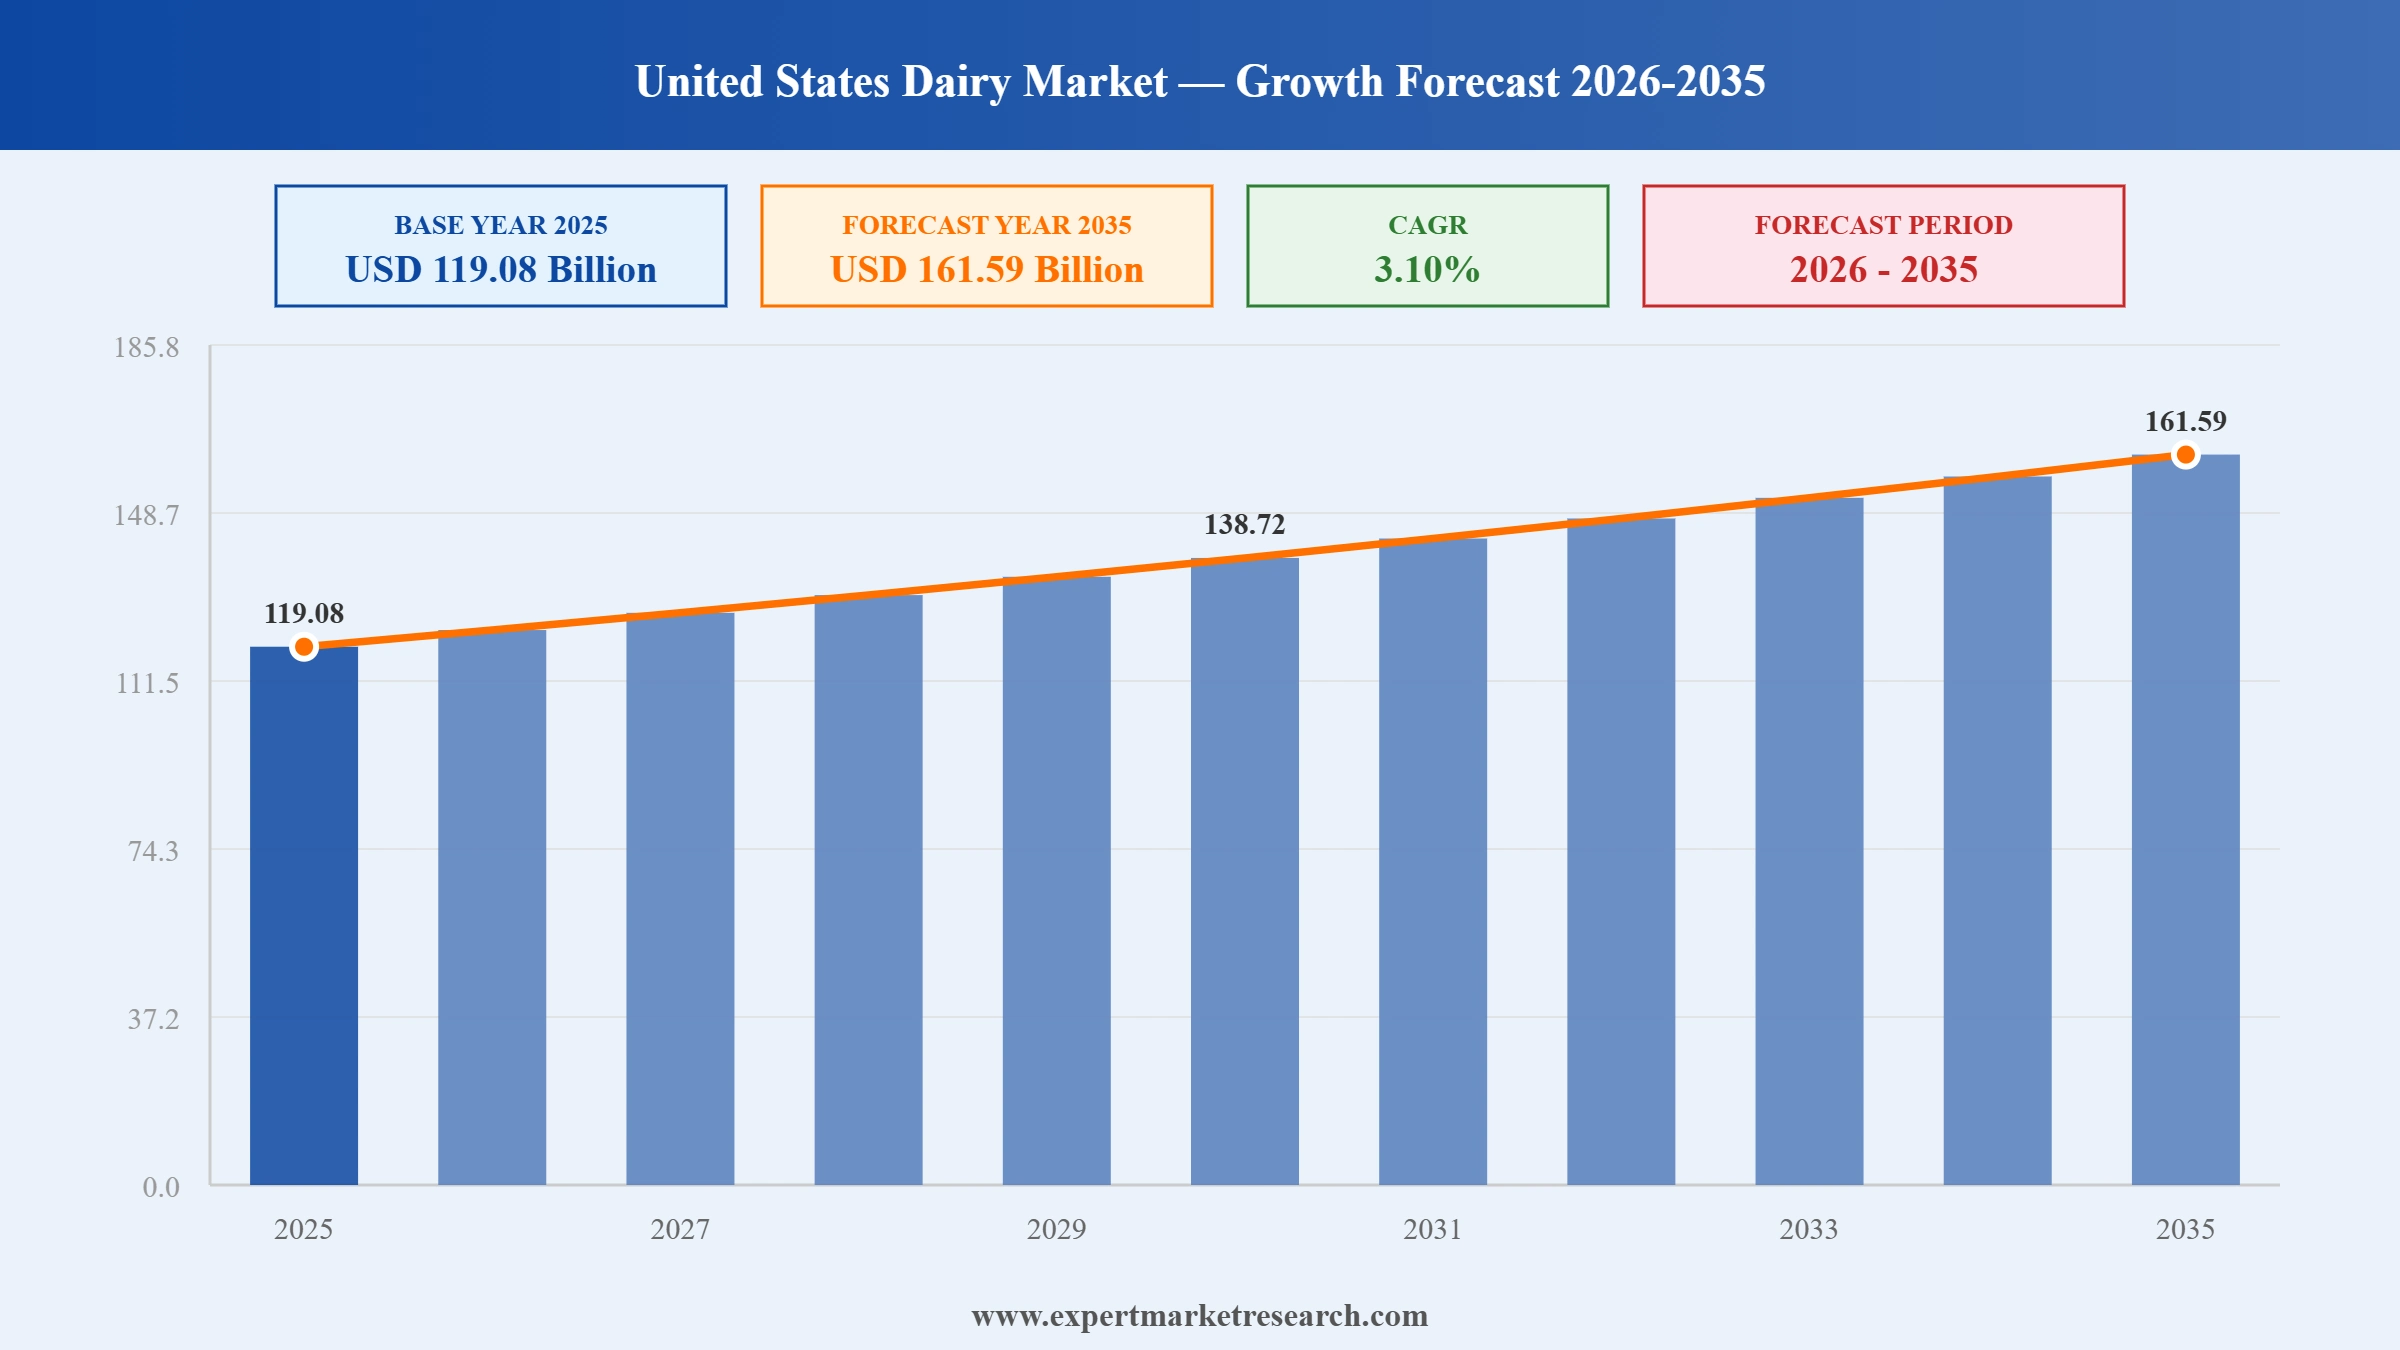
The United States dairy market reached a value of USD 119.08 Billion at 2025 and is projected to expand at a CAGR of around 3.10% during the forecast period of 2026-2035. Growth is driven by consistent demand for high-protein and value-added dairy products, significant cooperative manufacturing investment, growing exports of US dairy powders and whey protein to Asian and Latin American markets, and the structural scale advantages of farmer-owned cooperatives, pushing the market toward USD 161.59 Billion by 2035.
Read more about this report - REQUEST FREE SAMPLE COPY IN PDF
The United States dairy market is experiencing meaningful capacity investment as major processors and cooperatives commit substantial capital to new manufacturing facilities, driven by growing demand for value-added dairy and expanding export opportunities. The market's diversified product range provides resilience against sector-specific demand fluctuations.
Saputo Inc. completed the sale of its majority stake in the Argentina dairy division to Gloria Foods in February 2026 for approximately USD 630 million.
California Dairies, Inc. celebrated the grand opening of its Valley Natural Beverages plant in Bakersfield in May 2025, a 200,000-square-foot facility processing an estimated 116,000 gallons of local milk daily across three lines producing extended shelf life and shelf-stable milk products.
Chobani announced in April 2025 a USD 1.2 billion investment to construct a 1.4 million-square-foot dairy manufacturing facility in Rome, New York, described by Governor Hochul as the largest natural food manufacturing investment in American history. The facility will produce over one billion pounds of dairy products annually and create more than 1,000 new jobs, positioning Chobani to serve growing US and international demand for Greek-style yoghurt and value-added dairy.
Arla Foods Ingredients finalised a contract manufacturing agreement with Valley Queen in early 2025, designating the South Dakota processor to produce its Nutrilac ProteinBoost whey protein concentrate range for the US functional food and sports nutrition markets. The partnership combines Arla's European dairy ingredient expertise with Valley Queen's established US dairy processing capabilities.
Farmer-owned cooperatives, led by Dairy Farmers of America, represent the foundational supply chain structure of the US dairy market, pooling milk across nearly 15,000 member farms in 48 states for scale efficiencies that private processors cannot easily replicate. Cooperatives are increasingly investing directly in value-added dairy manufacturing to capture higher margins from members' milk, reducing dependence on third-party processing.
Value-added dairy products including Greek-style yoghurt, specialty cheese, and whey protein are the most dynamic growth segments, commanding considerably higher price points than commodity dairy. Chobani-pioneered Greek yoghurt has driven yoghurt category premiumisation and manufacturing investment.
California remains the largest dairy-producing state by raw milk volume, with the Far West region collectively accounting for a significant share of national output. California Dairies Inc.'s USD 200 million-plus Valley Natural Beverages investment demonstrates the region's commitment to expanding value-added processing capacity.
Organic dairy is one of the fastest-growing premium segments in the US market, driven by consumer preference for clean labels, animal welfare assurances, and absence of synthetic hormones. Organic fluid milk and yoghurt have gained meaningful market share, with organic price premiums sustaining higher margins for certified producers.
The United States has become an increasingly significant global dairy export supplier, particularly for non-fat dry milk, whey protein, and lactose ingredients, as production growth creates exportable surpluses. Asian markets including China, Japan, and Southeast Asia are growing US dairy powder importers.
The report of the Expert Market Research's titled "United States Dairy Market Report and Forecast 2026-2035" offers a detailed analysis of the market based on the following segments:
Market Breakup by Product
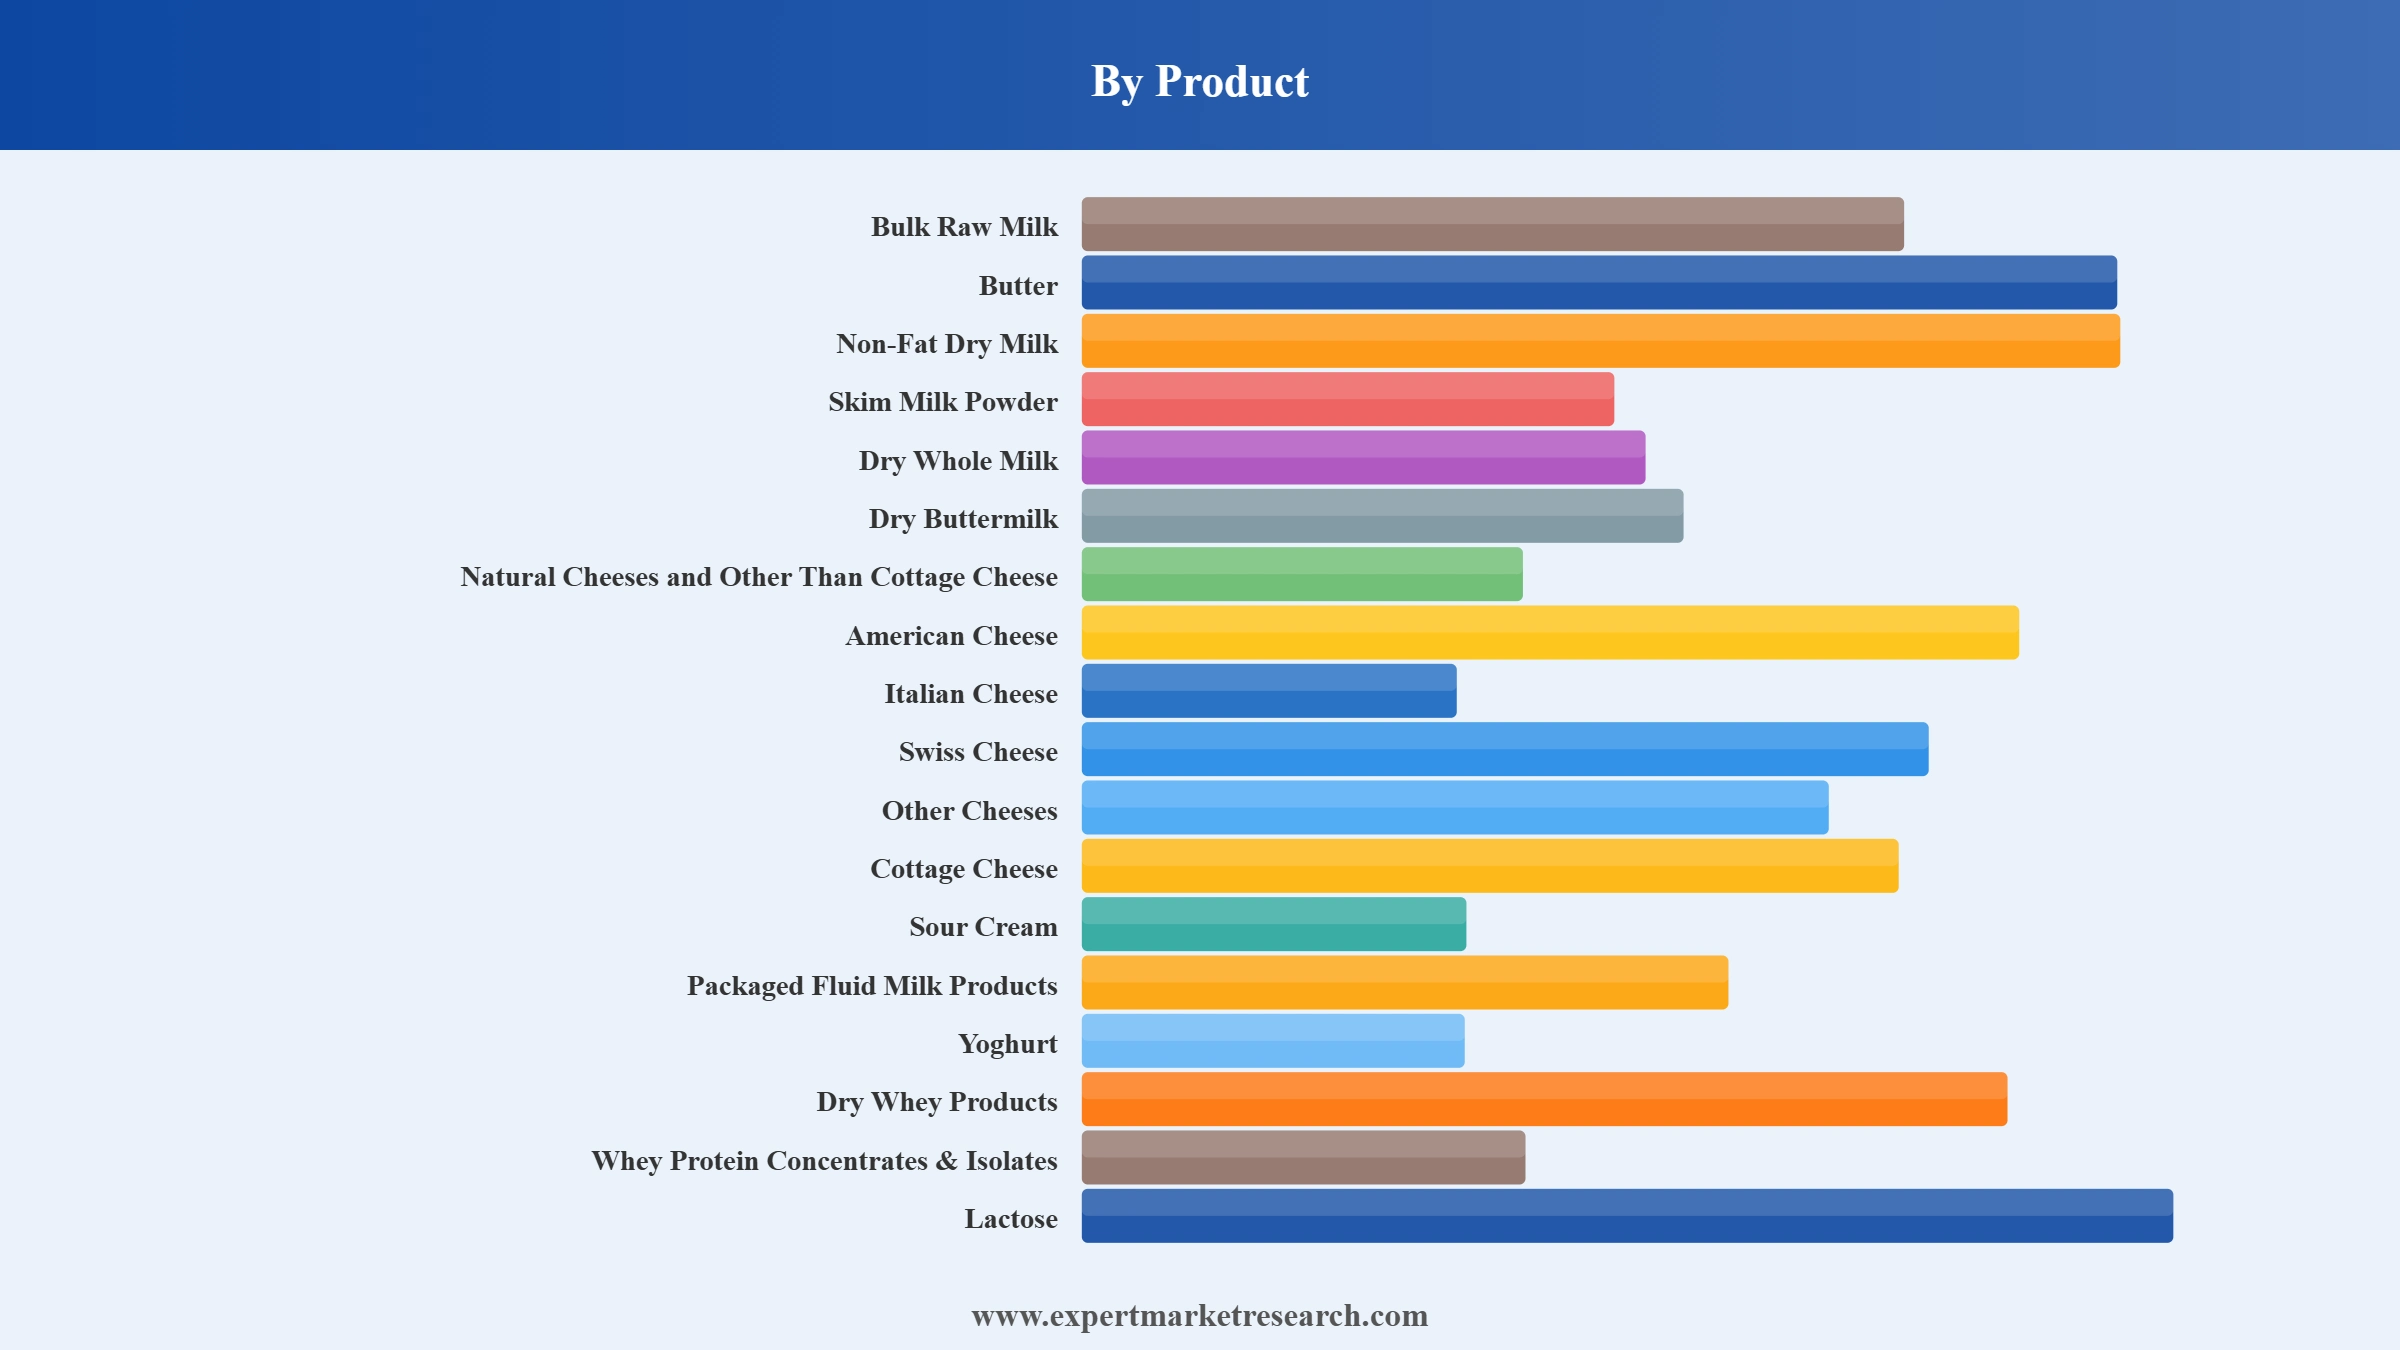
Key Insight: Packaged fluid milk holds a foundational share, while natural cheeses including American, Italian, and Swiss varieties form the largest value pool. Yoghurt is the fastest-growing consumer segment on Greek-style and probiotic launches.
Market Breakup by Structure
Key Insight: Co-operative dairies hold the dominant structural share, anchored by Dairy Farmers of America and California Dairies pooling milk from thousands of farmer-owners. Private dairies including Saputo, Schreiber Foods, Hilmar Cheese, and Land O’Lakes hold significant branded and ingredient processing capacity.
Market Breakup by Region
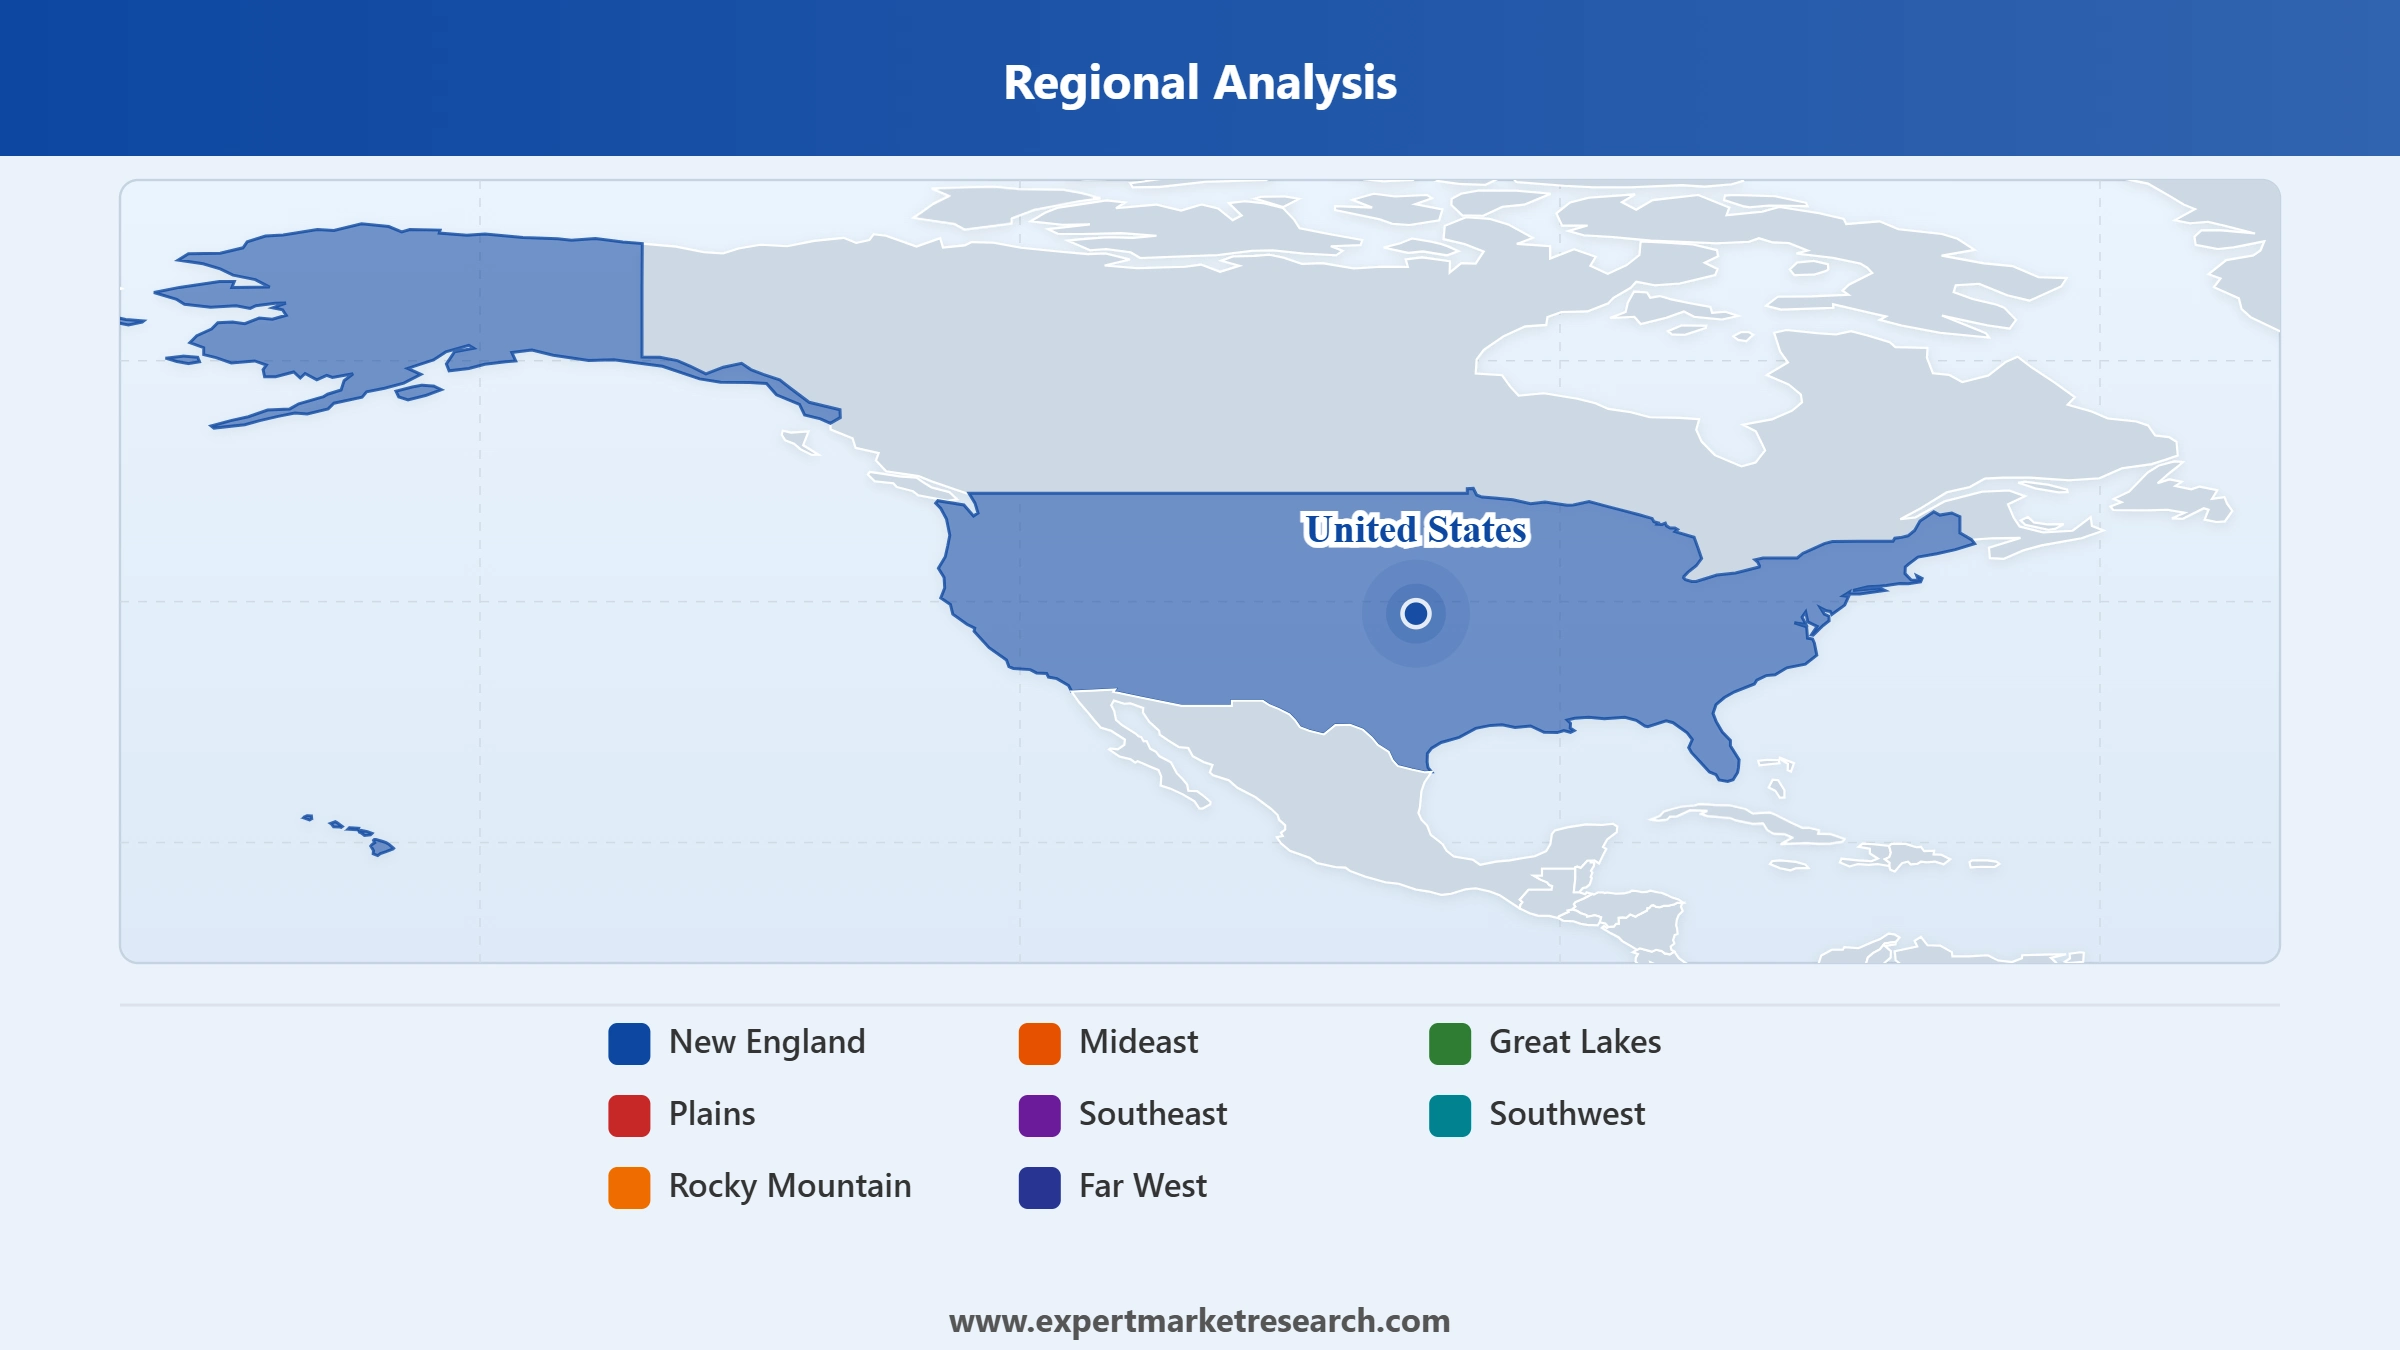
Key Insight: The Mideast and Great Lakes regions together hold the largest share, anchored by Wisconsin, New York, and Pennsylvania production. The Far West is the largest single-region producer through California’s large-scale herds and processing base.


Read more about this report - REQUEST FREE SAMPLE COPY IN PDF
By Product, Natural Cheeses and Packaged Fluid Milk Products collectively account for the dominant share of the market due to American cheese's large foodservice footprint and fluid milk's foundational household role
Natural cheeses together form the largest value pool, backed by pizza, foodservice, and snacking applications deeply embedded in American cuisine. Packaged fluid milk holds a foundational volume share through universal household presence and school nutrition mandates, even as per-capita consumption has moderated amid plant-based competition. Yoghurt is the fastest-growing consumer segment, led by Greek-style and probiotic launches.
Read more about this report - REQUEST FREE SAMPLE COPY IN PDF
The United States dairy market's eight regional zones reflect significant geographic specialisation in dairy production and processing, shaped by climate, land economics, milk hauling cost structures, and proximity to major consumption centres.
The Far West dominates the United States dairy market backed by California's large-scale, technologically advanced dairy operations and the region's structural advantages in both domestic supply and Pacific export market access.
The Far West region, led by California as the nation's leading dairy state, accounts for the largest share of US raw milk production through large-scale, highly efficient operations. California Dairies Inc. and Dairy Farmers of America anchor cooperative dairy processing.
The Great Lakes region, covering Wisconsin and Michigan, is the historical heartland of US cheese production, with Wisconsin's 1,200+ licensed cheesemakers and Cheese Board certification which supports its premium specialty cheese positioning. The Plains region has emerged as a growing dairy ingredient manufacturing zone, as demonstrated by the Valley Queen-Arla Foods Nutrilac ProteinBoost contract manufacturing agreement in Millbank, South Dakota.
Read more about this report - REQUEST FREE SAMPLE COPY IN PDF
The United States dairy market features a competitive mix of large farmer-owned cooperatives, multinational dairy corporations, and regional processors competing across commodity and value-added categories.
Founded in 1866 and headquartered in Vevey, Nestlé S.A. maintains significant United States dairy operations through coffee creamer, condensed milk, and dairy-based culinary product portfolios, alongside co-ownership of Froneri, one of the world's largest ice cream companies.
Founded in 1998 and headquartered in Kansas City, Kansas, Dairy Farmers of America Inc. is the largest US dairy cooperative, serving nearly 15,000 farmer-members across 9,000+ dairy farms in 48 states.
Founded in 1919 and headquartered in Paris, Danone S.A. is among the most commercially significant yoghurt and dairy companies in the United States, operating Activia, Oikos, and Two Good through its North American segment, which recorded 5.4% like-for-like sales growth.
Founded in 1933 and headquartered in Laval, France, Lactalis Group has built a significant US dairy presence through acquisitions including the Kraft Natural Cheese business, making it one of the country's leading cheese manufacturers.
Other leading companies in the United States dairy market include Land O'Lakes Inc., The Kraft Heinz Company, Schreiber Foods Inc., California Dairies Inc., and others.
*Please note that this is only a partial list; the complete list of key players is available in the full report. Additionally, the list of key players can be customized to better suit your needs.*
Get the full picture of the United States dairy market with our comprehensive report for 2026-2035. Explore regional production dynamics, product category trends, cooperative vs private dairy competitive dynamics, and the capital investment signals influencing the future of US dairy. Download your free sample today.
Upto 15% Off
USD
$2499 $2249
$3999 $3599
$4999 $4249
$5999 $5099


*While we strive to always give you current and accurate information, the numbers depicted on the website are indicative and may differ from the actual numbers in the main report. At Expert Market Research, we aim to bring you the latest insights and trends in the market. Using our analyses and forecasts, stakeholders can understand the market dynamics, navigate challenges, and capitalize on opportunities to make data-driven strategic decisions.*
In 2025, the market attained a value of nearly USD 119.08 Billion.
The major drivers of the industry include rising population, robust and mounting market share of American sellers of milk and other dairy products over other sectors because of lowering prices of dairy products.
The declining dairy demand from China, bringing in buyers from Southeast Asia, is expected to be a key trend guiding the growth of the industry.
The regional markets for United States dairy industry are New England, Mideast, Great Lakes, Plains, Southeast, Southwest, Rocky Mountain, and Far West.
The product types of dairy available are bulk raw milk, butter, non-fat dry milk, skim milk powder, dry whole milk, dry buttermilk, natural cheeses and other than cottage cheese, American cheese, Italian cheese, swiss cheese, other (specialty) cheeses, cottage cheese, sour cream, packaged fluid milk products, yoghurt, dry whey products, whey protein concentrates and isolates, and lactose.
The leading players in this market are Nestlé S.A., Dean Foods Company, Danone S.A., Dairy Farmers of America, Land O'Lakes, Inc., The Kraft Heinz Company, Schreiber Foods Inc., and California Dairies, Inc., amongst others.
The market is estimated to witness a healthy growth in the forecast period of 2026-2035 to reach about USD 161.59 Billion by 2035.
The market is assessed to grow at a CAGR of 3.10% between 2026 and 2035.
Explore our key highlights of the report and gain a concise overview of key findings, trends, and actionable insights that will empower your strategic decisions.
| REPORT FEATURES | DETAILS |
| Base Year | 2025 |
| Historical Period | 2019-2025 |
| Forecast Period | 2026-2035 |
| Scope of the Report |
Historical and Forecast Trends, Industry Drivers and Constraints, Historical and Forecast Market Analysis by Segment:
|
| Breakup by Product |
|
| Breakup by Structure |
|
| Breakup by Region |
|
| Market Dynamics |
|
| Competitive Landscape |
|
| Companies Covered |
|
| Report Price and Purchase Option | Explore our purchase options that are best suited to your resources and industry needs. |
| Delivery Format | Delivered as an attached PDF and Excel through email, with an option of receiving an editable PPT, according to the purchase option. |
Datasheet
One User
USD 2,499
USD 2,249
tax inclusive*
Single User License
One User
USD 3,999
USD 3,599
tax inclusive*
Five User License
Five User
USD 4,999
USD 4,249
tax inclusive*
Corporate License
Unlimited Users
USD 5,999
USD 5,099
tax inclusive*
*Please note that the prices mentioned below are starting prices for each bundle type. Kindly contact our team for further details.*
Flash Bundle
Small Business Bundle
Growth Bundle
Enterprise Bundle
*Please note that the prices mentioned below are starting prices for each bundle type. Kindly contact our team for further details.*
Flash Bundle
Number of Reports: 3
20%
tax inclusive*
Small Business Bundle
Number of Reports: 5
25%
tax inclusive*
Growth Bundle
Number of Reports: 8
30%
tax inclusive*
Enterprise Bundle
Number of Reports: 10
35%
tax inclusive*
How To Order

Select License Type
Choose the right license for your needs and access rights.

Click on ‘Buy Now’
Add the report to your cart with one click and proceed to register.

Select Mode of Payment
Choose a payment option for a secure checkout. You will be redirected accordingly.
Strategic Solutions for Informed Decision-Making
Gain insights to stay ahead and seize opportunities.

Get insights & trends for a competitive edge.

Track prices with detailed trend reports.

Analyse trade data for supply chain insights.

Leverage cost reports for smart savings

Enhance supply chain with partnerships.

Connect For More Information
Our expert team of analysts will offer full support and resolve any queries regarding the report, before and after the purchase.
Our expert team of analysts will offer full support and resolve any queries regarding the report, before and after the purchase.
We employ meticulous research methods, blending advanced analytics and expert insights to deliver accurate, actionable industry intelligence, staying ahead of competitors.
Our skilled analysts offer unparalleled competitive advantage with detailed insights on current and emerging markets, ensuring your strategic edge.
We offer an in-depth yet simplified presentation of industry insights and analysis to meet your specific requirements effectively.


