Consumer Insights
Uncover trends and behaviors shaping consumer choices today
Procurement Insights
Optimize your sourcing strategy with key market data
Industry Stats
Stay ahead with the latest trends and market analysis.
The Vietnam smartphone market attained a value of USD 4.06 Billion in 2025 and is projected to grow at a CAGR of 1.40% through 2035. The market is further expected to reach USD 4.67 Billion by 2035. Rising 5G adoption, a steady shift toward premium devices, and expanding local electronics manufacturing are supporting growth in the market.
Demand for smartphones in Vietnam rests on a young, digitally active population that uses phones for messaging, shopping, banking, and entertainment. Rising incomes, expanding 5G networks, and growing use of mobile payments are encouraging upgrades, while the Vietnam smartphone market is moving from first time adoption toward replacement and premium purchases.
At the same time, network quality is shaping what buyers choose. In August 2025, Ookla ranked Vietnam's mobile networks among the fastest in the world, with a national average download speed of 75.19 Mbps, which supports demand for 5G capable handsets and data heavy services such as video and gaming. Faster networks also encourage users to upgrade older phones, which lifts replacement demand in cities and provinces and gives brands a reason to promote stronger cameras, batteries, and processors.
Leading handset brands and electronics groups are directing growth capital toward local assembly, component supply, and retail partnerships rather than single devices. Expansion of production lines, premium launches, and omnichannel distribution are now central to competitive positioning in the Vietnam smartphone market, as companies seek stable supply and wider reach across provinces.

Read more about this report - REQUEST FREE SAMPLE COPY IN PDF
|
Vietnam Smartphone Market Report Summary |
Description |
Value |
|
Base Year |
USD Billion |
2025 |
|
Historical period |
USD Billion |
2019-2025 |
|
Forecast Period |
USD Billion |
2026-2035 |
|
Market Size 2025 |
USD Billion |
4.06 |
|
Market Size 2035 |
USD Billion |
4.67 |
|
CAGR 2019-2025 |
Percentage |
XX% |
|
CAGR 2026-2035 |
Percentage |
1.40% |
|
CAGR 2026-2035 - Market by Operating System |
Android |
1.6% |
|
CAGR 2026-2035 - Market by Distribution Channel |
Online Channels |
1.7% |
Foxconn committed a further USD 265 million to its Vietnam operations in August 2026, taking its expected total investment in the country to nearly USD 5 billion. Companies across the Vietnam smartphone market can leverage this trend by expanding assembly and component capacity close to growing export markets, which shortens delivery times, supports local sourcing, and strengthens supply relationships with global handset brands and suppliers.
Samsung launched the Galaxy S26 series at a Hanoi event in March 2026, with prices starting from VND 21.99 million for the S26, VND 25.49 million for the S26+, and VND 31.49 million for the S26 Ultra. Companies across the Vietnam smartphone market can leverage this trend by holding local launch events with retail partners, which builds early demand and supports premium pricing for flagships.
OPPO launched the Reno15 series in Vietnam in January 2026, with the Reno15 F 5G priced at VND 11.99 million and the Reno15 5G at VND 14.49 million, backed by a three-week pre-order campaign. Companies across the market can leverage this trend by pricing mid-range 5G devices sharply and running pre-orders, which captures early buyers and tests demand before full market availability.
Honor launched the Magic V5 foldable in Vietnam in October 2025, powered by a Snapdragon 8 Elite chip and a 5,150 mAh battery. Companies across the Vietnam smartphone market can leverage this trend by bringing foldables to local buyers early, which positions the brand in the premium segment and builds interest among consumers who are ready to move beyond conventional slab designs in everyday use.
Operators and regulators across the Vietnam smartphone market are retiring older networks to free spectrum for faster services. Handset buyers who still use basic phones are being pushed toward 4G and 5G devices. In September 2026, the Ministry of Science and Technology began a nationwide 2G shutdown, after new 2G only devices stopped being activated in October 2024, with 900 MHz spectrum to be reassigned to 4G and 5G. The shutdown creates a clear upgrade cycle for entry level smartphones and supports 5G ready models.
Online marketplaces across the Vietnam smartphone market are becoming a main route for electronics as buyers compare prices and delivery offers. Sellers are using live video and campaigns to reach younger shoppers. In July 2026, TikTok Shop reported that its 2025 Vietnam sales rose 66%, with electronics sales up 71%, buyers up 36%, and sellers up 42%. Platform campaigns also give buyers quick price comparisons, flexible payment options, and delivery tracking. Faster platform growth gives smartphone brands another direct channel for promotions and bundled accessories.
Mobile operators across the Vietnam smartphone market are adding base stations to extend 5G beyond major cities. Wider coverage is raising the value of 5G capable handsets for everyday users. In July 2025, MobiFone reported more than 2.5 million active 5G users and plans for 10,000 more base stations, while about 11,000 5G stations across all operators covered about 26% of the population. Broader coverage gives handset brands a stronger case for selling 5G models. Device bundles also lower upfront costs for new 5G subscribers.
Global electronics groups across the Vietnam smartphone market are adding plants and lines in northern Vietnam to serve smartphone supply chains. Local production strengthens component supply and export capacity. In November 2025, Luxshare ICT said it planned a Vietnam expansion expected to generate revenue above USD 10 billion, with registered capital of USD 1.8 billion to date and a USD 208 million Nghe An project. Larger plants deepen the supplier base for handset makers. Closer supply chains also shorten lead times for new model launches.
Phones and components remain among Vietnam's largest export items. Rising shipments are encouraging brands to keep assembly close to suppliers. In November 2025, the Vietnam Electronic Industries Association reported that phone and parts exports reached USD 50.8 billion, up 5%, in the first ten and a half months of 2025, within electronics exports of nearly USD 143 billion. Strong export performance supports investment in local production capacity and skilled labor. Stable export demand also encourages suppliers to add production lines.
The Expert Market Research's report titled "Vietnam Smartphone Market Report and Forecast 2026-2035" offers a detailed analysis of the market based on the following segments:
Market Breakup by Operating System
Key Insight: Android holds the largest share of the operating system segment, because devices are sold across every price tier and run the social media, e-commerce, and payment apps that buyers use most. iOS is the fastest growing platform as aspirational buyers move toward premium devices and instalment plans. Others cover niche systems with small volumes. In March 2026, vivo made the X300 Ultra available in Vietnam from mid-April 2026 at VND 43.999 million. In January 2026, ASUS confirmed that it would release no new Zenfone or ROG Phone models in 2026.
Market Breakup by Distribution Channel
Key Insight: Retail stores hold the largest share of the distribution channel segment, because buyers want to handle devices and use instalment plans before buying. Specialty stores serve brand focused and premium shoppers. Online channels are the fastest growing at 1.7%, while others include operator outlets and direct sales. In January 2026, FPT Retail reported 2025 revenue of VND 51,083 billion, up 27%, with FPT Shop revenue of VND 16,809 billion across 623 stores. In July 2026, the National Competition Commission asked e-commerce platforms to review fee increases, as first half 2026 e-commerce revenue reached VND 291.6 trillion, up 44.1%.
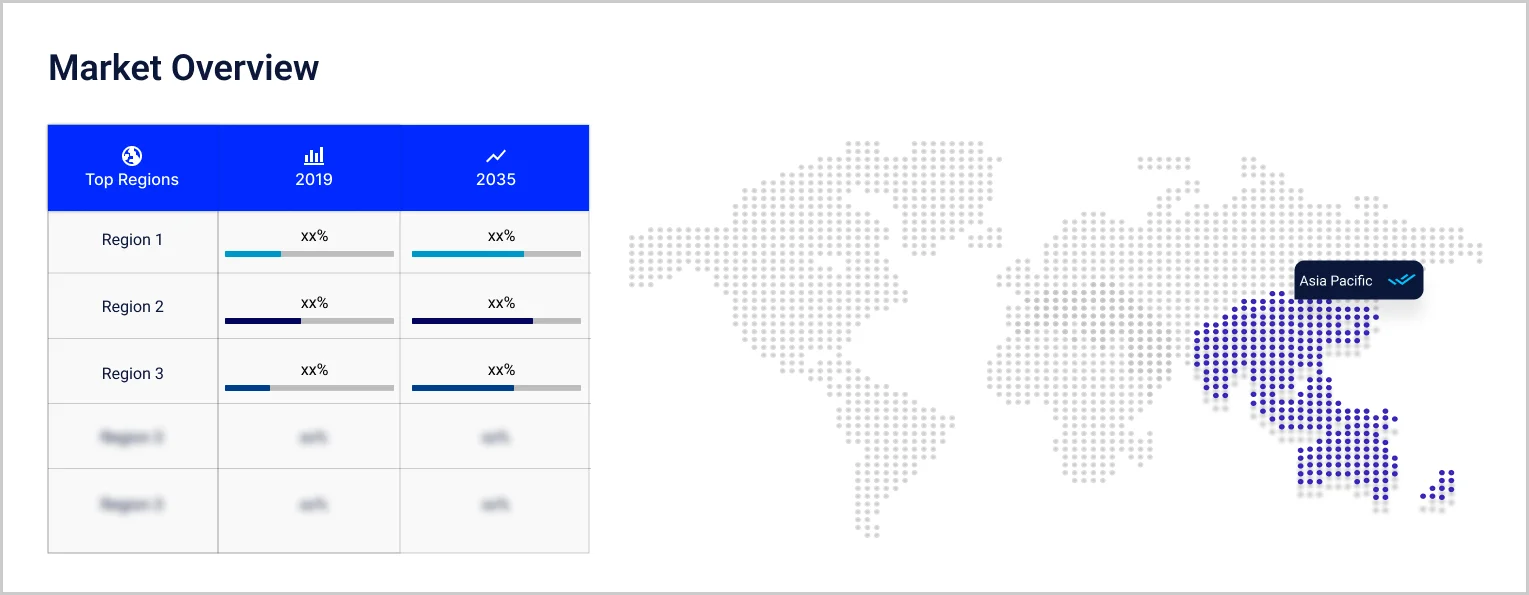
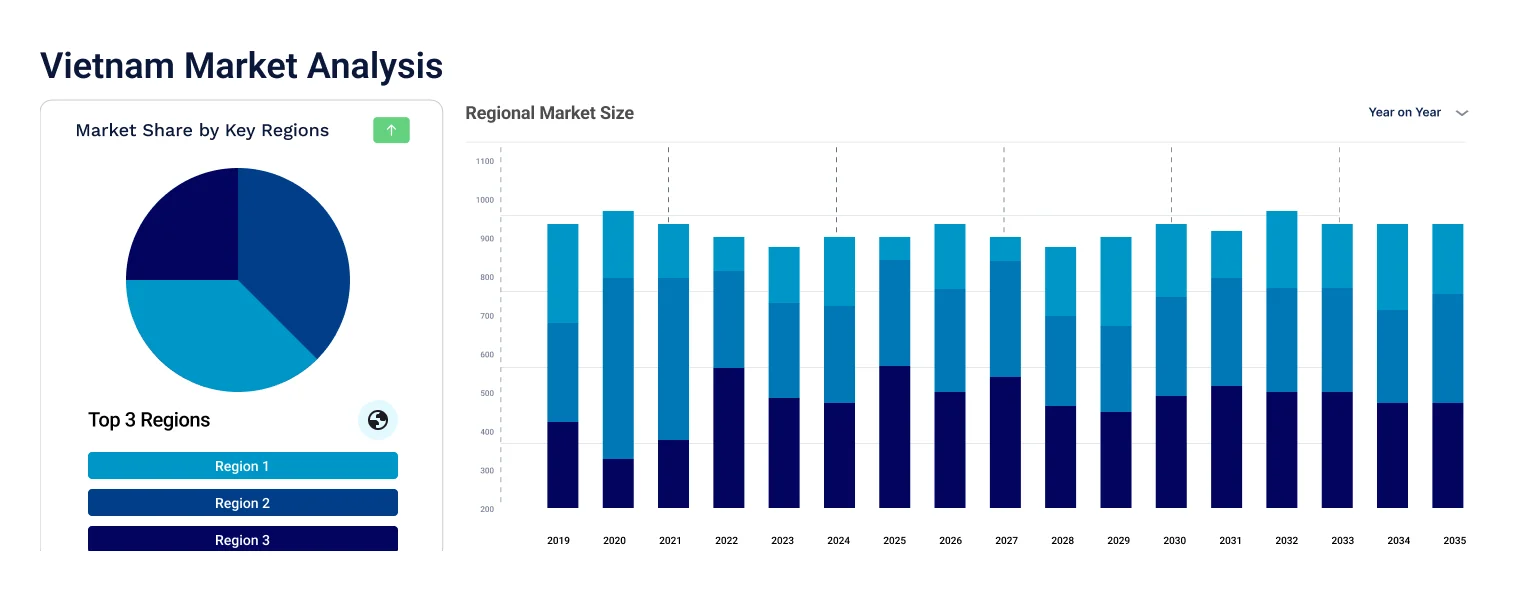
Market Breakup by Region
Key Insight: Southeast holds the largest regional share and is the fastest growing region, anchored by Ho Chi Minh City's spending power and young population. Red River Delta hosts major electronics factories around Hanoi and Bac Ninh. Mekong River Delta and South-Central Coast are growing as retail chains reach provincial cities, while others cover the remaining provinces. In February 2025, a 25% stake in Goertek Electronics Vietnam in Bac Ninh was sold for USD 50 million. In January 2026, CellphoneS opened stores in Dong Nai and Vinh Long. In July 2025, GSMA noted a 15% government subsidy on 5G base station equipment.
Read more about this report - REQUEST FREE SAMPLE COPY IN PDF
By operating system, Android dominates the Vietnam smartphone market owing to availability across every price tier
Android holds the largest share of the operating system segment, because devices span every price tier and support the social media, e-commerce, and payment apps used daily. In January 2026, Xiaomi launched the Redmi Note 15 series in Vietnam from VND 5.19 million, bringing 5G ready hardware to budget buyers. Wide brand choice keeps Android accessible to first time buyers and upgraders. Affordable launches keep switching from basic phones steady. Local assembly also helps brands keep prices competitive across tiers.

Read more about this report - REQUEST FREE SAMPLE COPY IN PDF
iOS is registering the fastest growth within the Vietnam smartphone market, as aspirational buyers move toward premium devices and instalment plans. In September 2025, Vietnam joined the global iPhone 17 launch for the first time, with more than 200,000 units pre-ordered before official sales. Day one availability removes the wait that once pushed buyers toward grey imports. Rising incomes and financing options widen the group able to buy premium phones. Trade in offers help buyers move up from older models.
By distribution channel, retail stores dominate the Vietnam smartphone market owing to hands-on trial and instalment offers
Retail stores hold the largest share of the distribution channel segment, because buyers want to handle devices, compare models, and use instalment plans before buying. In October 2025, Mobile World Group reported third quarter 2025 revenue of VND 39.85 trillion, up 16.9%, the highest quarterly revenue in its history, with electronics at 44.4% of sales. Large chains offer financing, trade ins, and after sales support that online sellers cannot easily match. Store visits also build trust in after sales service.

Read more about this report - REQUEST FREE SAMPLE COPY IN PDF
Online channels are registering the fastest growth within the distribution channel segment at 1.7%, as buyers compare prices and delivery offers on marketplaces. In July 2026, the Ministry of Industry and Trade briefed on the new E-Commerce Law and Decree 248/2026, issued in June 2026, which sets clearer rules for platforms and sellers. Clearer rules build buyer trust, which helps online sales of phones expand. Better consumer protection also encourages cautious buyers to purchase phones online without visiting physical stores.
Southeast commands the largest regional share of the Vietnam smartphone market, supported by Ho Chi Minh City's spending power
Southeast commands the largest regional share of the Vietnam smartphone market, supported by Ho Chi Minh City's spending power, a young population, and early 5G uptake. In March 2025, Viettel reported 5.5 million 5G subscribers by early February 2025, with over 40% of them in Hanoi and Ho Chi Minh City. Dense retail networks and strong 5G coverage keep demand for premium handsets high. Strong spending power and access to new models make the region a first stop for launches.

Read more about this report - REQUEST FREE SAMPLE COPY IN PDF
Southeast is also registering the fastest growth among the regional markets, as 5G devices and instalment plans spread through Ho Chi Minh City and nearby industrial provinces. In April 2025, VNPT VinaPhone reported 3 million active 5G subscribers and 5 million users with 5G capable devices. A large base of capable devices gives buyers a ready path to upgrade as coverage widens. Rising incomes in nearby industrial provinces also support wider adoption of mid-range and premium phones among younger workers.
The competitive landscape remains concentrated, with established Vietnam smartphone companies competing on price tiers, camera quality, 5G readiness, and after sales support across urban and provincial retail. Leading Vietnam smartphone companies continue to invest in local assembly, premium launches, and instalment partnerships to retain loyal buyers while capturing demand from first time smartphone users in faster growing provinces. Many of these firms also rely on wide retail and online networks to keep their phones visible to both new and repeat buyers.
Major Vietnam smartphone market players are also pursuing retail partnerships, operator tie ups, and AI features to strengthen their footprint across both established and emerging provinces. Continued emphasis on camera performance, battery life, and local service networks is allowing established brands to defend their position with urban buyers while building deeper presence in smaller cities. Partnerships with operators, retailers, and local assemblers are also helping them manage costs, secure supply, and reach buyers faster.
Founded in 1976 and headquartered in Cupertino, California, United States, Apple Inc. supplies the market through the iPhone range, supported by its iOS ecosystem of apps, services, and accessories. The company sells through authorized resellers, carrier partners, and online channels, and attracts premium buyers who value design, privacy, and long software support.
Founded in 1969 and headquartered in Suwon, South Korea, Samsung Electronics Co., Ltd. supplies the market through its Galaxy range, from entry level A series phones to foldables and flagship models. The company assembles a large share of its global phones in northern Vietnam and sells through carriers, retail chains, and online stores.
Founded in 2010 and headquartered in Beijing, China, Xiaomi Corporation supplies the market through its Xiaomi, Redmi, and POCO ranges, which focus on value pricing and strong specifications. The company sells through authorized retailers, online marketplaces, and branded stores, and supports buyers with local service centers.
Founded in 1987 and headquartered in Shenzhen, Guangdong, China, Huawei Technologies Co., Ltd. supplies the market through its Pura, Mate, and nova phones alongside wearables and tablets. The company sells through authorized retail partners and online channels and builds its offer around its own software ecosystem and camera technology.
Other key players in the market include Alphabet Inc., Nothing Technology Limited, ASUSTeK Computer Inc., Lenovo Group Ltd., HTC Corporation, and Sony Group Corp., among others.
*Please note that this is only a partial list; the complete list of key players is available in the full report. Additionally, the list of key players can be customized to better suit your needs.*
Unlock the latest insights with our Vietnam smartphone market trends 2026 report. Discover regional growth patterns, premium device shifts, channel trends, and key industry players. Stay ahead of competition with trusted data and expert analysis. Download your free sample report today and drive informed decisions in the market.
Refurbished & Used Mobile Phones Market
Ultra-Secure Smartphone Market
Vietnam Smartphone Enterprise Adoption Outlook
Vietnam Smartphone Software Trends
Vietnam Smartphone Retail Outlook


Upto 15% Off
USD
$2499 $2249
$3999 $3599
$4999 $4249
$5999 $5099


*While we strive to always give you current and accurate information, the numbers depicted on the website are indicative and may differ from the actual numbers in the main report. At Expert Market Research, we aim to bring you the latest insights and trends in the market. Using our analyses and forecasts, stakeholders can understand the market dynamics, navigate challenges, and capitalize on opportunities to make data-driven strategic decisions.*
The market reached a value of USD 4.06 Billion in 2025.
The market is projected to grow at a CAGR of 1.40% between 2026 and 2035, reaching USD 4.67 Billion by 2035.
The market is estimated to witness healthy growth in the forecast period of 2026-2035 to reach a value of around USD 4.67 Billion by 2035.
The major drivers of the market are the growing investments, rapid urbanization, and expansion of digital infrastructure.
The key trends of the market include expansion of 5G networks, higher purchasing power and manufacturing of affordable phones.
The major regions in the market are Southeast, Red River Delta, Mekong River Delta, and South Central Coast.
The various operating types considered in the market report are Android, iOS, and others.
The various distribution channels considered in the market report are specialty stores, retail stores, online channels, and others.
Key players in the market include Apple Inc., Alphabet Inc., Samsung Electronics Co., Ltd., Xiaomi Corporation, Nothing Technology Limited, ASUSTeK Computer Inc., Lenovo Group Ltd., Huawei Technologies Co., Ltd., HTC Corporation, and Sony Group Corp.
Android leads the market by operating system, while iOS is the fastest growing platform.
Southeast leads the market by region and is also registering the fastest growth.
Explore our key highlights of the report and gain a concise overview of key findings, trends, and actionable insights that will empower your strategic decisions.
| REPORT FEATURES | DETAILS |
| Base Year | 2025 |
| Historical Period | 2019-2025 |
| Forecast Period | 2026-2035 |
| Scope of the Report |
Historical and Forecast Trends, Industry Drivers and Constraints, Historical and Forecast Market Analysis by Segment:
|
| Breakup by Operating System |
|
| Breakup by Distribution Channel |
|
| Breakup by Region |
|
| Market Dynamics |
|
| Competitive Landscape |
|
| Companies Covered |
|
Datasheet
One User
USD 2,499
USD 2,249
tax inclusive*
Single User License
One User
USD 3,999
USD 3,599
tax inclusive*
Five User License
Five User
USD 4,999
USD 4,249
tax inclusive*
Corporate License
Unlimited Users
USD 5,999
USD 5,099
tax inclusive*
*Please note that the prices mentioned below are starting prices for each bundle type. Kindly contact our team for further details.*
Flash Bundle
Small Business Bundle
Growth Bundle
Enterprise Bundle
*Please note that the prices mentioned below are starting prices for each bundle type. Kindly contact our team for further details.*
Flash Bundle
Number of Reports: 3
20%
tax inclusive*
Small Business Bundle
Number of Reports: 5
25%
tax inclusive*
Growth Bundle
Number of Reports: 8
30%
tax inclusive*
Enterprise Bundle
Number of Reports: 10
35%
tax inclusive*
How To Order

Select License Type
Choose the right license for your needs and access rights.

Click on ‘Buy Now’
Add the report to your cart with one click and proceed to register.

Select Mode of Payment
Choose a payment option for a secure checkout. You will be redirected accordingly.
Strategic Solutions for Informed Decision-Making
Gain insights to stay ahead and seize opportunities.
Get insights & trends for a competitive edge.
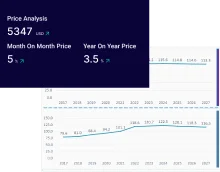
Track prices with detailed trend reports.
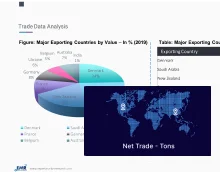
Analyse trade data for supply chain insights.
Leverage cost reports for smart savings
Enhance supply chain with partnerships.
Connect For More Information
Our expert team of analysts will offer full support and resolve any queries regarding the report, before and after the purchase.
Our expert team of analysts will offer full support and resolve any queries regarding the report, before and after the purchase.
We employ meticulous research methods, blending advanced analytics and expert insights to deliver accurate, actionable industry intelligence, staying ahead of competitors.
Our skilled analysts offer unparalleled competitive advantage with detailed insights on current and emerging markets, ensuring your strategic edge.
We offer an in-depth yet simplified presentation of industry insights and analysis to meet your specific requirements effectively.