Consumer Insights
Uncover trends and behaviors shaping consumer choices today
Procurement Insights
Optimize your sourcing strategy with key market data
Industry Stats
Stay ahead with the latest trends and market analysis.
Carbon Black Feedstock prices in Europe, the highest-cost reporting region, eased 2.1% in Q3 2026 to USD 685/MT from USD 700/MT in Q2, as Brent averaged USD 91.33 per barrel, below USD 96.94 in the second quarter, though crude rose from USD 72 on 1 July to over USD 100 on 9 September and USD 109 in mid-September, with spot prices at USD 132. US prices eased 1.5% to USD 640/MT, while China prices rose 0.9% to USD 545/MT. Globally, the average eased from USD 645/MT in Q2 to USD 637/MT in Q3, a 1.2% decline, following a gain of 24.0% in Q2. For H2 2026, this market is expected to rise in the fourth quarter, with Brent near USD 115 at the end of September and an EIA forecast of USD 105 for the fourth quarter lifting decant oil and coal tar feedstock costs.
Carbon Black Feedstock is the heavy, aromatic oil used to make carbon black in the furnace process, mainly decant oil from fluid catalytic cracking, ethylene cracker tar, and coal tar distillates, with high aromaticity and low sulfur preferred. It is burned in reactors to make carbon black for tires, rubber goods, plastics, inks, and coatings. Because it is a refinery and coking by-product, this market follows crude oil and diesel prices, refinery run rates, and carbon black demand from tires. Crude oil prices and refinery run rates, tire and rubber demand, and coal tar supply are what drive prices in this market.
The outlook for Carbon Black Feedstock through the end of 2026 is for higher prices. Brent closed September near USD 115 after averaging USD 91.33 for the quarter, the EIA forecasts USD 105 for the fourth quarter, and tight diesel markets constrain decant oil supply. Buyers are expected to keep procurement plans flexible, tracking feedstock and freight conditions closely through the fourth quarter.
The main upside risk is renewed supply disruptions or a strike on export infrastructure. The main downside risk is a drop in crude oil prices and weaker tire demand. Contract negotiations for the coming months are likely to hinge on how feedstock costs and demand evolve. Buyers are expected to keep procurement plans flexible, tracking feedstock and freight conditions closely through the fourth quarter.
| Region | 2026 Price Range (USD/MT) | Outlook |
| Global Average | 560 - 733 | Higher crude and tight diesel markets point to higher feedstock prices |
| Europe | 637 - 733 | Tight refinery supply keeps prices high |
| India | 618 - 712 | Tire demand supports firmness |
| United States | 595 - 685 | Refinery decant oil supply sets the benchmark |
| China | 507 - 583 | Coal tar supply keeps this the most affordable market |
United States Carbon Black Feedstock prices averaged USD 640/MT in Q3 2026, down 1.5% from USD 650/MT in Q2, as Gulf Coast decant oil eased from the second-quarter peak as Brent fell from its spring highs. Buyers held back from fresh commitments and limited procurement to near-term needs, while inventories stayed comfortably supplied across the supply chain.
Why did the price of Carbon Black Feedstock change in Q3 2026 in United States?
US decant oil prices eased about 1.5 percent as Brent averaged USD 91.33 per barrel in the third quarter, below USD 96.94 in the second, although crude rose from USD 72 on 1 July to USD 109 by mid-September and spot reached USD 132. Buyers covered needs selectively as offers adjusted to weekly movements. Market participants continued to monitor feedstock and freight conditions closely for signs of the next directional move.
Europe Carbon Black Feedstock prices averaged USD 685/MT in Q3 2026, the highest of any region tracked here, down 2.1% from USD 700/MT in Q2, as Europe's higher-cost feedstock eased with crude, though supply stayed tight. Sellers offered modest discounts to keep volumes moving, and distributors worked down stocks rather than restocking ahead of the fourth quarter.
Why did the price of Carbon Black Feedstock change in Q3 2026 in Europe?
European carbon black feedstock prices eased about 2 percent in the quarter but rose sharply in September with crude, with tight diesel markets and refinery run constraints limiting decant oil supply. Buyers covered needs selectively as offers adjusted to weekly movements. These conditions were widely expected to remain a key factor shaping offers and procurement planning into the fourth quarter.
India Carbon Black Feedstock prices averaged USD 665/MT in Q3 2026, down 1.5% from USD 675/MT in Q2, as imported feedstock followed international crude lower. Spot activity stayed thin as converters delayed purchases, which kept offers soft and sentiment cautious heading into the final quarter of the year. Regional supply and demand balances continued to evolve as the quarter progressed, keeping price discovery active.
Why did the price of Carbon Black Feedstock change in Q3 2026 in India?
Indian carbon black producers paid about 1.5 percent less for imported decant oil as Brent averaged lower in the quarter, although they faced rising prices into September. Buyers covered needs selectively as offers adjusted to weekly movements. Regional supply and demand balances continued to evolve as the quarter progressed, keeping price discovery active. Market participants continued to monitor feedstock and freight conditions closely for signs of the next directional move.
China Carbon Black Feedstock prices averaged USD 545/MT in Q3 2026, the lowest of the four regions, up 0.9% from USD 540/MT in Q2, as coal tar prices stayed firm as steel output held up, keeping this market the most affordable. Contract negotiations for the fourth quarter opened with sellers seeking further increases, reflecting the tighter cost structure that producers faced through the period.
Why did the price of Carbon Black Feedstock change in Q3 2026 in China?
Chinese coal tar-based feedstock prices rose about 1 percent as coal tar supply stayed tight with steady steel and coking output, while this market stayed the most affordable. Buyers covered needs selectively as offers adjusted to weekly movements. These conditions were widely expected to remain a key factor shaping offers and procurement planning into the fourth quarter.
United States prices rose 25.0% in Q2 2026 to USD 650/MT from USD 520/MT in Q1, within the middle of the range tracked here, as Brent averaged USD 96.94 per barrel and lifted prices. Quarter-end offers reflected the elevated cost base carried over from the first quarter, with demand holding firm and sellers reluctant to concede ground through June.
Why did the price of Carbon Black Feedstock change in Q2 2026 in United States?
In Q2, prices peaked as Brent averaged USD 96.94 per barrel after the Strait of Hormuz closure. US decant oil prices rose with Brent, which averaged USD 96.94 per barrel in Q2. Regional supply and demand balances continued to evolve as the quarter progressed, keeping price discovery active. Market participants continued to monitor feedstock and freight conditions closely for signs of the next directional move.
Europe prices rose 25.0% in Q2 2026 to USD 700/MT from USD 560/MT in Q1, the highest of any region tracked here, as crude and diesel strength lifted prices. Quarter-end offers reflected the elevated cost base carried over from the first quarter, with demand holding firm and sellers reluctant to concede ground through June. Regional supply and demand balances continued to evolve as the quarter progressed, keeping price discovery active.
Why did the price of Carbon Black Feedstock change in Q2 2026 in Europe?
In Q2, prices peaked as Brent averaged USD 96.94 per barrel after the Strait of Hormuz closure. European prices rose with crude and diesel. These conditions were widely expected to remain a key factor shaping offers and procurement planning into the fourth quarter. Regional supply and demand balances continued to evolve as the quarter progressed, keeping price discovery active.
India prices rose 25.0% in Q2 2026 to USD 675/MT from USD 540/MT in Q1, within the middle of the range tracked here, as high crude lifted import costs. Quarter-end offers reflected the elevated cost base carried over from the first quarter, with demand holding firm and sellers reluctant to concede ground through June. Market participants continued to monitor feedstock and freight conditions closely for signs of the next directional move.
Why did the price of Carbon Black Feedstock change in Q2 2026 in India?
In Q2, prices peaked as Brent averaged USD 96.94 per barrel after the Strait of Hormuz closure. Indian prices rose with crude. Market participants continued to monitor feedstock and freight conditions closely for signs of the next directional move. These conditions were widely expected to remain a key factor shaping offers and procurement planning into the fourth quarter.
China prices rose 20.0% in Q2 2026 to USD 540/MT from USD 450/MT in Q1, the lowest of the four regions, as coal tar prices rose with crude. Quarter-end offers reflected the elevated cost base carried over from the first quarter, with demand holding firm and sellers reluctant to concede ground through June. These conditions were widely expected to remain a key factor shaping offers and procurement planning into the fourth quarter.
Why did the price of Carbon Black Feedstock change in Q2 2026 in China?
In Q2, prices peaked as Brent averaged USD 96.94 per barrel after the Strait of Hormuz closure. Chinese prices rose with crude. Regional supply and demand balances continued to evolve as the quarter progressed, keeping price discovery active. Market participants continued to monitor feedstock and freight conditions closely for signs of the next directional move.
Global Carbon Black Feedstock prices fell through 2025 as Brent slid to USD 63 per barrel, then rose sharply through the first half of 2026 as the Middle East war lifted crude, and eased slightly in Q3 on a lower quarterly average despite a late-quarter rally across the regions tracked in this report. Market participants continued to monitor feedstock and freight conditions closely for signs of the next directional move.
| Quarter | Price (USD/MT) | QoQ Change | Direction |
| Q3 2026 | 637 | -1.2% | ↓ Falling |
| Q2 2026 | 645 | +24.0% | ↑ Rising |
| Q1 2026 | 520 | +21.9% | ↑ Rising |
| Q4 2025 | 426 | -7.1% | ↓ Falling |
| Q3 2025 | 459 | +1.1% | ↑ Rising |
| Q4 2026 | In Progress | - | — In Progress |
Carbon Black Feedstock eased across the markets covered in this report through 2025, tracking falling crude oil prices, with the strongest annual move recorded in China before the sharp Q1 2026 move and the Q3 2026 developments that followed. These conditions were widely expected to remain a key factor shaping offers and procurement planning into the fourth quarter.
United States prices eased from about USD 480/MT in Q1 2025 to USD 420/MT by Q4, a decline of roughly 12.5%, the smallest annual move of the four regions. Falling crude oil prices weighed on pricing through the year. Buyers and sellers tracked falling crude oil prices closely through the year, and the pattern left this market positioned for the sharp Q1 2026 move that followed.
Europe prices eased from about USD 520/MT in Q1 2025 to USD 460/MT by Q4, a decline of roughly 11.5%. Falling crude oil prices weighed on pricing through the year. Buyers and sellers tracked falling crude oil prices closely through the year, and the pattern left this market positioned for the sharp Q1 2026 move that followed.
India prices eased from about USD 500/MT in Q1 2025 to USD 440/MT by Q4, a decline of roughly 12.0%. Falling crude oil prices weighed on pricing through the year. Buyers and sellers tracked falling crude oil prices closely through the year, and the pattern left this market positioned for the sharp Q1 2026 move that followed.
China prices eased from about USD 420/MT in Q1 2025 to USD 380/MT by Q4, a decline of roughly 9.5%, the strongest annual move of the four regions. Falling crude oil prices weighed on pricing through the year. Buyers and sellers tracked falling crude oil prices closely through the year, and the pattern left this market positioned for the sharp Q1 2026 move that followed.
Expert Market Research: Your Source for Real-Time Carbon Black Feedstock Price Intelligence
Expert Market Research tracks Carbon Black Feedstock prices continuously across every major producing and consuming region, combining crude oil and diesel price data, refinery run signals, and tire and rubber demand trends into a single, regularly updated view of the market. Our team can help your procurement function benchmark current offers, plan purchases around the trends covered in this report, and build a defensible view of where this carbon black raw material is headed next. Reach out to our team for a tailored briefing or a deeper look at any of the regional markets covered here.


Upto 15% Off
USD
$799 $699


*While we strive to always give you current and accurate information, the numbers depicted on the website are indicative and may differ from the actual numbers in the main report. At Expert Market Research, we aim to bring you the latest insights and trends in the market. Using our analyses and forecasts, stakeholders can understand the market dynamics, navigate challenges, and capitalize on opportunities to make data-driven strategic decisions.*
It is the heavy aromatic oil burned to make carbon black for tires, rubber, plastics, and inks.
The Q3 2026 global average was USD 637/MT, ranging from USD 545/MT in China to USD 685/MT in Europe.
The global average moved from USD 645/MT in Q2 2026 to USD 637/MT in Q3, a -1.2% change.
Brent averaged USD 91.33 per barrel, below the second quarter, although it rallied in September.
The outlook is for higher prices as crude rose near USD 115 in September.
China holds the lowest cost, while Europe carries the highest cost given tight refinery supply.
This report is updated monthly. Connect with the Expert Market Research team for real-time pricing.
Crude oil and diesel prices, refinery run rates, and tire demand.
The United States, Europe, India, and China are the main sources of feedstock.
Buyers can monitor Brent and diesel prices, and benchmark quotes against this report's ranges.
One Year Subscription
One Year Subscription
USD 799
USD 699
tax inclusive*
*Please note that the prices mentioned below are starting prices for each bundle type. Kindly contact our team for further details.*
Flash Bundle
Small Business Bundle
Growth Bundle
Enterprise Bundle
*Please note that the prices mentioned below are starting prices for each bundle type. Kindly contact our team for further details.*
Flash Bundle
Number of Reports: 3
20%
tax inclusive*
Small Business Bundle
Number of Reports: 5
25%
tax inclusive*
Growth Bundle
Number of Reports: 8
30%
tax inclusive*
Enterprise Bundle
Number of Reports: 10
35%
tax inclusive*
How To Order

Select License Type
Choose the right license for your needs and access rights.

Click on ‘Buy Now’
Add the report to your cart with one click and proceed to register.

Select Mode of Payment
Choose a payment option for a secure checkout. You will be redirected accordingly.
Strategic Solutions for Informed Decision-Making
Gain insights to stay ahead and seize opportunities.
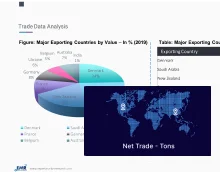
Get insights & trends for a competitive edge.
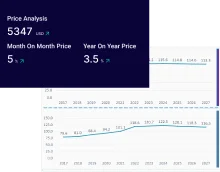
Track prices with detailed trend reports.

Analyse trade data for supply chain insights.

Leverage cost reports for smart savings
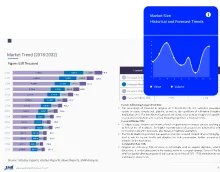
Enhance supply chain with partnerships.
Connect For More Information
Our expert team of analysts will offer full support and resolve any queries regarding the report, before and after the purchase.
Our expert team of analysts will offer full support and resolve any queries regarding the report, before and after the purchase.
We employ meticulous research methods, blending advanced analytics and expert insights to deliver accurate, actionable industry intelligence, staying ahead of competitors.
Our skilled analysts offer unparalleled competitive advantage with detailed insights on current and emerging markets, ensuring your strategic edge.
We offer an in-depth yet simplified presentation of industry insights and analysis to meet your specific requirements effectively.