Consumer Insights
Uncover trends and behaviors shaping consumer choices today
Procurement Insights
Optimize your sourcing strategy with key market data
Industry Stats
Stay ahead with the latest trends and market analysis.
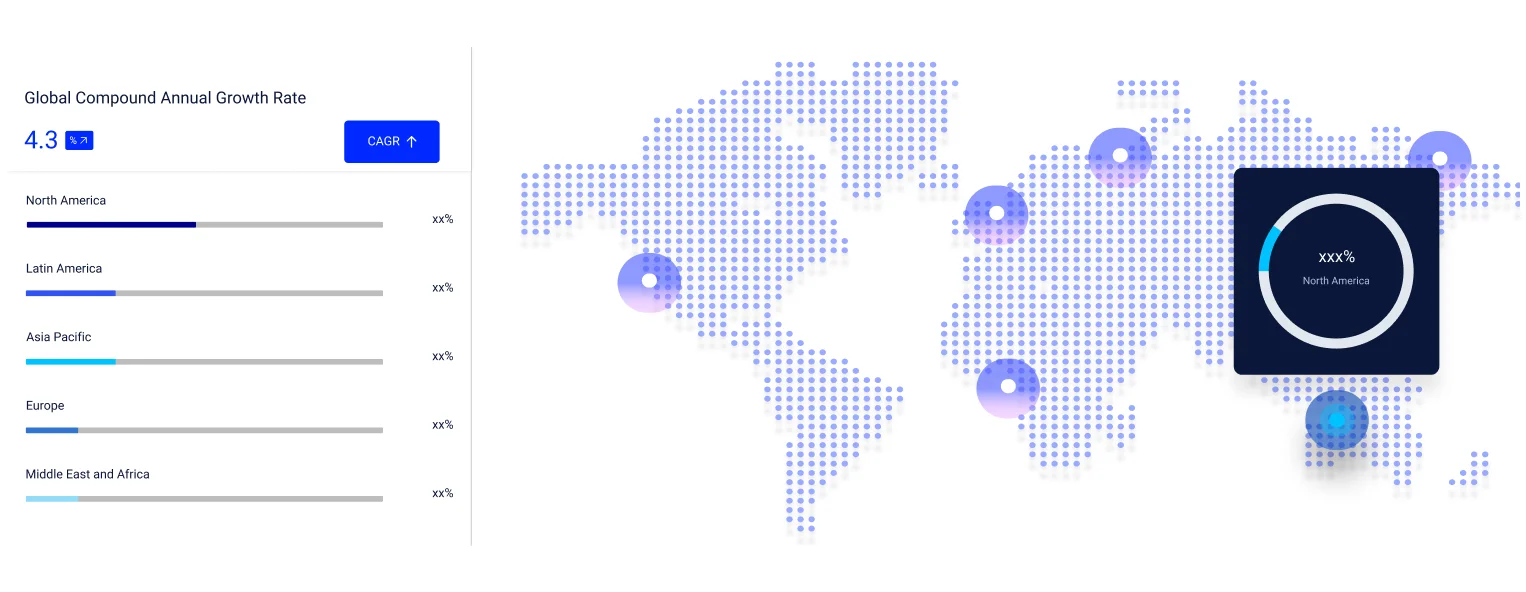
The upcycled food products market was valued at USD 57.50 Billion in 2025. The market is expected to grow at a CAGR of 6.10% during the forecast period of 2026-2035 to reach a value of USD 103.95 Billion by 2035. Rising food waste reduction targets, retailer interest in sustainable ranges, and growing consumer preference for products with a waste saving story are collectively driving the market growth.
The current upcycled food products market dynamics reflect tightening food waste rules, retailer sustainability goals, and shopper interest in products that reduce waste. Policy is central to this shift: the European Union's revised Waste Framework Directive, adopted in September 2025, sets binding national targets for 2030 of a 10% cut in food waste from processing and manufacturing and a 30% cut per capita across retail, restaurants, food services, and households, with transposition due by June 2027. Such targets push manufacturers to find uses for by-products and give upcycled ingredients a clearer commercial case.
The overall upcycled food products market value is also shaped by the scale of food waste. In March 2024, the United Nations Environment Programme's Food Waste Index Report estimated that 1.05 billion tonnes of food were wasted in 2022, about 19% of food available to consumers at retail, food service, and household level, with households accounting for 631 million tonnes. Such volumes give processors large pools of edible by-products, while buyers weigh cost, taste, and safety, and brands add certification to build trust. Companies with reliable by-product supply are better placed.
Compound Annual Growth Rate
6.1%
Value in USD Billion
2026-2035
Read more about this report - REQUEST FREE SAMPLE COPY IN PDF
|
Upcycled Food Products Market Report Summary |
Description |
Value |
|
Base Year |
USD Billion |
2025 |
|
Historical Period |
USD Billion |
2019-2025 |
|
Forecast Period |
USD Billion |
2026-2035 |
|
Market Size 2025 |
USD Billion |
57.50 |
|
Market Size 2035 |
USD Billion |
103.95 |
|
CAGR 2019-2025 |
Percentage |
XX% |
|
CAGR 2026-2035 |
Percentage |
6.10% |
|
CAGR 2026-2035 - Market by Region |
Asia Pacific |
7.8% |
|
CAGR 2026-2035 - Market by Source Material |
Grain and Cereal By-products |
7.4% |
|
CAGR 2026-2035 - Market by Product Type |
Beverages |
8.2% |
|
2025 Market Share by Region |
North America |
37.0% |
The market for upcycled food products is being shaped by new upcycled fruit extracts for beverages from Del Monte and Treatt, a seed round for ValueGrain's brewery based spent grain ingredient plants, funding for B-SIDES upcycled puffs, and the start of broccoli fibre sales by Upcycled Plant Power. Ingredient launches, investor interest, and wider retail reach are further reshaping the competitive landscape for makers and suppliers.
Del Monte and Treatt launched four upcycled fruit extracts, pineapple, watermelon, mango, and cantaloupe, for beverage development. The extracts are made from fruit trimmings left over from Del Monte's fresh cut operations, avoiding waste at the source. Beverage makers can leverage this by using certified fruit extracts to add flavour and an upcycled claim without reworking their existing core formulations.
ValueGrain, a Hamburg startup that turns brewers' spent grain into a baking and meat alternative ingredient, raised a seed round of up to 3.3 million euros, with Krombacher's chief executive investing up to 3 million. Its brewery sited processing plant costs 200,000 to 400,000 euros. Brewers can leverage this by hosting on site processing to earn income from spent grain.
B-SIDES secured 500,000 dollars in seed funding to expand its upcycled puffs, made from oat flour left from oat milk production and corn from grits milling. The brand sells on Amazon, TikTok Shop, and its own site, and is moving into more than 1,500 Northeast retail doors. Snack brands can leverage this by pairing online sales with regional retail rollouts.
Upcycled Plant Power began selling Fiba, a fibre ingredient made from broccoli stems and stalks, to UK foodservice operators. Fiba is up to 55% fibre by weight, and the company plans a 10,000 tonne a year facility in Scotland after raising 3.6 million pounds. Food processors can leverage this by partnering with growers to turn unsold vegetable parts into ingredients.
Precision and biomass fermentation are giving processors a way to turn low value food residues into concentrated, shelf stable ingredients for food makers. For example, in May 2026, Danish startup REDUCED raised 4 million euros, extending its Series A to 12 million euros, to scale fermentation that converts vegetable residues, mushroom stems, and seafood and meat by-products into savoury flavour concentrates. It is working with Royal Greenland on cold water prawn shells and heads, widening the range of usable residues.
Club and warehouse retailers are opening limited time slots to upcycled brands, giving them access to large shopper volumes without a permanent listing in every store. For example, in the first quarter of 2026, Blue Stripes sold limited time Superfruit Gummies at select Costco stores in the Southeast and Northwest United States. The gummies use the whole cacao pod and contain nine vitamins and minerals with no added sugar, showing how upcycled cacao fruit is steadily reaching mainstream retail channels.
Foodservice and premium dessert brands are adding upcycled items to menus to give guests a simple and tasty way to support waste reduction. For example, in April 2026, ice cream maker Salt and Straw ran an Earth Month series of flavours certified by the Upcycled Food Association, built with partner by-products such as potato chips, whey, malted barley milk, and brownie trimmings. The company says the series has rescued over 45,000 pounds of food, helping lift awareness among dessert lovers.
Unclear labelling rules can slow new upcycled launches, so certification bodies and independent testing firms are publishing guidance for makers. For example, in July 2026, TÜV SÜD said the European Union has no specific legal requirement to label food as upcycled, but Regulation (EU) No 1169/2011 still bars misleading claims, and ingredients need correct names such as spent grain flour. It also pointed to voluntary standards, including IFS Food, FSSC 22000, and BRCGS, which helps makers prove safety to buyers.
Frozen food makers are using cosmetically imperfect crops to build premium lines for shoppers who want both organic and waste reducing choices. For example, in March 2026, Roots Farm Fresh expanded its frozen potato range with Organic Sweet Potato Hash Browns, Sweet Potato Tots, and White Potato Hash Browns. The products use organic potatoes rejected for appearance and organic avocado oil, with no added sugars, fillers, or seed oils, widening upcycled choice in the freezer aisle for health conscious households.
The Expert Market Research's report titled "Upcycled Food Products Market Report and Forecast 2026-2035" offers a detailed analysis of the market based on the following segments:
Market Breakup by Source Material
Key Insight: Fruit and vegetable by-products dominate the upcycled food products market by source material, as juicing, canning, and fresh cut operations supply steady pulp, peel, and trimmings, while grain and cereal by-products are the fastest growing on spent grain and oat pulp demand. Dairy by-products include whey, meat and seafood by-products include bones and shells, and nut, seed and oilseed by-products include cacao pulp and press cakes. Showing grain side stream investment, in May 2026, Raisio began a 4.5 million euro Finnish project to turn grain side streams into functional fibre ingredients.
Market Breakup by Product Type
Key Insight: Snacks dominate the upcycled food products market by product type, as chips, puffs, bars, and fruit bites carry upcycled ingredients in high turnover aisles, while beverages are the fastest growing on new canned and functional drinks. Bakery and confectionery use upcycled flours and cocoa fruit, and ingredients and powders serve manufacturers. Showing beverage launches, in July 2026, Trash in the United Kingdom debuted a cold pressed cacao fruit water in a 250 ml can at 3 pounds, made with rescued cacao fruit.
Market Breakup by Nature
Key Insight: Conventional products dominate the upcycled food products market by nature, as most surplus streams come from mainstream processing at larger volumes, while organic is the fastest growing on premium positioning and shopper interest in waste reduction. Showing organic ingredient development, in June 2026, Livoo in Sweden presented organic eco-OATup, an ingredient made from upcycled oat drink pulp and standardised to about 40% protein and 20% fibre on a dry basis.
Market Breakup by Distribution Channel
Key Insight: Supermarkets and hypermarkets dominate the upcycled food products market by distribution channel, as they offer broad reach and private label programs, while online retail is the fastest growing on direct brand access and dedicated ranges. Convenience stores and foodservice add impulse and bulk demand, and others include specialty and natural stores. Showing online range building, in October 2025, Knuspr became the first German online supermarket with a dedicated upcycling category, listing 57 products, about half of them exclusive to the retailer.
Market Breakup by Region
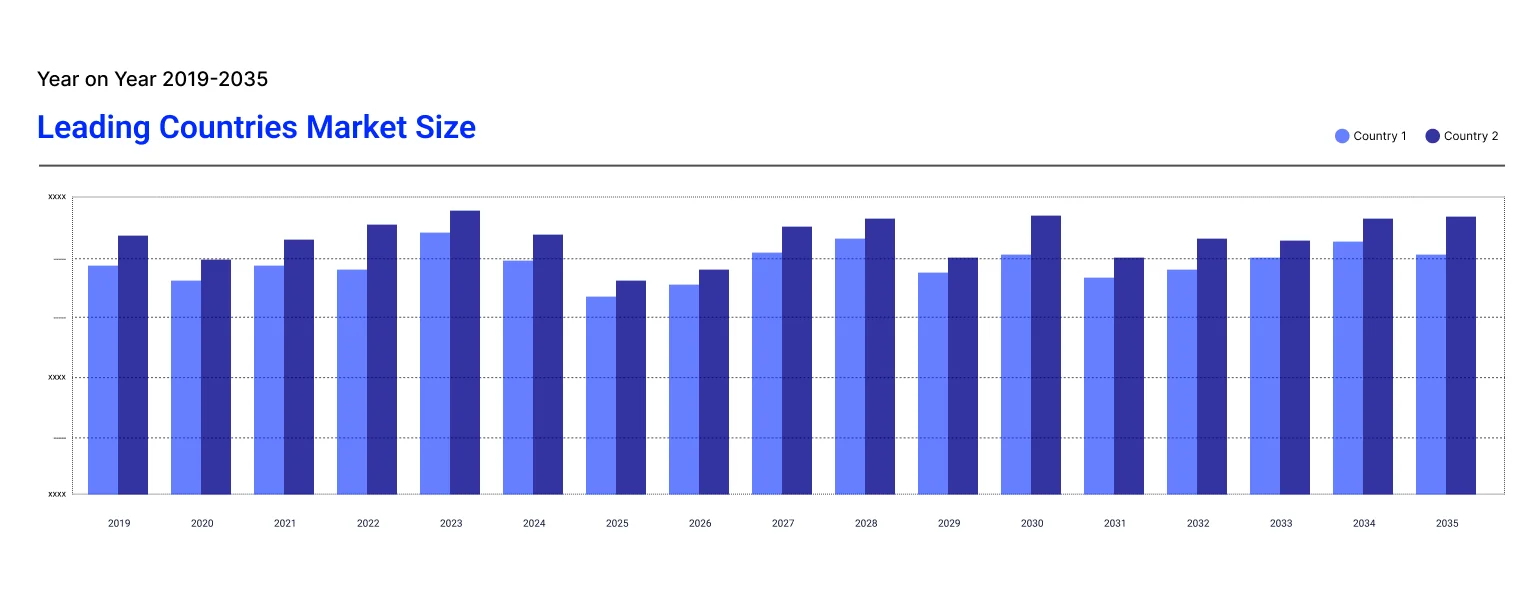
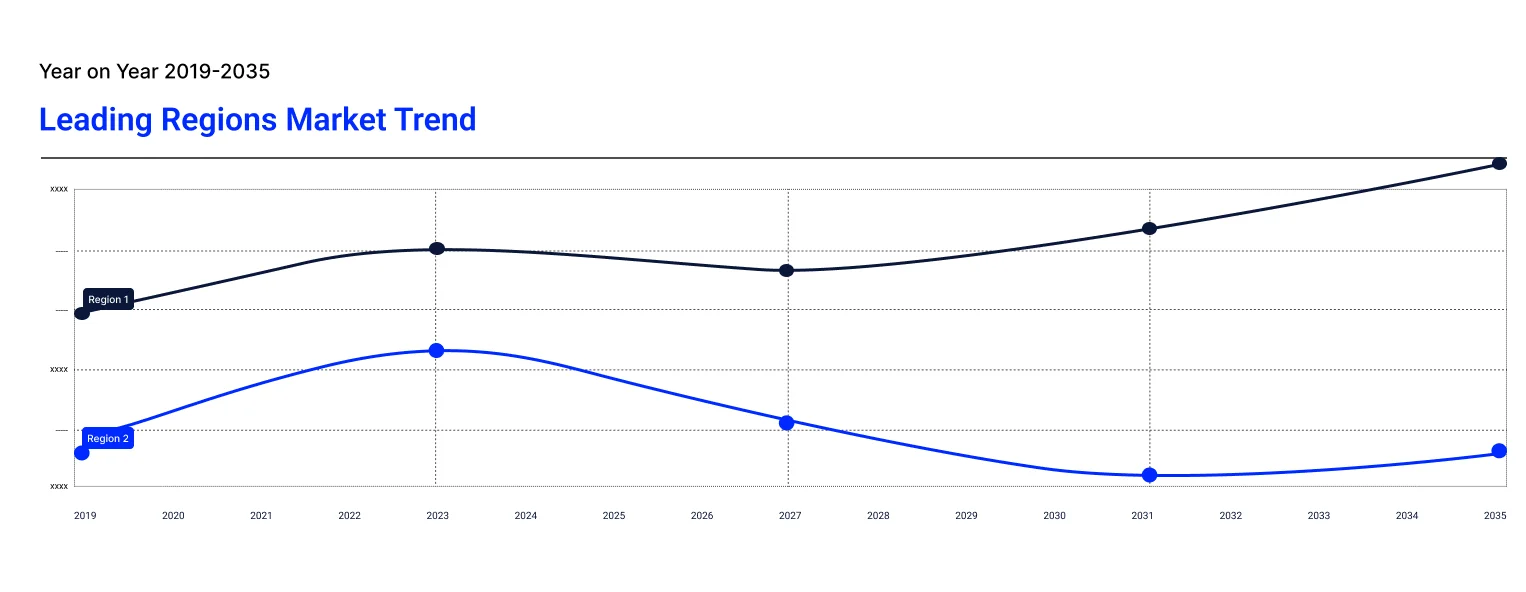
Key Insight: North America dominates the upcycled food products market on early brand activity, retailer programs, and certification, while Asia Pacific is the fastest growing on public funding and new startups. Europe grows on food waste targets, Latin America expands from a small base, and the Middle East and Africa gain from cocoa fruit and fruit processing. Showing regional scale up, in August 2025, Singapore's Mottainai opened a pilot facility able to process up to 100 tonnes of by-products a year, up from 10 kilograms in the laboratory.
Read more about this report - REQUEST FREE SAMPLE COPY IN PDF
By source material, fruit and vegetable by-products dominate on abundant peel, pulp, and trimmings from juicing and fresh cut processing
Fruit and vegetable by-products account for the largest share of the upcycled food products market by source material, because juicing, canning, and fresh cut operations generate steady volumes of pulp, peel, pomace, and trimmings that are cheap to collect nearby and easy to dry into flours, powders, and extracts. Snack makers, sauce producers, and beverage brands use these streams to add natural fibre and flavour, and shoppers quickly understand the waste reduction story across many food categories and retail formats.
Grain and cereal by-products are the fastest growing source group as breweries, mills, and oat drink makers look for new revenue from spent grain and pulp. In September 2024, reports described Europe's largest spent grain upcycling plant, run by Upgrain with Brauerei Locher in Appenzell, Switzerland, with capacity of 25,000 tonnes a year and ingredients ranging from 27% protein to 45% protein and 70% fibre. Dairy, meat, and seafood streams remain smaller but gain attention from ingredient buyers and investors.
By product type, snacks dominate as upcycled pulp, grains, and fruit suit chips, puffs, bars, and bites
Snacks account for the largest share of the upcycled food products market by product type, because chips, puffs, bars, and fruit bites can carry visible upcycled ingredients while meeting shopper taste and price expectations in busy, high turnover aisles. Brands use pulp, spent grain, and fruit by-products to add both fibre and protein, and short ingredient lists suit clean label positioning. Bakery and confectionery follow closely behind through upcycled flours, cocoa fruit sweeteners, and private label breads in mainstream grocery.
Beverages are the fastest growing product type as canned waters, juices, and functional drinks bring upcycled claims to everyday shopping purchases. In August 2025, Thailand's Coffogenic launched a new functional drink made from arabica coffee cherry husks, registered as a novel food with the Thai FDA and sold through Shopee, Lazada, and online stores. Dairy and dairy alternatives stay somewhat smaller, while ingredients and powders grow as manufacturers buy certified flours and extracts for use in finished foods and drinks.
By nature, conventional products dominate on wider supply and lower cost, while organic gains on premium positioning
Conventional products account for the largest share of the upcycled food products market by nature, because most surplus streams come from mainstream food processing, and conventional ingredients are available in larger volumes at lower cost. Large retailers and foodservice buyers prioritise consistent supply and price, which favours conventional lines, while upcycled certification can still be added to products that use surplus conventional ingredients across snacks, baking, and beverages. Lower prices also make them easier to stock widely in mainstream stores.
Organic is the fastest growing nature segment as shoppers who buy organic foods also look for waste reduction claims. In December 2025, Where Food Comes From reported 106 brands and 622 items in its global Upcycled Certified program for 2025, up from 89 brands and 476 items in 2024, with certified natural products up 39%. Such growth clearly shows that premium positioning and certification can work together, helping makers justify higher shelf prices for upcycled organic lines in competitive aisles.
By distribution channel, supermarkets and hypermarkets dominate on broad reach and growing private label ranges
Supermarkets and hypermarkets account for the largest share of the upcycled food products market by distribution channel, because they offer shelf space, promotions that encourage trial, and private label programs that carry upcycled lines straight into mainstream household baskets. Natural food chains add dedicated sections. Convenience stores add impulse purchases, with chains in Tokyo stocking upcycled items, while foodservice supplies universities, hospitals, and workplaces in bulk volumes. Certification marks help shoppers find products in crowded aisles and trust the claim.
Online retail is the fastest growing channel as direct to consumer sites, marketplaces, and online grocers can explain the upcycled story and reach small brands very cheaply. In March 2025, Misfits Market launched its first Upcycled Certified private label breads, Multigrain and Honey Wheat, made with spent grain flour and sold only through its own platform at 4.49 dollars for 24 ounces. Subscription boxes and social commerce further widen access for new upcycled brands that lack shelf space in stores.
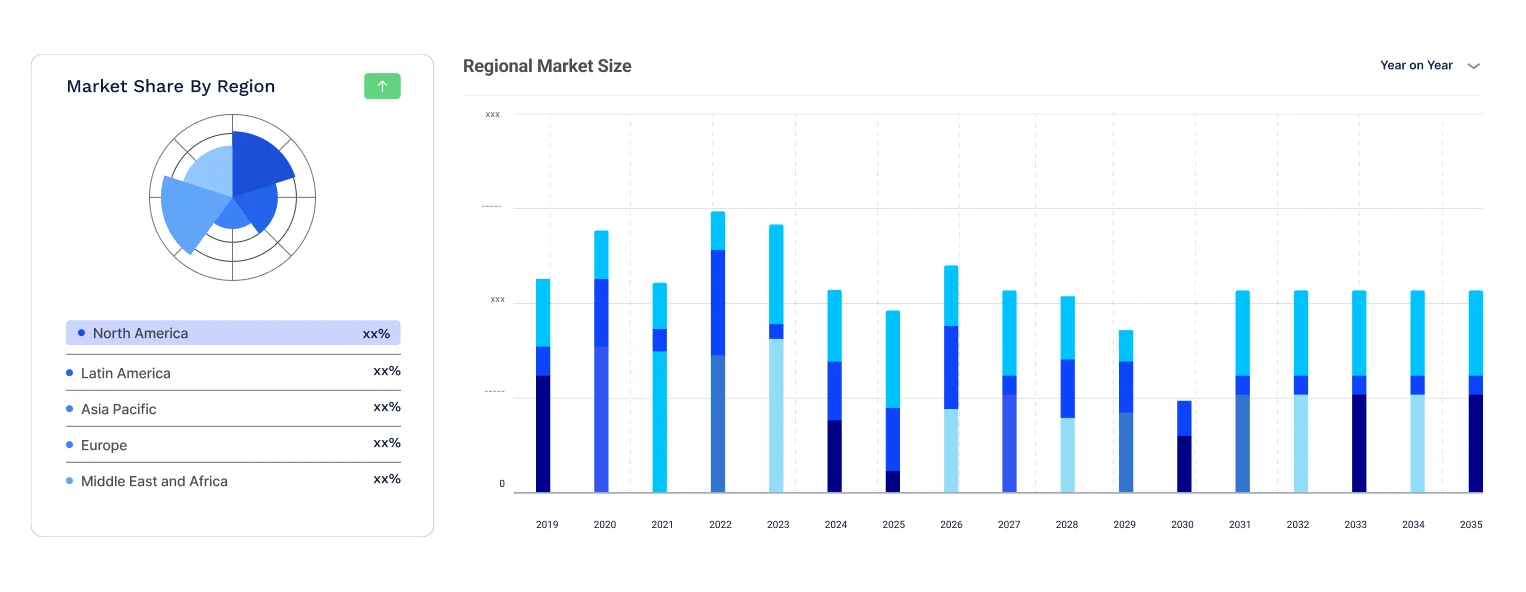
North America dominates the market due to early brand activity, retailer programs, and certification
North America dominates the upcycled food products market, as the United States built the category through early brands, retailer programs, and certification, while Canada is now organising its own network. In April 2026, the Upcycled Food Association launched a Canadian hub with Vineland Research and Innovation Centre, citing more than 600 certified products and 137 brands. In May 2026, Where Food Comes From said certified products had diverted more than 6.36 million tons of food waste since the program began.
Asia Pacific is the fastest growing region in the upcycled food products market, as governments and startups in Singapore, Japan, South Korea, and Thailand fund processing capacity and test new products. In October 2024, reports showed that Naju City in South Korea was building a Food Tech Research Support Center for food upcycling under the agriculture ministry, due to finish by the end of 2026. Europe follows, while Latin America and the Middle East and Africa build from smaller bases.
|
CAGR 2026-2035 - Market by |
Region |
|
North America |
5.2% |
|
Europe |
5.7% |
|
Asia Pacific |
7.8% |
|
Latin America |
6.0% |
|
Middle East and Africa |
6.6% |
The global upcycled food products market is fragmented, as upcycled food products market players range from small ingredient startups and snack brands to breweries, juice processors, and foodservice suppliers, and each competes around a particular by-product stream. Companies like Rubies in the Rubble, Barnana, Toast Ale, and Kern Tec lead through distinct products and clear sourcing stories, while Renewal Mill, ReGrained, Pulp Pantry, Matriark Foods, and The Spare Food Co. add depth in flours, grain ingredients, snacks, broths, and foodservice.
Leading upcycled food products market companies are differentiating through certification, new by-product sources, retail partnerships, and wider online and foodservice reach. Several are also moving into licensing, on site processing, and ingredient supply, using partnerships with brewers, growers, and processors to secure steady material. Growing focus on traceability, taste, and clear waste saving claims is helping companies broaden portfolios, reach new shoppers, and support sustained long term growth across several regions.
Rubies in the Rubble Ltd, headquartered in London, United Kingdom, was founded in 2010 by Jenny Costa. The company makes ketchups, mayonnaise, and hot sauces from surplus fruit and vegetables rejected by supermarkets, with chickpea cooking liquid used in its mayonnaise. Its products are stocked at Tesco, Waitrose, and Ocado, and it reports more than 720 tonnes of produce saved.
Barnana, headquartered in Los Angeles, California, was founded by Cauê Suplicy and has upcycled bananas since 2013. The company makes banana bites, plantain chips, and Organic Plantain Scoops from export rejected organic bananas and plantain peel. A Certified B Corp, it sells 16 products at more than 14,000 United States outlets and reports over 50 million fruits upcycled.
Toast Ale Ltd, headquartered in London, was founded in 2015 by Tristram Stuart and trades as Toast Brewing. The company brews beer with surplus bread replacing about a third of the malt, and gives its profits to Feedback Global. Production has run in six countries, including the United States, Iceland, and South Africa, and it is a Certified B Corp.
Kern Tec, headquartered in Herzogenburg, Austria, was founded in 2019 by Luca Fichtinger, Michael Beitl, Sebastian Jeschko, and Fabian Wagesreither. The company turns apricot, cherry, and plum pits into oils, creams, and plant based dairy ingredients, sold as Wunderkern in Austria. It raised a 12 million euro Series A in 2023 and has processed more than 2,500 tons of pits.
Other key players in the market report include Renewal Mill, ReGrained, Pulp Pantry, Matriark Foods, and The Spare Food Co. among others.
*Please note that this is only a partial list; the complete list of key players is available in the full report. Additionally, the list of key players can be customized to better suit your needs.*
Discover the key trends shaping the upcycled food products market 2026-2035 through our in-depth report. Access strategic insights, forward looking forecasts, and major market developments that help you stay ahead of competitors. Request a free sample report or speak with our team for tailored guidance on the upcycled food products market trends 2026.


Upto 15% Off
USD
$2499 $2249
$3999 $3599
$4999 $4249
$5999 $5099


*While we strive to always give you current and accurate information, the numbers depicted on the website are indicative and may differ from the actual numbers in the main report. At Expert Market Research, we aim to bring you the latest insights and trends in the market. Using our analyses and forecasts, stakeholders can understand the market dynamics, navigate challenges, and capitalize on opportunities to make data-driven strategic decisions.*
In 2025, the upcycled food products market reached an approximate value of USD 57.50 Billion.
The market is projected to grow at a CAGR of 6.10% between 2026 and 2035.
The key players in the market include Renewal Mill, ReGrained, Toast Ale, Barnana, Rubies in the Rubble, Pulp Pantry, The Spare Food Co, Matriark Foods, and Kern Tec, among others.
Leading companies are securing steady by-product supply, earning upcycled certification, entering retail and online channels, and licensing on site processing to brewers and food processors.
Key challenges include inconsistent by-product supply, food safety and labelling rules, higher processing costs, limited shopper awareness, and the capital needed to scale small producers.
Explore our key highlights of the report and gain a concise overview of key findings, trends, and actionable insights that will empower your strategic decisions.
|
Report Features |
Details |
|
Base Year |
2025 |
|
Historical Period |
2019-2025 |
|
Forecast Period |
2026-2035 |
|
Scope of the Report |
Historical and Forecast Trends, Industry Drivers and Constraints, Historical and Forecast Market Analysis by Segment:
|
|
Breakup by Source Material |
|
|
Breakup by Product Type |
|
|
Breakup by Nature |
|
|
Breakup by Distribution Channel |
|
|
Breakup by Region |
|
|
Market Dynamics |
|
|
Competitive Landscape |
|
|
Companies Covered |
|
Datasheet
One User
USD 2,499
USD 2,249
tax inclusive*
Single User License
One User
USD 3,999
USD 3,599
tax inclusive*
Five User License
Five User
USD 4,999
USD 4,249
tax inclusive*
Corporate License
Unlimited Users
USD 5,999
USD 5,099
tax inclusive*
*Please note that the prices mentioned below are starting prices for each bundle type. Kindly contact our team for further details.*
Flash Bundle
Small Business Bundle
Growth Bundle
Enterprise Bundle
*Please note that the prices mentioned below are starting prices for each bundle type. Kindly contact our team for further details.*
Flash Bundle
Number of Reports: 3
20%
tax inclusive*
Small Business Bundle
Number of Reports: 5
25%
tax inclusive*
Growth Bundle
Number of Reports: 8
30%
tax inclusive*
Enterprise Bundle
Number of Reports: 10
35%
tax inclusive*
How To Order

Select License Type
Choose the right license for your needs and access rights.

Click on ‘Buy Now’
Add the report to your cart with one click and proceed to register.

Select Mode of Payment
Choose a payment option for a secure checkout. You will be redirected accordingly.
Strategic Solutions for Informed Decision-Making
Gain insights to stay ahead and seize opportunities.
Get insights & trends for a competitive edge.
Track prices with detailed trend reports.
Analyse trade data for supply chain insights.
Leverage cost reports for smart savings
Enhance supply chain with partnerships.
Connect For More Information
Our expert team of analysts will offer full support and resolve any queries regarding the report, before and after the purchase.
Our expert team of analysts will offer full support and resolve any queries regarding the report, before and after the purchase.
We employ meticulous research methods, blending advanced analytics and expert insights to deliver accurate, actionable industry intelligence, staying ahead of competitors.
Our skilled analysts offer unparalleled competitive advantage with detailed insights on current and emerging markets, ensuring your strategic edge.
We offer an in-depth yet simplified presentation of industry insights and analysis to meet your specific requirements effectively.