Consumer Insights
Uncover trends and behaviors shaping consumer choices today
Procurement Insights
Optimize your sourcing strategy with key market data
Industry Stats
Stay ahead with the latest trends and market analysis.
Global pig iron output was 913 million tonnes in January to August 2026, down 2.2 percent, with China at 563 million tonnes (down 3.1 percent), India at 106 million (up 4 percent) and Japan at 39 million. Brazil exported about 2.5 million tonnes, down 7 percent, of which the United States took 1.9 million.
Merchant pig iron FOB Brazil was USD 410 per tonne in January 2026, USD 430 in February, USD 455 in March, USD 470 to 485 in April, USD 480 in May, USD 495 in June, USD 495 to 500 in July, USD 475 in August and USD 445 at the end of September.
Brazilian pig iron stood at USD 445 per tonne FOB at the end of September 2026, down from the June to July peak but about 9 percent above January. Prices are expected to stay soft in October. The price outlook is shaped by four key drivers.
Supplier news: KIC Metaliks of India planned an outage of about six weeks from September 2026, putting 30,000 to 37,500 tonnes of output at risk. Thyssenkrupp took Duisburg blast furnace 2 offline in late August 2026 for about six weeks, and ArcelorMittal's Gijon blast furnace A restarted in September after a steam explosion. Short term, outages and carbon costs support European offers. Long term, weak steel demand caps prices.
Expect steady gains across all four markets through H2 2026 as iron ore and coking coal costs continue firming.
China's infrastructure-driven demand recovery should keep supporting basic pig iron consumption specifically.
Brazil remains the most price-competitive origin given its integrated iron ore access, a gap that should persist through the forecast period.
Across all 4 regions combined, prices moved 3.0% increase on average between Q1 and Q2 2026. Absent a meaningful change to the cost or demand drivers outlined above, that pace looks set to carry into the second half of the year.
| Region | 2026 Price Range (USD/KG) | Outlook |
| Global Average | 0.390 - 0.430 | Balance of regional supply and demand conditions |
| China | 0.396 - 0.437 | Government infrastructure spending kept basic oxygen furnace utilisation firm |
| India | 0.382 - 0.422 | Strong domestic steel demand growth kept India's pig iron market firming in step with the broader Asian trend |
| United States | 0.428 - 0.472 | Foundry demand held steady |
| Brazil | 0.354 - 0.391 | Integrated ore access kept Brazil's pricing the most competitive of the group even as it tracked the same overall upward direction |
China rose 3.3% to USD 0.408/KG in Q2 2026, government infrastructure spending kept basic oxygen furnace utilisation firm, ranking it the 2nd most expensive among the 4 markets this report follows.
Why did the price of Iron change in Q2 2026 in China?
Government infrastructure spending kept basic oxygen furnace utilisation firm, lifting demand for pig iron alongside rising ore costs, working out to China trading about 1.5% above this quarter's 4-region average.
USD 0.394/KG. That is where India landed in Q2 2026, up 4.2% from USD 0.378/KG in Q1 2026, placing it the 3rd most expensive across the 4 regions covered in this report.
Why did the price of Iron change in Q2 2026 in India?
Strong domestic steel demand growth kept India's pig iron market firming in step with the broader Asian trend, leaving India running roughly 2.0% below the 4-region average for the quarter.
United States's price gained 2.6% to USD 0.441/KG, foundry demand held steady and higher scrap-adjacent costs supported, putting it the priciest of the 4 markets tracked this quarter.
Why did the price of Iron change in Q2 2026 in United States?
Foundry demand held steady, and higher scrap-adjacent costs supported another incremental increase, with United States now sitting about 9.7% above the 4-region average this quarter.
In Q2 2026, Brazil priced at USD 0.365/KG, up 2.0% from USD 0.358/KG the previous quarter, making it the most affordable of the 4 markets tracked here this quarter.
Why did the price of Iron change in Q2 2026 in Brazil?
Integrated ore access kept Brazil's pricing the most competitive of the group even as it tracked the same overall upward direction, which puts Brazil roughly 9.2% below the average across the 4 regions this report tracks.
China rose 1.6% to USD 0.395/KG in Q1 2026, early-year restocking ahead of the construction season lifted demand, ranking it the 2nd most expensive among the 4 markets this report follows.
Why did the price of Iron change in Q1 2026 in China?
Early-year restocking ahead of the construction season lifted demand as the calendar turned, working out to China trading about 1.2% above this quarter's 4-region average.
USD 0.378/KG. That is where India landed in Q1 2026, up 1.8% from USD 0.371/KG in Q4 2025, placing it the 3rd most expensive across the 4 regions covered in this report.
Why did the price of Iron change in Q1 2026 in India?
Steady infrastructure and manufacturing growth supported a firm start to the year, leaving India running roughly 3.1% below the 4-region average for the quarter.
United States's price gained 1.1% to USD 0.430/KG, foundry order books held up well supporting a modest, putting it the priciest of the 4 markets tracked this quarter.
Why did the price of Iron change in Q1 2026 in United States?
Foundry order books held up well, supporting a modest early-year gain, with United States now sitting about 10.2% above the 4-region average this quarter.
In Q1 2026, Brazil priced at USD 0.358/KG, up 1.3% from USD 0.353/KG the previous quarter, making it the most affordable of the 4 markets tracked here this quarter.
Why did the price of Iron change in Q1 2026 in Brazil?
Consistent export demand for Brazil's competitively priced pig iron carried prices modestly higher, which puts Brazil roughly 8.3% below the average across the 4 regions this report tracks.
The global average climbed steadily across the window, from USD 0.369/KG in Q1 2025 to USD 0.402 by Q2 2026, a gain of 9.0% over six quarters.
| Quarter | Price (USD/KG) | QoQ Change | Direction |
| Q2 2026 | 0.402 | +3.0% | ↑ Rising |
| Q1 2026 | 0.390 | +1.4% | ↑ Rising |
| Q4 2025 | 0.385 | +1.4% | ↑ Rising |
| Q3 2025 | 0.379 | +1.4% | ↑ Rising |
| Q2 2025 | 0.374 | +1.4% | ↑ Rising |
| Q1 2025 | 0.369 | - | - Stable |
| Q3 2026 | In Progress | - | - In Progress |
Looking back at 2025, the global iron average ran from about USD 0.369/KG in Q1 to USD 0.385 by Q4, a 4.3% increase across the year.
China prices moved from about USD 0.371/KG in Q1 2025 to USD 0.389 by Q4, up roughly 4.8%. China closed the year ranked 2 of the 4 markets this report tracks.
India prices moved from about USD 0.352/KG in Q1 2025 to USD 0.371 by Q4, up roughly 5.5%, leaving India in 3 place among the 4 tracked markets heading into the new year.
United States prices moved from about USD 0.412/KG in Q1 2025 to USD 0.425 by Q4, up roughly 3.3%. That left United States ranked 1 of 4 tracked markets heading into 2026.
Brazil prices moved from about USD 0.340/KG in Q1 2025 to USD 0.353 by Q4, up roughly 3.9%, placing Brazil 4 of 4 tracked markets as 2025 closed out.
Expert Market Research: Your Source for Real-Time Iron Price Intelligence
We keep a continuous watch on iron prices across every region that produces or consumes it at scale, tracing the raw material and demand drivers back to their source rather than just reporting the number. Our team pulls together iron ore and coking coal cost trends, regional supply and demand shifts, and policy developments into a single, regularly refreshed view of the market.
We build our forecasts from production capacity, feedstock cost trends, and regional demand data, aiming to give procurement teams something they can actually use in budgeting and supplier negotiations, not just a headline number.
If you need a deeper regional breakdown, a longer historical run than the six quarters shown here, or a sourcing analysis built around your specific procurement footprint, our analysts are available to help.


Upto 15% Off
USD
$799 $699


*While we strive to always give you current and accurate information, the numbers depicted on the website are indicative and may differ from the actual numbers in the main report. At Expert Market Research, we aim to bring you the latest insights and trends in the market. Using our analyses and forecasts, stakeholders can understand the market dynamics, navigate challenges, and capitalize on opportunities to make data-driven strategic decisions.*
Iron in this report refers to pig iron, the primary product of the blast furnace before it is converted into steel or cast directly into iron products. It is made by smelting iron ore with coking coal and limestone, and it serves as the base feedstock for foundries as well as basic oxygen furnace steelmaking.
In Q2 2026, it averaged USD 0.408/KG in China, USD 0.394/KG in India, USD 0.441/KG in United States, USD 0.365/KG in Brazil, with United States the priciest of the 4 markets tracked in this report.
The global average moved from USD 0.385/KG in Q4 2025 to USD 0.390 in Q1 2026, then to USD 0.402 by Q2, a 4.5% increase across the two quarters.
Government infrastructure spending kept basic oxygen furnace utilisation firm lifting demand for pig iron alongside rising ore costs, and the other regions covered here moved for largely the same underlying reasons, filtered through their own local supply and demand conditions.
Expect steady gains across all four markets through H2 2026 as iron ore and coking coal costs continue firming.
United States sits at the top given its cost and demand structure, while Brazil trades lowest of the 4 markets tracked here. The gap between them reflects local production costs, import exposure, and demand intensity, and it is worth revisiting each quarter since the ranking can shift as input costs move.
Iron ore prices, the single largest cost input into pig iron production; Coking coal costs, the second major feedstock and a source of independent price volatility; Steel and foundry industry demand more broadly, since pig iron sits at the very start of that chain, along with broader macroeconomic conditions across the 4 regions this report tracks.
Iron in this report refers to pig iron, the primary product of the blast furnace before it is converted into steel or cast directly into iron products. It is made by smelting iron ore with coking coal and limestone, and it serves as the base feedstock for foundries as well as basic oxygen furnace steelmaking.
Basic pig iron feeds directly into basic oxygen furnace steelmaking and has looser composition tolerances, while foundry grade requires tighter control over silicon, sulfur, and phosphorus content to produce quality iron castings. Foundry grade typically commands a premium of roughly 10 to 15 percent over basic grade.
Monthly, though our analysts flag any material shift in feedstock costs or regional demand as soon as it emerges.
One Year Subscription
One Year Subscription
USD 799
USD 699
tax inclusive*
*Please note that the prices mentioned below are starting prices for each bundle type. Kindly contact our team for further details.*
Flash Bundle
Small Business Bundle
Growth Bundle
Enterprise Bundle
*Please note that the prices mentioned below are starting prices for each bundle type. Kindly contact our team for further details.*
Flash Bundle
Number of Reports: 3
20%
tax inclusive*
Small Business Bundle
Number of Reports: 5
25%
tax inclusive*
Growth Bundle
Number of Reports: 8
30%
tax inclusive*
Enterprise Bundle
Number of Reports: 10
35%
tax inclusive*
How To Order

Select License Type
Choose the right license for your needs and access rights.

Click on ‘Buy Now’
Add the report to your cart with one click and proceed to register.

Select Mode of Payment
Choose a payment option for a secure checkout. You will be redirected accordingly.
Strategic Solutions for Informed Decision-Making
Gain insights to stay ahead and seize opportunities.
Get insights & trends for a competitive edge.
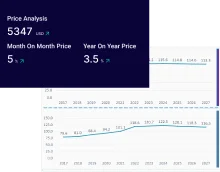
Track prices with detailed trend reports.
Analyse trade data for supply chain insights.
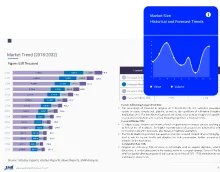
Leverage cost reports for smart savings
Enhance supply chain with partnerships.
Connect For More Information
Our expert team of analysts will offer full support and resolve any queries regarding the report, before and after the purchase.
Our expert team of analysts will offer full support and resolve any queries regarding the report, before and after the purchase.
We employ meticulous research methods, blending advanced analytics and expert insights to deliver accurate, actionable industry intelligence, staying ahead of competitors.
Our skilled analysts offer unparalleled competitive advantage with detailed insights on current and emerging markets, ensuring your strategic edge.
We offer an in-depth yet simplified presentation of industry insights and analysis to meet your specific requirements effectively.