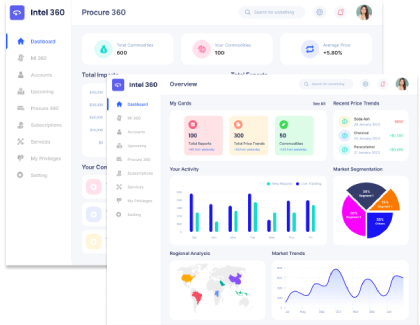
Consumer Insights
Uncover trends and behaviors shaping consumer choices today
Procurement Insights
Optimize your sourcing strategy with key market data
Industry Stats
Stay ahead with the latest trends and market analysis.
Melons, covering cantaloupe, honeydew and watermelon, are sold almost entirely as fresh fruit. World output of cantaloupes and other melons was 28.25 million tonnes in 2024, led by China at 13.22 million, India at 1.54 million, Kazakhstan at 1.50 million and Turkey at 1.48 million. United States cantaloupe output was about 481,000 tonnes in 2025, with California supplying 67 percent.
Boston terminal cantaloupe prices were USD 1,268 per tonne in January, USD 1,075 in February, USD 937 in March, USD 1,157 in April, USD 1,047 in May, USD 1,819 in both June and July, USD 1,047 in August and USD 1,378 in September. Shipping-point cantaloupe in the San Joaquin Valley fell to USD 386 per tonne in August before recovering to USD 744 by mid-September.
Boston terminal cantaloupe was about USD 1,433 per tonne in mid-October 2026, up 4.0 percent from September, while honeydew was about USD 1,837.
Supplier news: Melon 1 shipped about 300,000 display bins of watermelon between July and September and is expanding fall acreage in North Carolina, Georgia and Florida to supply through early December. Brazilian exporters opened the 2026/27 campaign in August with 8,800 tonnes, 48 percent to the United Kingdom, adding European supply, while Texas growers report labour costs squeezing margins over the long term.
Supply and demand should stay moderately tight through H2 2026, with the growing-season weather running a bit tighter than usual across several producing regions. Spain and Mexico both kept the fresh-market demand steady through H1, and that's likely to continue. Turkey's export volumes kept building as well, while China's enormous domestic production base kept it the most affordable of the four. None of the four markets we track is showing signs of genuine disruption heading into the back half of the year.
Buyers should keep in mind that the regional trade-flow pattern limits how much substitution is possible between origins during a shortfall, since the logistics of shipping a highly perishable fruit across longer distances rarely make economic sense outside of genuinely extreme price dislocations. That's worth building into any longer-range planning rather than assuming current conditions will simply persist unchanged.
The competition for acreage with other warm-season crops bears watching too, since growers weighing next season's planting decisions compare expected returns across several options rather than committing to melons regardless of price.
What could push prices higher? A weaker-than-expected harvest in any of the major producing regions, or stronger-than-usual fresh-market demand. What could pull them lower? A stronger harvest than currently expected across the major producing regions.
| Region | 2026 Price Range (USD/MT) | Outlook |
| Global Average | 690 - 750 | Tight growing-season conditions and steady fresh-market demand support |
| China | 510 - 553 | Enormous domestic production base keeps China most affordable |
| Turkey | 660 - 715 | Established regional export demand |
| Spain | 860 - 933 | European fresh-market demand drives premium |
| Mexico | 800 - 868 | Steady North American export demand |
China's melon growers saw firm domestic demand this quarter, and the gain came to 1.6%, USD 503/MT to USD 511. That kept China comfortably the most affordable of the four markets given its scale of production.
Why did the price of Melons change in Q2 2026 in China?
The domestic demand stayed firm, and the growing-season weather ran a bit tighter than usual across the harvest window.
Turkey climbed 1.7% to USD 663/MT, the regional export demand continuing to hold steady through the period.
Why did the price of Melons change in Q2 2026 in Turkey?
The regional export demand held steady, and that alone explains most of the move here.
USD 845/MT. That's where Spain landed in Q2, up 1.9% from USD 829 in Q1. The European fresh-market demand stayed firm, and the tighter growing-season conditions pushed things higher.
Why did the price of Melons change in Q2 2026 in Spain?
The European fresh-market demand held its ground, and the tighter growing-season conditions are really what's keeping the Spanish premium as wide as it is.
Mexico gained 1.8% to USD 778/MT, the North American export demand continuing to build through the period.
Why did the price of Melons change in Q2 2026 in Mexico?
The North American export demand kept building, and the growing-season conditions firmed alongside it.
China gained 1.6% to USD 503/MT, the demand firming as the year opened.
Why did the price of Melons change in Q1 2026 in China?
The domestic demand firmed as the year opened, and the growing-season outlook tightened right alongside it.
Turkish melons rose 1.7% to USD 652/MT, the regional export demand firming with the new year.
Why did the price of Melons change in Q1 2026 in Turkey?
The regional export demand firmed with the new year, tracking the fresh-market buying closely.
Spanish melons climbed 2.0% to USD 829/MT, the European fresh-market demand staying firm through the quarter.
Why did the price of Melons change in Q1 2026 in Spain?
The European fresh-market demand stayed firm, and the growing-season conditions firmed alongside it.
Mexican melons rose 1.9% to USD 764/MT, the North American export demand building through the quarter.
Why did the price of Melons change in Q1 2026 in Mexico?
The North American export demand built through the quarter, tracking the fresh-market buying closely.
The global average climbed steadily across the window, from USD 650/MT in Q1 2025 to USD 700 by Q2 2026, a net gain of about 7.7%. Every quarter posted a gain here, reflecting the tighter growing-season conditions and the steady fresh-market demand across every market we track, with the pace of the gains picking up somewhat in the most recent two quarters. That kind of steady, uninterrupted climb is worth noting, since it stands in contrast to how choppy some other commodities in this space have looked over the same period.
| Quarter | Price (USD/MT) | QoQ Change | Direction |
| Q2 2026 | 700 | +1.9% | ↑ Rising |
| Q1 2026 | 687 | +1.9% | ↑ Rising |
| Q4 2025 | 674 | +1.2% | ↑ Rising |
| Q3 2025 | 666 | +1.2% | ↑ Rising |
| Q2 2025 | 658 | +1.2% | ↑ Rising |
| Q1 2025 | 650 | - | - Stable |
| Q3 2026 | In Progress | - | - In Progress |
2025 was a steady year for melons. Starting near USD 650/MT in Q1, the global average finished 2025 at USD 674, a gain of about 3.7%. The fresh-market demand held consistent all year across every market we track, before the pace of gains picked up further once the tighter 2026 growing season got underway. The consistency of that pattern across all four regions makes this one of the more predictable produce markets we track. Buyers who track this market closely tend to view that steady annual pattern as the baseline against which any future quarter's move should be judged.
Chinese prices moved from about USD 480/MT in Q1 2025 to USD 495 by Q4, up roughly 3.1%. The domestic demand held steady all year, and China stayed the most affordable of the four markets throughout.
Turkish prices climbed from USD 620/MT in Q1 to USD 641 by Q4, a 3.4% gain, tracking the steady regional export demand.
Spanish prices rose from USD 780/MT in Q1 to USD 813 by Q4, up 4.2%, the highest absolute price throughout the four markets on the European fresh-market demand.
Mexican prices moved from USD 720/MT in Q1 to USD 750 by Q4, a 4.2% gain, as the North American export demand kept building through the year.
Expert Market Research: Your Source for Real-Time Melons Price Intelligence
We keep a continuous eye on the melon prices wherever they're grown or consumed at scale, tracing causation through the growing-season weather across the major producing regions, the fresh-market demand, and the acreage-planting decisions growers make each season. Our analysts track the regional trade-flow pattern closely, given how limited substitution is between origins during any single region's shortfall. We also flag any material shift in the underlying feedstock or trade-logistics conditions as soon as it becomes apparent. Need pricing data, bespoke market analysis, or procurement advisory? Reach out to our team.


Upto 15% Off
USD
$799 $699


*While we strive to always give you current and accurate information, the numbers depicted on the website are indicative and may differ from the actual numbers in the main report. At Expert Market Research, we aim to bring you the latest insights and trends in the market. Using our analyses and forecasts, stakeholders can understand the market dynamics, navigate challenges, and capitalize on opportunities to make data-driven strategic decisions.*
In Q2 2026, it averaged USD 511/MT in China, USD 663/MT in Turkey, USD 845/MT in Spain, and USD 778/MT in Mexico, with Spain the priciest market on European fresh-market demand.
The global average climbed from USD 674/MT in Q4 2025 to USD 687 in Q1 2026, then on to USD 700 in Q2, up 3.9% across the half.
The growing-season weather ran a bit tighter than usual across several major producing regions, while the fresh-market demand held steady to strong across every market tracked.
We're expecting a global average somewhere in the USD 690-750/MT range, supported by the tight growing-season conditions and steady fresh-market demand.
Spain carries the firmest premium on European fresh-market demand. Mexico sits close behind on North American export demand. China prices lowest on its enormous domestic production base.
The growing-season weather across the major producing regions matters most, followed by the fresh-market demand and how much acreage growers commit relative to other warm-season crops.
China grows the largest volume by a wide margin, most of it consumed domestically, while Turkey, Spain, and Mexico round out the other major producing and exporting regions, each serving its own regional demand base.
Monthly, though our analysts flag any material shift in growing-season or harvest conditions between scheduled updates, so buyers are never working from stale figures. We also track how buyers in adjacent markets are adjusting their sourcing strategies.
The quarterly trends and forecasts help time fresh-market purchases around the harvest cycles in the major producing regions. Understanding the regional trade-flow pattern can help buyers set realistic expectations for how much substitution is possible between origins during a shortfall. Building that habit into a quarterly procurement review tends to pay off more consistently than reacting to price moves after they have already happened.
Each region serves its own geographically proximate demand base, Spain into Europe, Mexico into North America, and Turkey into nearby European and Middle Eastern markets, a pattern driven largely by the fruit's limited shelf life once ripe, which discourages the kind of long-distance trade more common with hardier produce.
One Year Subscription
One Year Subscription
USD 799
USD 699
tax inclusive*
*Please note that the prices mentioned below are starting prices for each bundle type. Kindly contact our team for further details.*
Flash Bundle
Small Business Bundle
Growth Bundle
Enterprise Bundle
*Please note that the prices mentioned below are starting prices for each bundle type. Kindly contact our team for further details.*
Flash Bundle
Number of Reports: 3
20%
tax inclusive*
Small Business Bundle
Number of Reports: 5
25%
tax inclusive*
Growth Bundle
Number of Reports: 8
30%
tax inclusive*
Enterprise Bundle
Number of Reports: 10
35%
tax inclusive*
How To Order

Select License Type
Choose the right license for your needs and access rights.

Click on ‘Buy Now’
Add the report to your cart with one click and proceed to register.

Select Mode of Payment
Choose a payment option for a secure checkout. You will be redirected accordingly.
Strategic Solutions for Informed Decision-Making
Gain insights to stay ahead and seize opportunities.
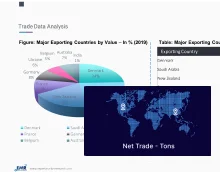
Get insights & trends for a competitive edge.
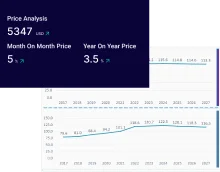
Track prices with detailed trend reports.

Analyse trade data for supply chain insights.

Leverage cost reports for smart savings
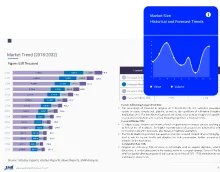
Enhance supply chain with partnerships.
Connect For More Information
Our expert team of analysts will offer full support and resolve any queries regarding the report, before and after the purchase.
Our expert team of analysts will offer full support and resolve any queries regarding the report, before and after the purchase.
We employ meticulous research methods, blending advanced analytics and expert insights to deliver accurate, actionable industry intelligence, staying ahead of competitors.
Our skilled analysts offer unparalleled competitive advantage with detailed insights on current and emerging markets, ensuring your strategic edge.
We offer an in-depth yet simplified presentation of industry insights and analysis to meet your specific requirements effectively.