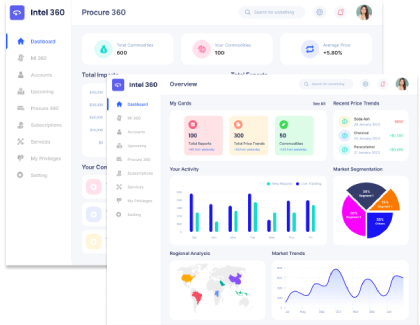
Consumer Insights
Uncover trends and behaviors shaping consumer choices today
Procurement Insights
Optimize your sourcing strategy with key market data
Industry Stats
Stay ahead with the latest trends and market analysis.
RBD palm oil is crude palm oil that has been refined, bleached and deodorized, and its liquid fraction is sold as RBD palm olein. It is the most traded vegetable oil, used in cooking, frying, margarine, snack foods, soap and oleochemicals. Indonesia and Malaysia produce most of it, and India, China, the EU and Pakistan are the main importers.
Prices rose through 2026 and then slipped. Crude palm futures opened the year near USD 979 per tonne, reached a near two-year high of USD 1,240 in mid-September and fell about 10 percent to USD 1,110 by 4 October, a 12-week low.
RBD palm oil was about USD 1,180 per tonne FOB Malaysia and RBD palm olein USD 1,185 on 21 September, before futures fell a further USD 50 to 70. Indonesia set its October crude palm reference price at USD 1,042.15 per tonne, up 3.44 percent on September. Four drivers apply.
Supplier news: SD Guthrie reported on 11 August that first half fresh fruit bunch output fell 2 percent to 4.2 million tonnes and upstream profit fell 18 percent, KLK flagged on 27 August slightly lower FY27 fruit bunch output on El Nino, and Wilmar reported 6 percent lower fruit bunch output of 1.92 million tonnes and a 32 percent fall in plantation profit. Short term, high stocks cap prices; long term, B50 and El Nino support them.
Expect continued firming through H2 2026 across all four markets as Indonesia's B50 biodiesel mandate tightens export availability. Indonesia should retain its position as the most competitively priced origin given its larger production base relative to Malaysia. India's import-driven premium should persist given the country's near-total reliance on imported material and its own import duty structure. El Nino-related weather risk to Malaysian and Indonesian production remains the key variable to watch for the remainder of 2026.
On balance, the first half of 2026 brought a 4.6% increase average move across the 4 markets covered here, a trend that should persist through year end absent a material change in the underlying drivers.
| Region | 2026 Price Range (USD/MT) | Outlook |
| Global Average | 1,199 - 1,323 | Balance of regional supply and demand conditions |
| Malaysia | 1,162 - 1,282 | Firm export demand and accelerated shipments ahead of a scheduled export levy increase supported a strong quarter |
| Indonesia | 1,090 - 1,203 | Stronger export inquiries and tightening inventory availability |
| China | 1,205 - 1,329 | Improving demand sentiment and cautious restocking ahead of anticipated supply tightening reversed the softness seen earlier in the year |
| India | 1,339 - 1,477 | Tightening supply expectations ahead of Indonesia's B50 biodiesel mandate rollout |
In Q2 2026, Malaysia priced at USD 1,198/MT, up 4.4% from USD 1,147/MT the previous quarter, putting it the 3rd most expensive of the 4 markets tracked this quarter.
Why did the price of RBD Palm Oil change in Q2 2026 in Malaysia?
Firm export demand and accelerated shipments ahead of a scheduled export levy increase supported a strong quarter, with Malaysia now sitting about 3.1% below the 4-region average this quarter.
Malaysia has averaged 2.0% a quarter over the six quarters this report tracks; this move came in faster than that longer-run pace.
Indonesia reached USD 1,124/MT in Q2 2026, stronger export inquiries and tightening inventory availability, making it the most affordable of the 4 markets tracked here this quarter.
Why did the price of RBD Palm Oil change in Q2 2026 in Indonesia?
Stronger export inquiries and tightening inventory availability, partly reflecting biodiesel blending requirements, supported a firm increase, which puts Indonesia roughly 9.1% below the average across the 4 regions this report tracks.
Set against a 1.7% average quarterly pace over the six quarters this report tracks, Indonesia's move this quarter landed faster than that trend.
China rose 5.1% to USD 1,242/MT in Q2 2026, improving demand sentiment and cautious restocking ahead of anticipated supply tightening reversed the softness seen earlier in the year, ranking it the 2nd most expensive among the 4 markets this report follows.
Why did the price of RBD Palm Oil change in Q2 2026 in China?
Improving demand sentiment and cautious restocking ahead of anticipated supply tightening reversed the softness seen earlier in the year, working out to China trading about 0.5% above this quarter's 4-region average.
Measured against China's own average pace of 2.1% a quarter across the six quarters this report tracks, this move came in faster than that pace.
USD 1,380/MT. That is where India landed in Q2 2026, up 5.3% from USD 1,310/MT in Q1 2026, placing it the priciest across the 4 regions covered in this report.
Why did the price of RBD Palm Oil change in Q2 2026 in India?
Tightening supply expectations ahead of Indonesia's B50 biodiesel mandate rollout, combined with currency movements, supported firmer import pricing, leaving India running roughly 11.7% above the 4-region average for the quarter.
That is faster than the 2.2% average quarterly move India has posted across the six quarters this report tracks.
In Q1 2026, Malaysia priced at USD 1,147/MT, up 1.4% from USD 1,131/MT the previous quarter, putting it the 3rd most expensive of the 4 markets tracked this quarter.
Why did the price of RBD Palm Oil change in Q1 2026 in Malaysia?
Ample supply from favourable harvesting conditions met moderated export demand, keeping pricing under pressure early in the year, with Malaysia now sitting about 2.9% below the 4-region average this quarter.
Malaysia has averaged 2.0% a quarter over the six quarters this report tracks; this move came in slower than that longer-run pace.
Indonesia reached USD 1,088/MT in Q1 2026, strong production levels and sufficient supply conditions kept pricing soft through the first quarter, making it the most affordable of the 4 markets tracked here this quarter.
Why did the price of RBD Palm Oil change in Q1 2026 in Indonesia?
Strong production levels and sufficient supply conditions kept pricing soft through the first quarter, which puts Indonesia roughly 7.9% below the average across the 4 regions this report tracks.
Set against a 1.7% average quarterly pace over the six quarters this report tracks, Indonesia's move this quarter landed slower than that trend.
China rose 1.4% to USD 1,182/MT in Q1 2026, progressive weakness through the quarter tracked the broader soft Southeast Asian supply picture, ranking it the 2nd most expensive among the 4 markets this report follows.
Why did the price of RBD Palm Oil change in Q1 2026 in China?
Progressive weakness through the quarter tracked the broader soft Southeast Asian supply picture, working out to China trading about 0.0% above this quarter's 4-region average.
Measured against China's own average pace of 2.1% a quarter across the six quarters this report tracks, this move came in slower than that pace.
USD 1,310/MT. That is where India landed in Q1 2026, up 1.4% from USD 1,292/MT in Q4 2025, placing it the priciest across the 4 regions covered in this report.
Why did the price of RBD Palm Oil change in Q1 2026 in India?
Import pricing softened alongside the broader Asian market before the sharper Q2 reversal, leaving India running roughly 10.9% above the 4-region average for the quarter.
That is slower than the 2.2% average quarterly move India has posted across the six quarters this report tracks.
The global average climbed steadily across the window, from USD 1,119/MT in Q1 2025 to USD 1,236 by Q2 2026, a gain of 10.5% over six quarters.
| Quarter | Price (USD/MT) | QoQ Change | Direction |
| Q2 2026 | 1,236 | +4.6% | ↑ Rising |
| Q1 2026 | 1,182 | +1.4% | ↑ Rising |
| Q4 2025 | 1,166 | +1.4% | ↑ Rising |
| Q3 2025 | 1,150 | +1.4% | ↑ Rising |
| Q2 2025 | 1,134 | +1.4% | ↑ Rising |
| Q1 2025 | 1,119 | - | - Stable |
| Q3 2026 | In Progress | - | - In Progress |
The global RBD palm oil average moved steadily through 2025, opening near USD 1,119/MT in Q1 and closing the year at USD 1,166, a 4.2% increase.
Malaysia prices moved from about USD 1,085/MT in Q1 2025 to USD 1,131 by Q4, up roughly 4.3%. That left Malaysia ranked 3 of 4 tracked markets heading into 2026.
Indonesia prices moved from about USD 1,032/MT in Q1 2025 to USD 1,074 by Q4, up roughly 4.0%, placing Indonesia 4 of 4 tracked markets as 2025 closed out.
China prices moved from about USD 1,118/MT in Q1 2025 to USD 1,166 by Q4, up roughly 4.3%. China closed the year ranked 2 of the 4 markets this report tracks.
India prices moved from about USD 1,240/MT in Q1 2025 to USD 1,292 by Q4, up roughly 4.2%, leaving India in 1 place among the 4 tracked markets heading into the new year.
Expert Market Research: Your Source for Real-Time RBD Palm Oil Price Intelligence
We monitor RBD palm oil markets across every region with meaningful production or consumption, connecting the price you see to the crude palm oil costs and demand conditions behind it. The result is a regularly updated view built from the ground up rather than a single static figure.
Our forecasts combine production capacity data with feedstock cost trends and regional demand signals, giving sourcing teams a defensible basis for budgeting and supplier negotiations beyond a single point estimate.
Get in touch with our analysts if you need a more detailed regional view, historical pricing beyond the six quarters shown here, or a sourcing analysis built specifically around your procurement footprint.
We track RBD palm oil pricing as distinct from the further-fractionated palm olein and palm stearin products this pipeline also covers, since fractionation costs and each product's own demand pattern can shift the three apart.


Upto 15% Off
USD
$799 $699


*While we strive to always give you current and accurate information, the numbers depicted on the website are indicative and may differ from the actual numbers in the main report. At Expert Market Research, we aim to bring you the latest insights and trends in the market. Using our analyses and forecasts, stakeholders can understand the market dynamics, navigate challenges, and capitalize on opportunities to make data-driven strategic decisions.*
RBD palm oil, refined, bleached, and deodorised, is crude palm oil processed to remove free fatty acids, colour, and odour, yielding the stable, neutral-tasting oil used directly in cooking and as feedstock for further fractionation into palm olein and palm stearin.
In Q2 2026, it averaged USD 1,198/MT in Malaysia, USD 1,124/MT in Indonesia, USD 1,242/MT in China, USD 1,380/MT in India, with India the priciest of the 4 markets tracked in this report.
The global average moved from USD 1,166/MT in Q4 2025 to USD 1,182 in Q1 2026, then to USD 1,236 by Q2, a 6.0% increase across the two quarters.
Firm export demand and accelerated shipments ahead of a scheduled export levy increase supported a strong quarter. The other regions in this report saw broadly comparable pressures, though the specific mix of supply and demand drivers varied from market to market.
Expect continued firming through H2 2026 across all four markets as Indonesia's B50 biodiesel mandate tightens export availability.
Regional pricing spans from Indonesia at the low end to India at the high end among the 4 markets tracked here. That range comes down mainly to production cost structure, import reliance, and how tight local demand is running, all of which can shift the ranking over time.
Malaysian and Indonesian crude palm oil production volumes, which together set the global supply baseline; Indonesia's biodiesel blending mandate, which diverts crude palm oil away from export and food use; Global vegetable oil demand and pricing, given palm oil's substitutability with soybean, sunflower, and other oils, along with broader macroeconomic conditions across the 4 regions this report tracks.
RBD palm oil, refined, bleached, and deodorised, is crude palm oil processed to remove free fatty acids, colour, and odour, yielding the stable, neutral-tasting oil used directly in cooking and as feedstock for further fractionation into palm olein and palm stearin.
India imports the overwhelming majority of the palm oil it consumes, paying import duties and freight costs from Malaysia and Indonesia on top of the underlying commodity price. That import-dependent cost structure, combined with India's large and growing edible oil consumption base, keeps Indian pricing structurally above the two dominant Southeast Asian producing and refining countries.
Monthly, though our analysts flag any material shift in feedstock costs or regional demand as soon as it emerges.
One Year Subscription
One Year Subscription
USD 799
USD 699
tax inclusive*
*Please note that the prices mentioned below are starting prices for each bundle type. Kindly contact our team for further details.*
Flash Bundle
Small Business Bundle
Growth Bundle
Enterprise Bundle
*Please note that the prices mentioned below are starting prices for each bundle type. Kindly contact our team for further details.*
Flash Bundle
Number of Reports: 3
20%
tax inclusive*
Small Business Bundle
Number of Reports: 5
25%
tax inclusive*
Growth Bundle
Number of Reports: 8
30%
tax inclusive*
Enterprise Bundle
Number of Reports: 10
35%
tax inclusive*
How To Order

Select License Type
Choose the right license for your needs and access rights.

Click on ‘Buy Now’
Add the report to your cart with one click and proceed to register.

Select Mode of Payment
Choose a payment option for a secure checkout. You will be redirected accordingly.
Strategic Solutions for Informed Decision-Making
Gain insights to stay ahead and seize opportunities.
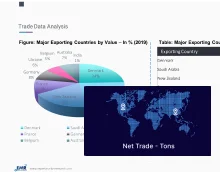
Get insights & trends for a competitive edge.
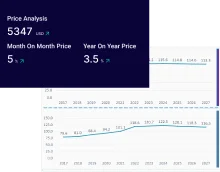
Track prices with detailed trend reports.

Analyse trade data for supply chain insights.
Leverage cost reports for smart savings
Enhance supply chain with partnerships.
Connect For More Information
Our expert team of analysts will offer full support and resolve any queries regarding the report, before and after the purchase.
Our expert team of analysts will offer full support and resolve any queries regarding the report, before and after the purchase.
We employ meticulous research methods, blending advanced analytics and expert insights to deliver accurate, actionable industry intelligence, staying ahead of competitors.
Our skilled analysts offer unparalleled competitive advantage with detailed insights on current and emerging markets, ensuring your strategic edge.
We offer an in-depth yet simplified presentation of industry insights and analysis to meet your specific requirements effectively.