

Consumer Insights
Uncover trends and behaviors shaping consumer choices today
Procurement Insights
Optimize your sourcing strategy with key market data
Industry Stats
Stay ahead with the latest trends and market analysis.
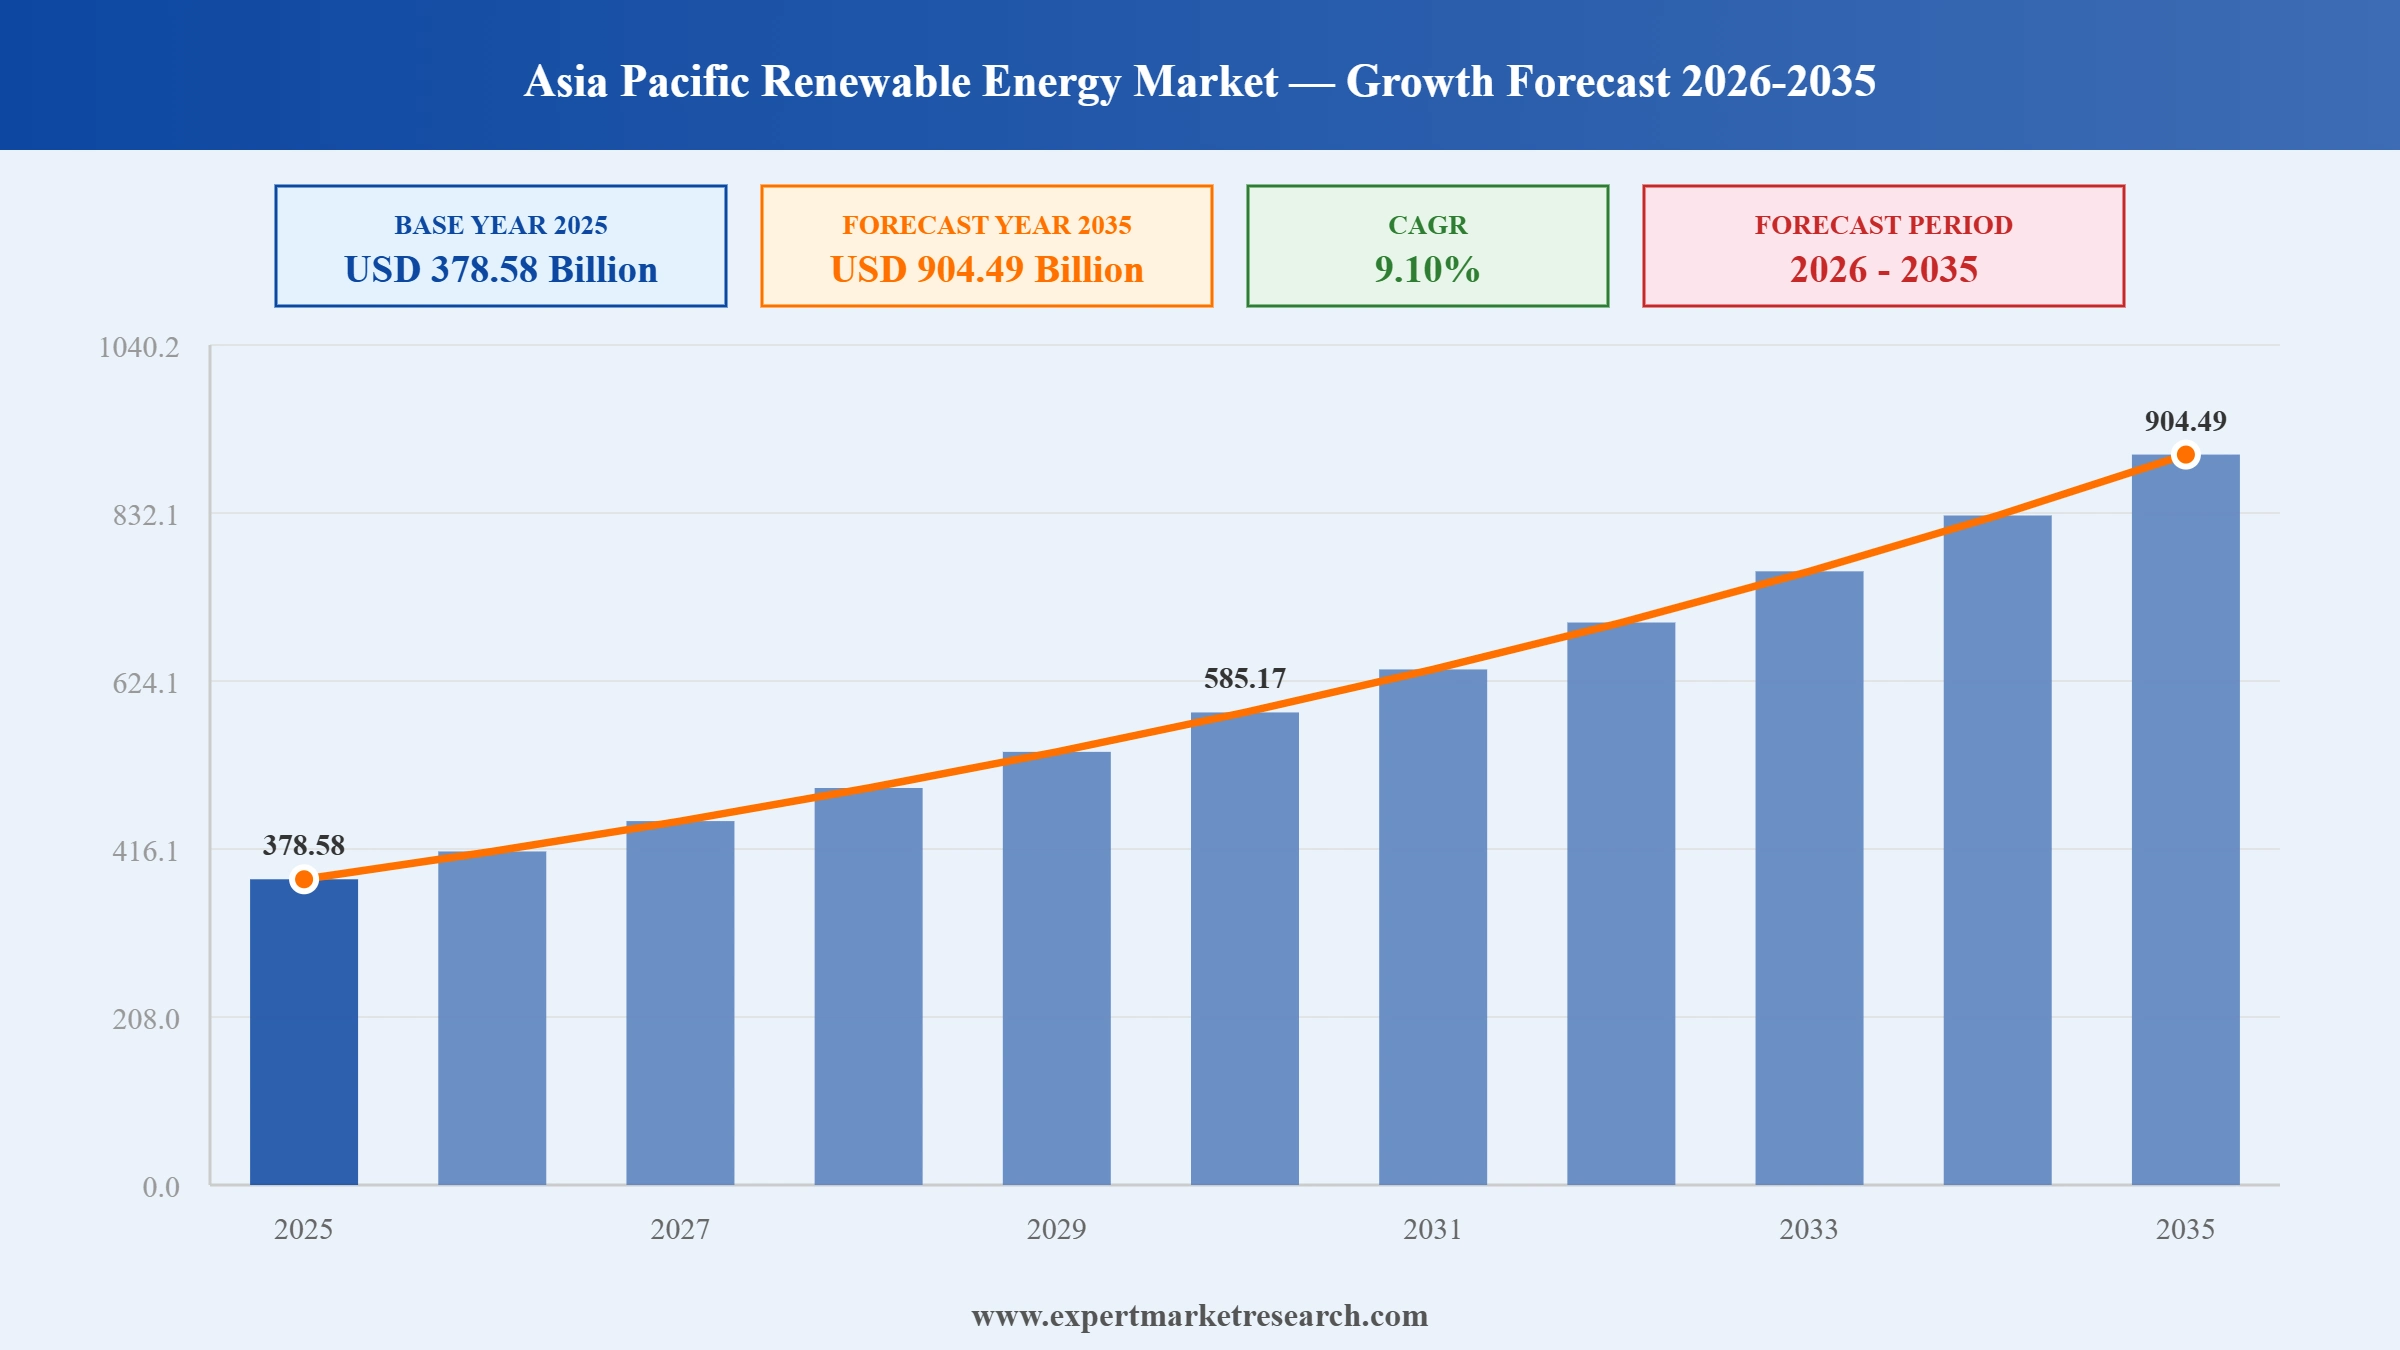
The Asia Pacific renewable energy market was valued at USD 378.58 Billion at 2025 and is projected to expand at a CAGR of around 9.10% during the forecast period of 2026-2035. Driven by ambitious national decarbonisation targets, rapidly declining solar and wind energy costs, strong government policy frameworks, and accelerating private sector investment across major economies, the market is expected to reach USD 904.49 Billion by 2035.
Read more about this report - REQUEST FREE SAMPLE COPY IN PDF
The Asia Pacific renewable energy market is undergoing transformative expansion as governments enact ambitious clean energy mandates, utilities accelerate the fossil fuel transition, and corporations invest heavily in renewable procurement to meet net-zero commitments. Solar and wind are leading this shift, with hybrid project formats gaining momentum across India, China, and Southeast Asia.
Tata Power and Druk Green Power Corporation, Bhutan's state hydropower utility, identified the 404 MW Nyera Amari I and II Hydropower Project as a bilateral collaboration priority, advancing a significant cross-border initiative in the Asia Pacific renewable energy market.
Tata Power announced a strategic collaboration with Databricks to develop a data and artificial intelligence platform accelerating energy transition operations, enhancing grid management, predictive maintenance, and renewable portfolio optimisation across its Asia Pacific renewable energy assets.
Tata Motors signed a power purchase agreement with Tata Power Renewable Energy for a 131 MW wind-solar hybrid project, reflecting growing corporate demand for hybrid renewable procurement in the Asia Pacific renewable energy market.
Tata Power Renewable Energy signed a memorandum of understanding with Andhra Pradesh government to develop up to 7 GW of capacity across solar, wind, and hybrid formats, reinforcing its leading developer status in the Asia Pacific renewable energy market.
Governments across Asia Pacific are implementing ambitious renewable energy capacity targets, with China and India collectively seeking to add over 1,000 GW of clean power by 2030, creating long-term policy certainty that underpins the Asia Pacific renewable energy market investment.
Rapidly declining photovoltaic module costs have positioned solar as the Asia Pacific renewable energy market's fastest-growing technology. Utility-scale solar farms exceeding 1 GW are now increasingly common across China, India, and Australia, reducing generation costs and enabling unprecedented capacity additions.
The Asia Pacific renewable energy market is witnessing rapid growth in wind-solar hybrid project development, combining complementary generation profiles to enhance grid stability. India and Australia lead hybrid deployment, supported by government tenders specifically designed for hybrid renewable energy configurations.
Foreign direct investment and domestic private capital into the Asia Pacific renewable energy market are accelerating, with utilities and infrastructure funds competing for pipelines. Green bond issuances and sustainability-linked financing are expanding the available capital base for renewable project development.
The Asia Pacific renewable energy market is increasingly encompassing green hydrogen, with Australia, India, and Japan launching major electrolyser and export infrastructure projects. These developments signal a broadening of the renewable energy value chain beyond power generation into industrial decarbonisation.
The report of the Expert Market Research's titled "Asia Pacific Renewable Energy Market Report and Forecast 2026-2035" offers a detailed analysis of the market based on the following segments:
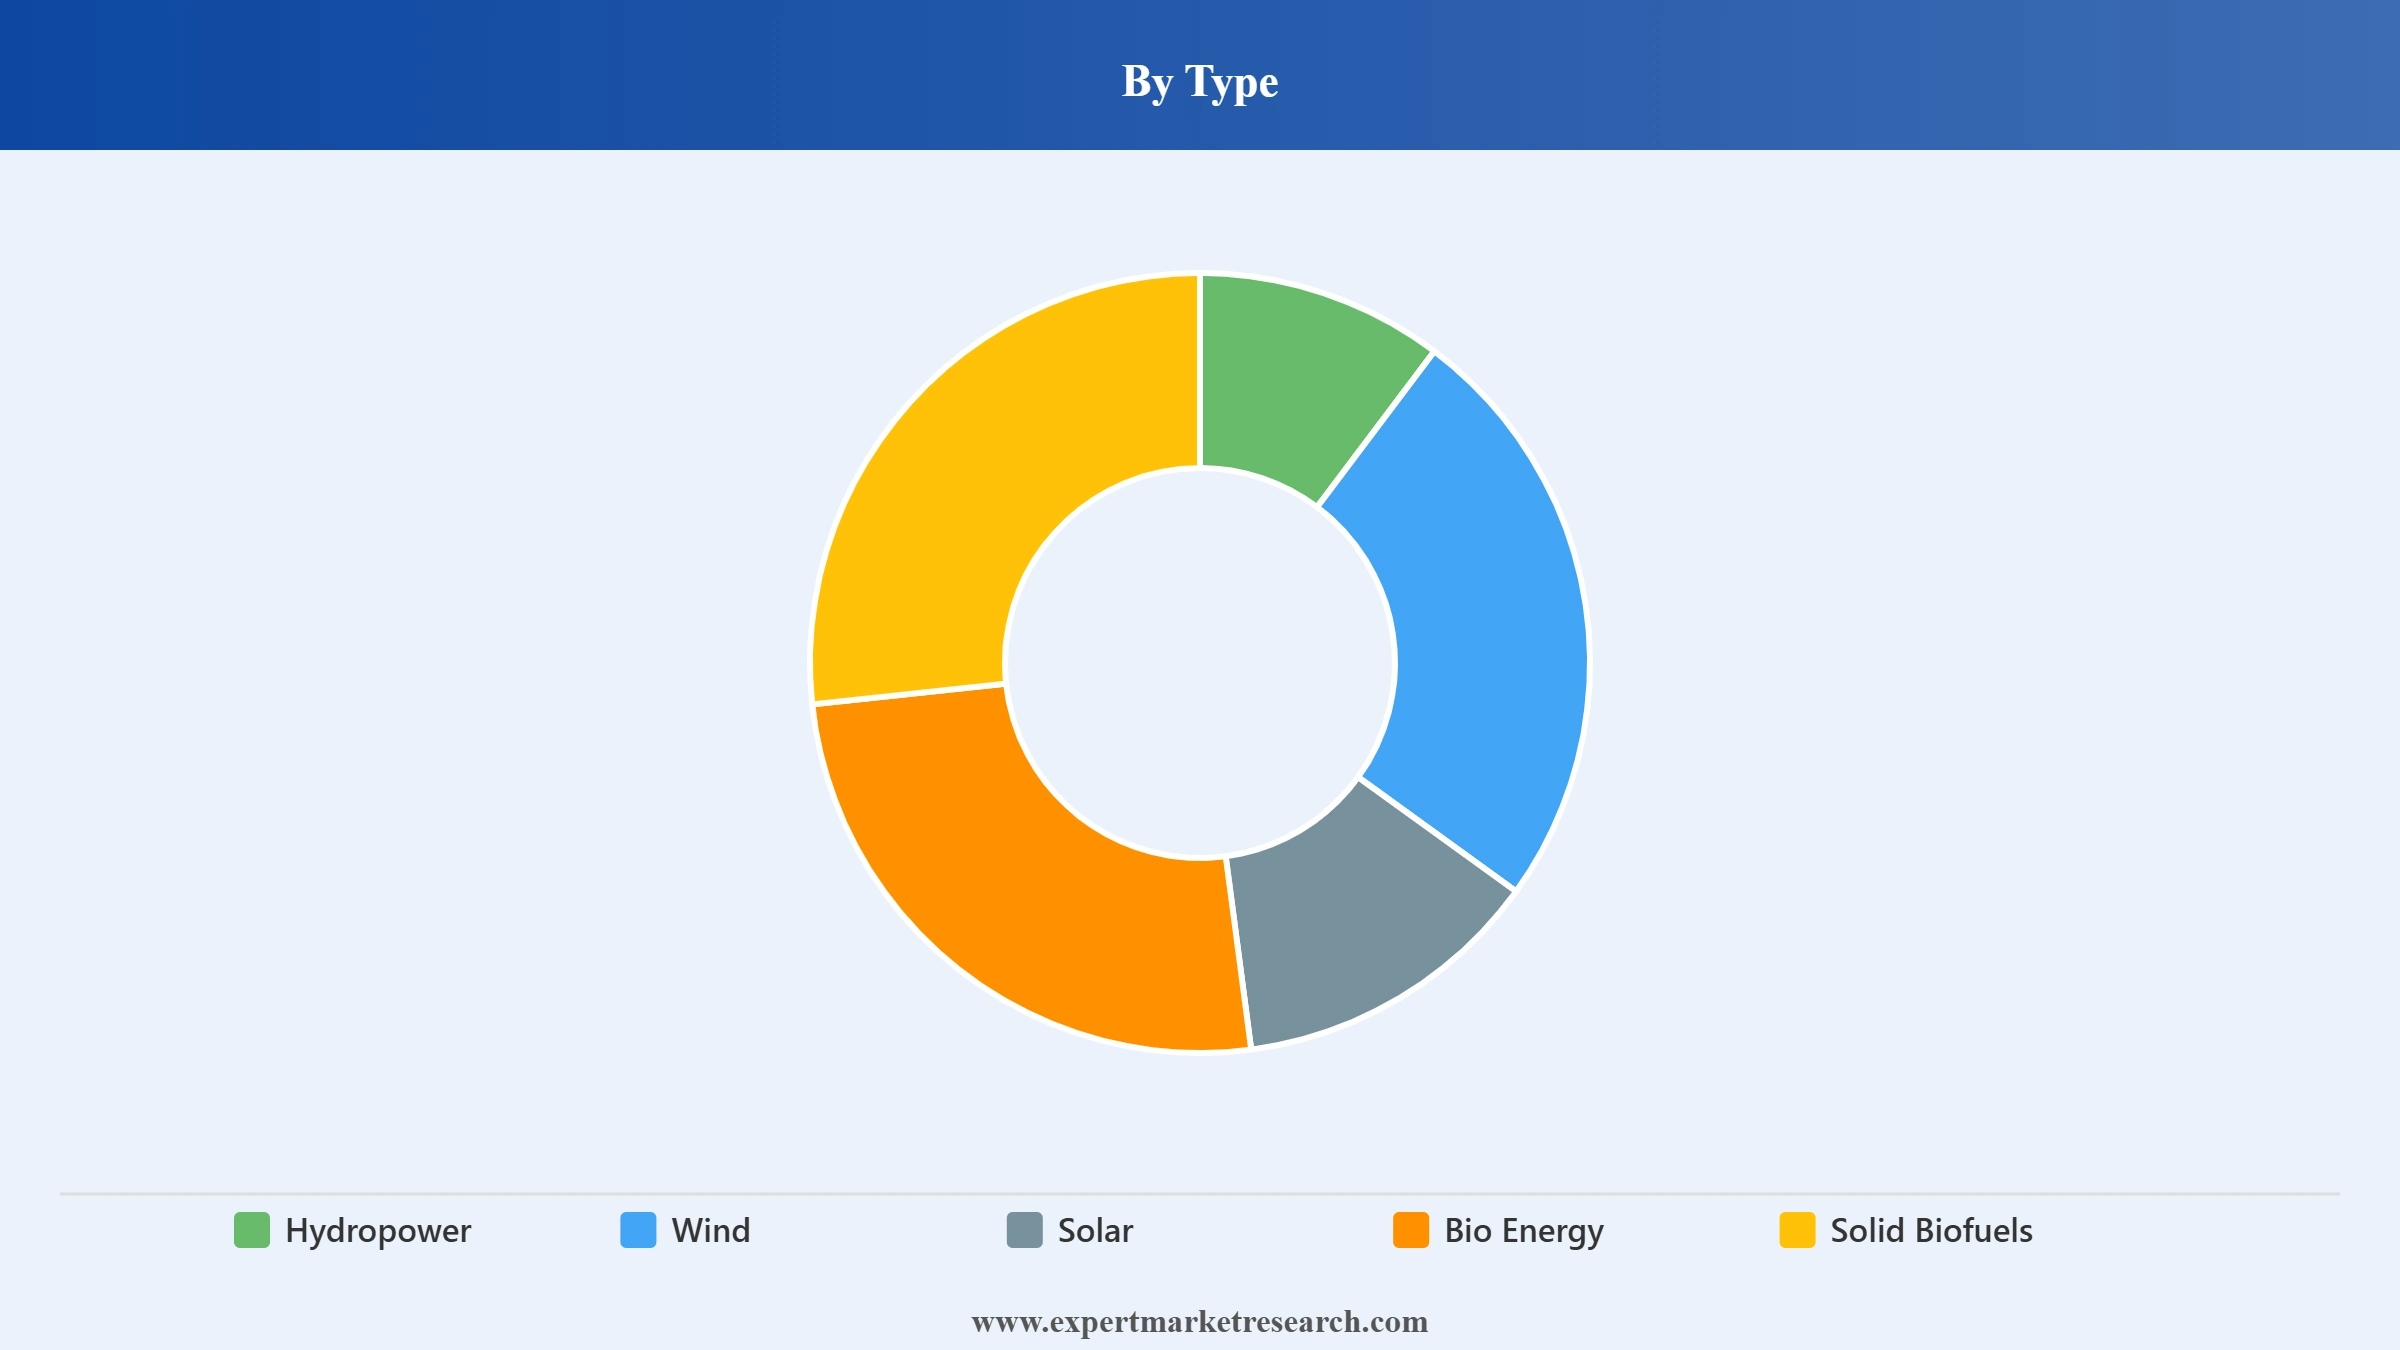
Market Breakup by Type
Key Insight: Solar is the fastest-growing and increasingly dominant technology type in the Asia Pacific renewable energy market, driven by continuous cost reductions and large-scale deployment across China, India, and Australia. Hydropower remains foundational, particularly in China and Southeast Asia, providing baseload renewable generation capacity. Wind energy is expanding rapidly, with both onshore and offshore projects gaining momentum across coastal economies including China, Vietnam, and Japan.
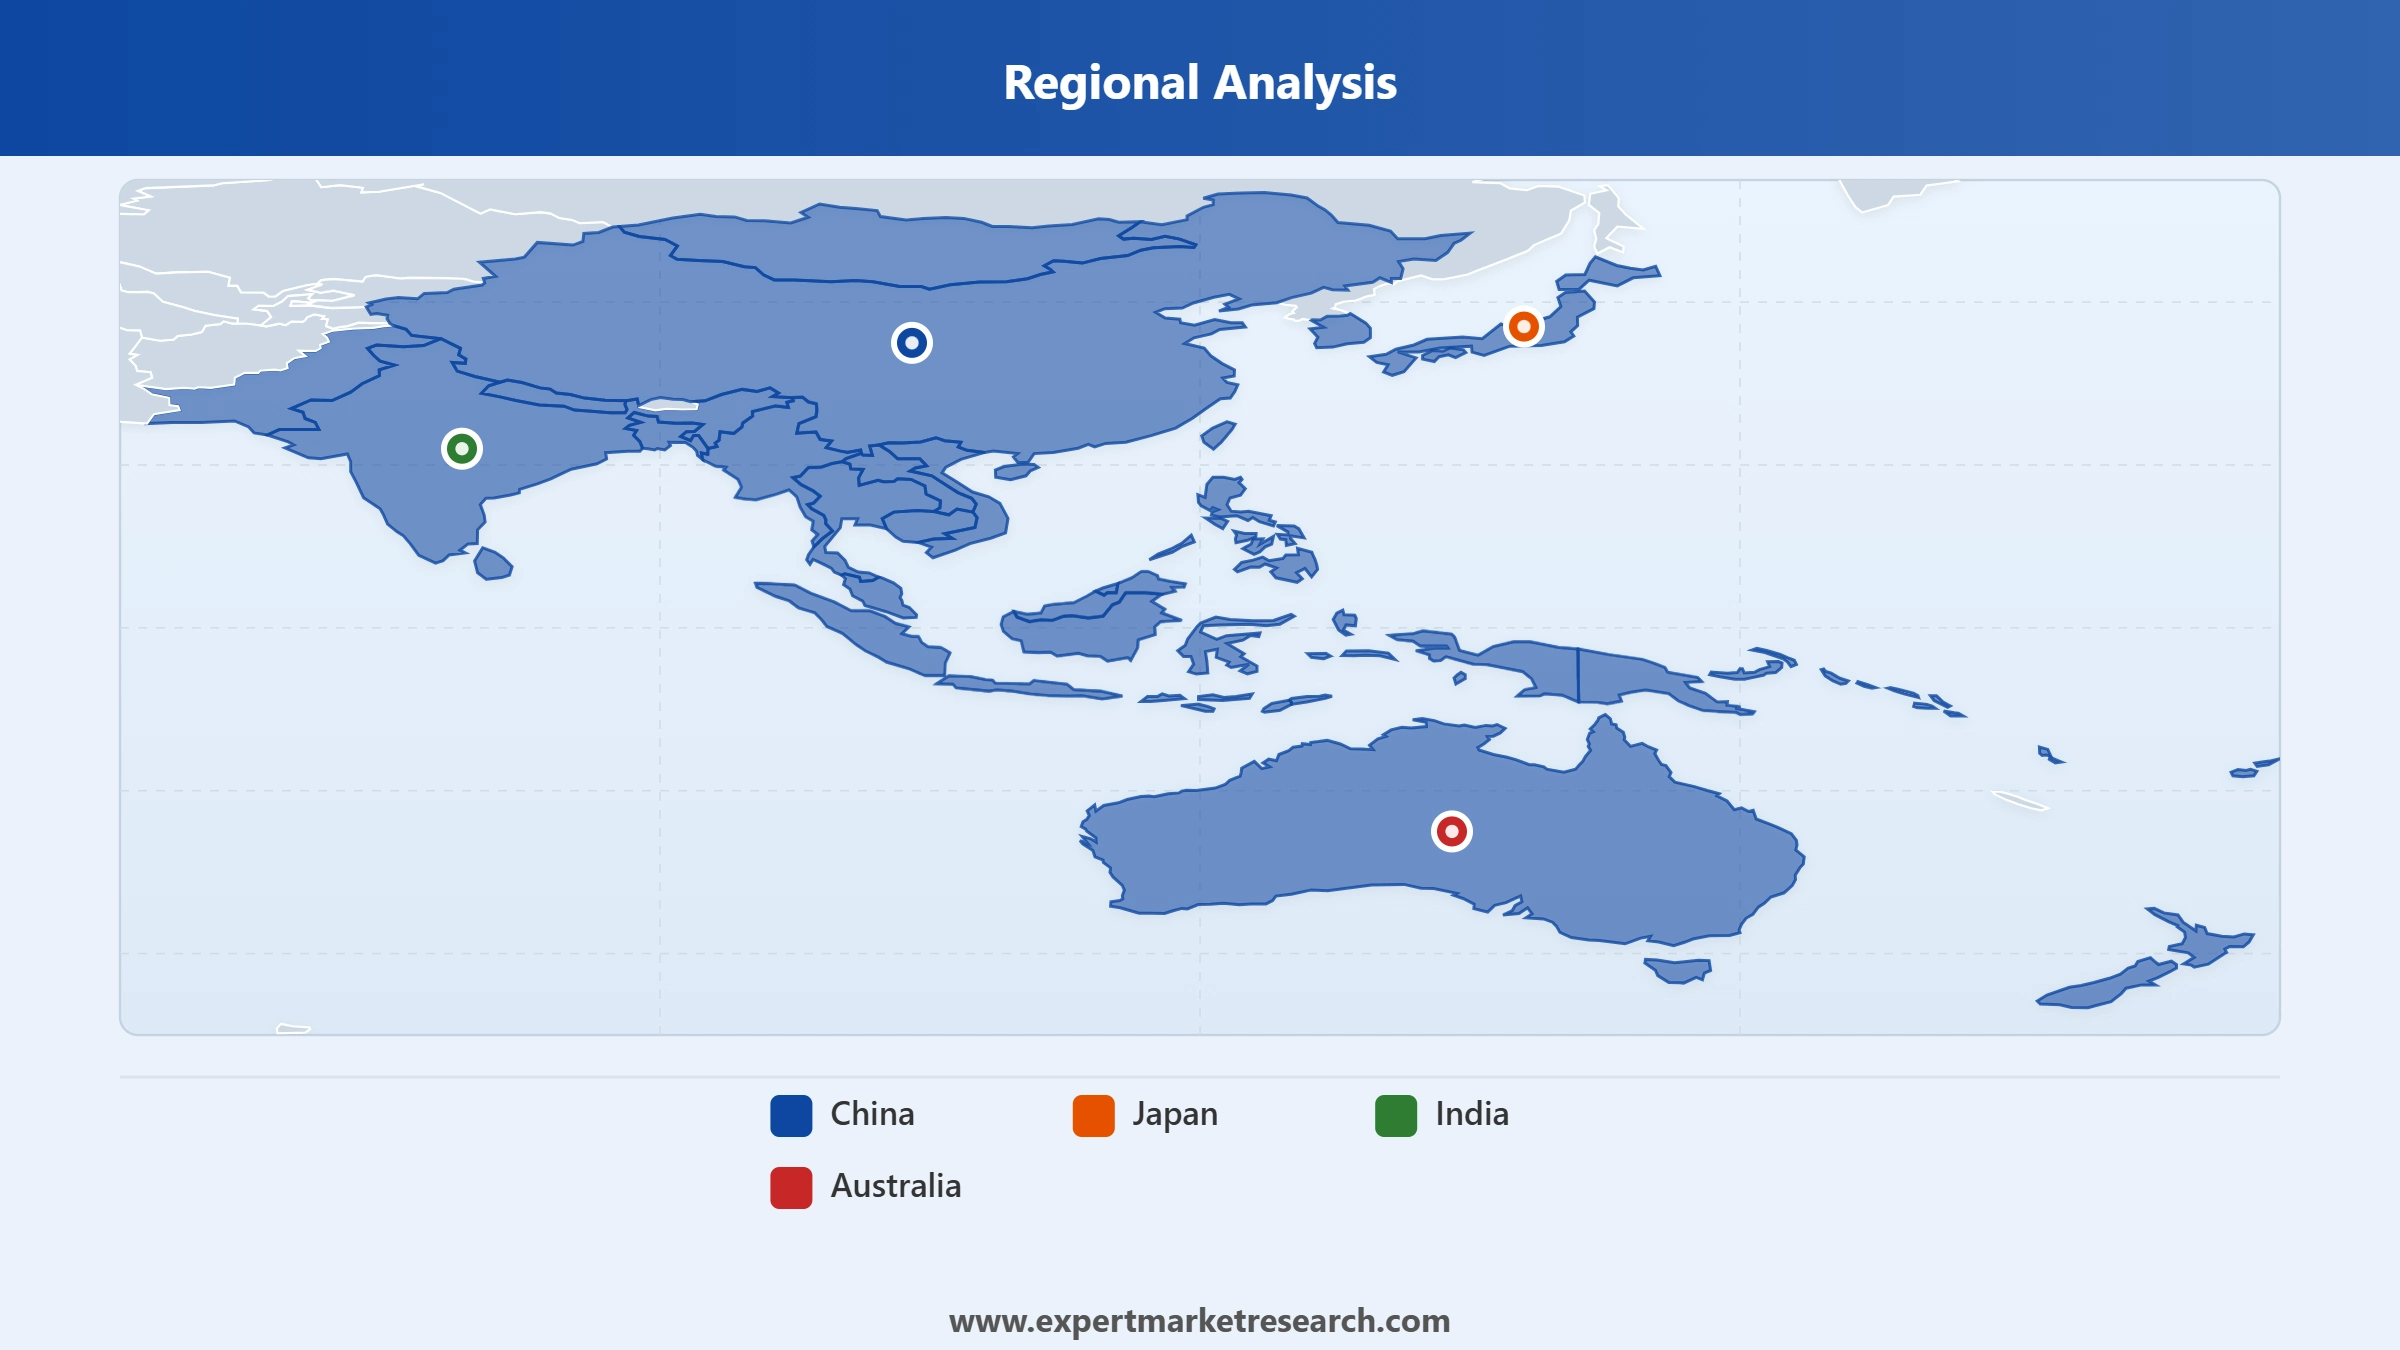
Market Breakup by Country
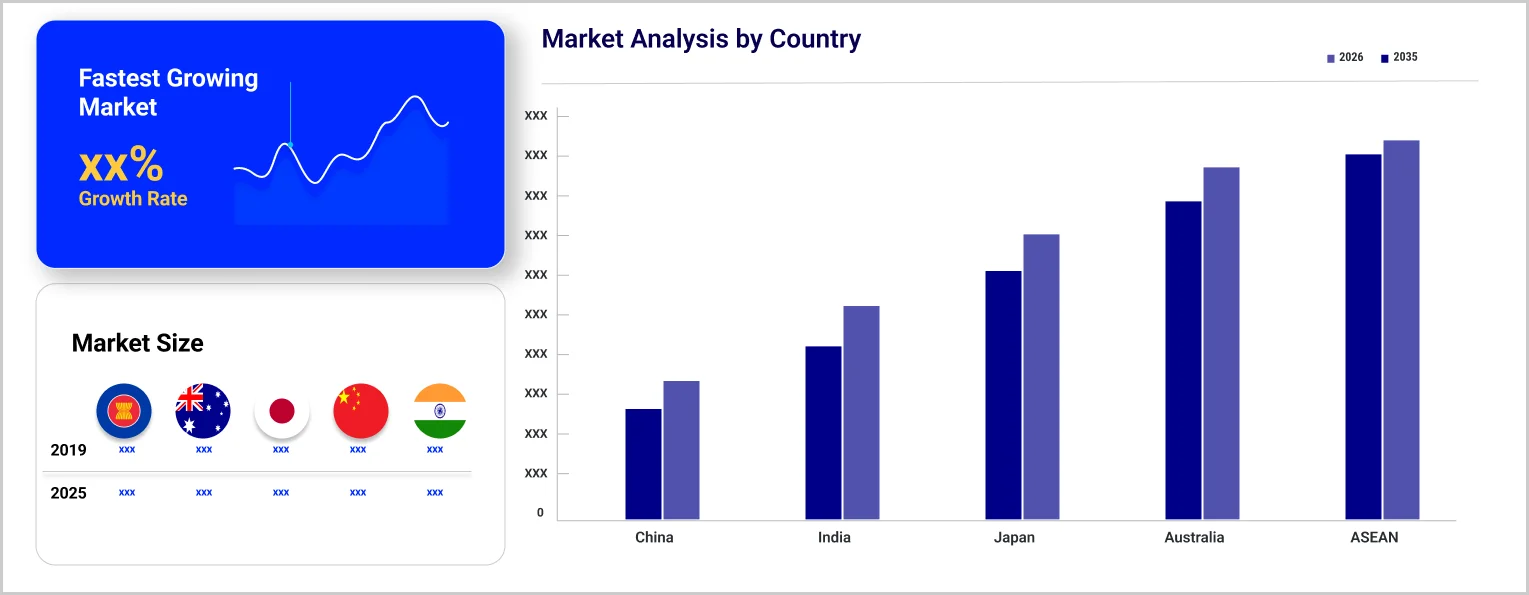
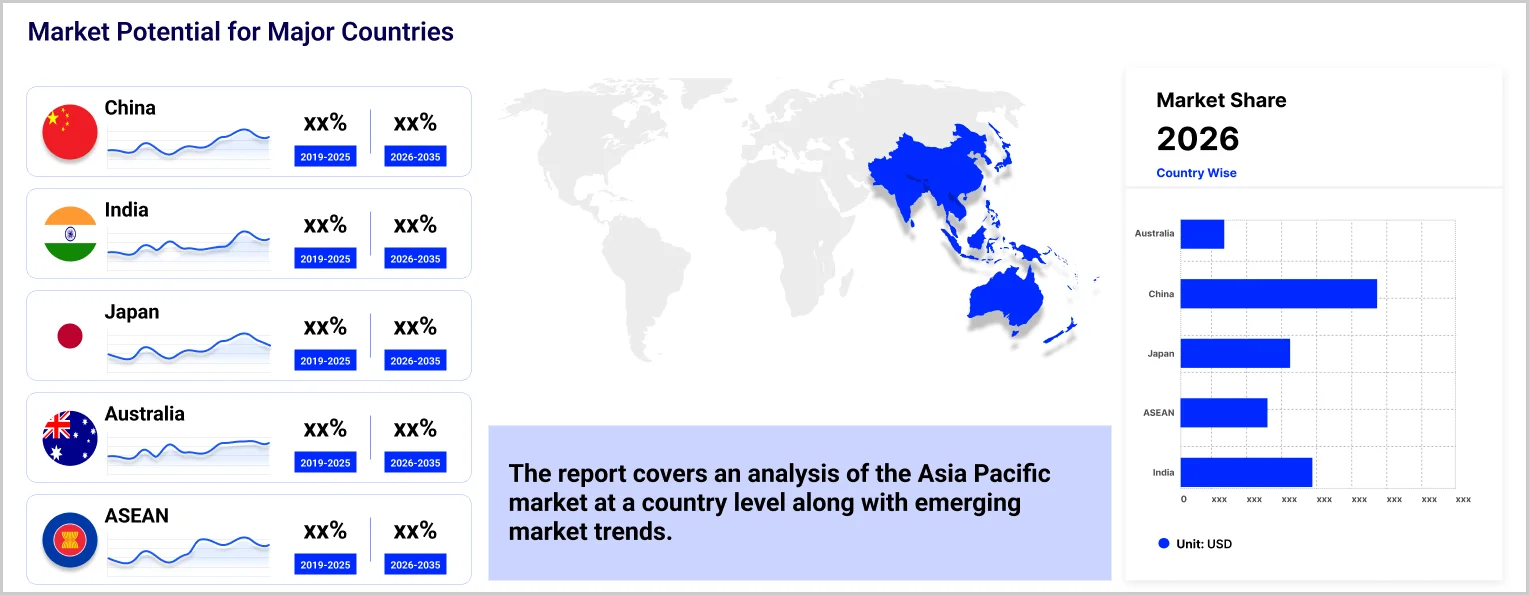
Key Insight: China dominates the Asia Pacific renewable energy market, accounting for the largest installed capacity and investment volume across all renewable technology types. India is the fastest-growing country market, supported by ambitious capacity targets, competitive auctions, and strong private sector participation. Australia is emerging as a major green hydrogen and offshore wind destination, while Japan is prioritising offshore wind and hydrogen to achieve its carbon neutrality commitments.
Read more about this report - REQUEST FREE SAMPLE COPY IN PDF
By Type, solar energy dominates due to rapid cost reductions and large-scale utility project deployment
Solar energy is becoming the dominant technology type in the Asia Pacific renewable energy market, driven by photovoltaic module cost reductions exceeding 90% over the past decade and accelerating deployment of utility-scale projects across China, India, and Australia. China alone added over 200 GW of solar capacity in 2024, underscoring the scale of solar-led growth. Government auction programmes across India and Southeast Asia continue to deliver competitive tariffs supporting solar project economics at scale.
Read more about this report - REQUEST FREE SAMPLE COPY IN PDF
Hydropower remains the largest installed capacity base in the Asia Pacific renewable energy market, particularly in China and Southeast Asia, providing essential baseload generation complementing variable solar and wind output. In May 2026, Tata Power and Druk Green Power identified the 404 MW Nyera Amari Hydropower Project for bilateral collaboration, reflecting continued investment in cross-border hydropower development. China's ongoing expansion of pumped-storage facilities further integrates hydropower into a flexible, grid-balancing role.
By Country, China leads the market due to unrivalled scale of renewable capacity additions and investment
China leads the Asia Pacific renewable energy market by a significant margin, accounting for the largest installed renewable capacity globally and driving the majority of annual additions across solar, wind, and hydropower segments. State-owned enterprises and independent producers are executing large-scale renewable projects at unmatched speed, supported by China's 14th Five-Year Plan targets and its commitment to carbon neutrality by 2060. Chinese manufacturers also supply global solar module and wind turbine markets, reinforcing systemic influence.
Read more about this report - REQUEST FREE SAMPLE COPY IN PDF
India is the fastest-growing country in the Asia Pacific renewable energy market, targeting 500 GW of non-fossil capacity by 2030 and attracting record domestic and foreign investment. In March 2025, Tata Power Renewable Energy signed a memorandum of understanding with the Government of Andhra Pradesh for up to 7 GW of renewable capacity. India's competitive auction regime, production-linked incentives, and green hydrogen mission are creating one of the region's most dynamic investment environments.
East Asia leads the market driven by China's unparalleled renewable capacity scale and investment volume
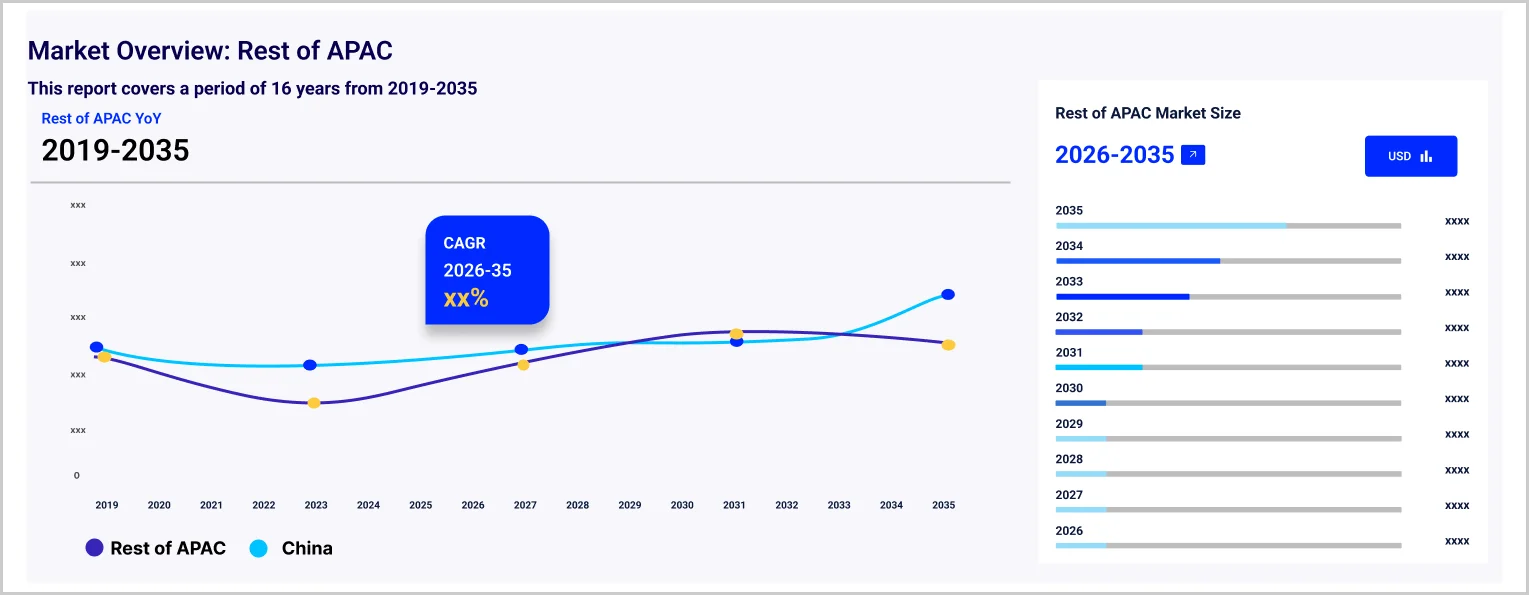
East Asia, anchored by China, dominates the Asia Pacific renewable energy market and accounts for the majority of regional installed capacity and annual investment. China's ambitious deployment targets, state-backed financing, and vertically integrated supply chains make it the single largest driver of regional growth. Japan is advancing its offshore wind sector, with government targets for 30 to 45 GW of offshore capacity by 2040, alongside significant hydrogen and ammonia co-firing investments.
South Asia is emerging as the second major growth pole in the Asia Pacific renewable energy market, with India executing the world's largest renewable capacity addition programme. Strong policy frameworks including the Production Linked Incentive scheme and the National Green Hydrogen Mission are attracting domestic conglomerates and international developers. India's favourable solar irradiance, declining land costs in renewable energy zones, and improving grid evacuation infrastructure are jointly supporting project viability at scale.
The Asia Pacific renewable energy market features state-owned enterprises, diversified utilities, independent power producers, and international energy majors competing for project opportunities across solar, wind, hydropower, and green hydrogen segments. Consolidation is ongoing as larger players absorb smaller independent developers to build diversified portfolios across geographies and technology types. Chinese state utilities, Indian conglomerates, and Australian infrastructure funds are among the most active participants in the region.
TBEA Sunoasis is a leading Chinese provider of solar energy engineering, procurement, and construction services, specialising in utility-scale photovoltaic power plant development. As part of TBEA Group, it delivers integrated solar solutions across China and international markets, combining manufacturing, project development, and grid-connected power station operation in the Asia Pacific renewable energy sector.
Tata Power is India's largest integrated private power utility, with a significant and growing renewable energy portfolio spanning solar, wind, and hybrid projects. Operating across generation, distribution, and solar rooftop segments, Tata Power has committed to a net-zero carbon power portfolio, expanding aggressively in the Asia Pacific renewable energy market through government partnerships and corporate offtake agreements.
Vestas is a global leader in wind energy, designing, manufacturing, installing, and servicing wind turbines across onshore and offshore projects worldwide. With a strong presence across Asia Pacific markets including India, Australia, and China, Vestas supplies advanced turbine technology and long-term service agreements supporting operational performance across the Asia Pacific renewable energy market.
Abengoa is an international technology and engineering company specialising in renewable energy and sustainable infrastructure solutions. The company develops concentrated solar power, photovoltaic, and water treatment projects globally. In the Asia Pacific renewable energy market, Abengoa's expertise in engineering complex renewable energy installations supports project development across multiple geographies.
Other key players in the market include Mahindra EPC Irrigation Limited, Suzhou Talesun Solar Technologies Co. Ltd., Windflow Technology Ltd., Zhejiang Chint New Energy Development Co. Ltd., and Others.
*Please note that this is only a partial list; the complete list of key players is available in the full report. Additionally, the list of key players can be customized to better suit your needs.*
Explore in-depth insights on the Asia Pacific renewable energy market 2026 with our comprehensive industry report. Stay ahead of solar energy expansion, wind capacity additions, green hydrogen emergence, and the policy frameworks shaping investment across the fastest-growing renewable markets through 2035. Whether you are a utility planning capacity additions, a developer seeking market entry intelligence, or an investor evaluating clean energy opportunities, this report delivers the strategic clarity you need. Download your free sample today and unlock key growth opportunities in the dynamic Asia Pacific renewable energy industry.
North America Renewable Energy Market
Latin America Renewable Energy Market
United States Renewable Energy Market
Saudi Arabia Renewable Energy Market
Philippines Renewable Energy Market
Upto 15% Off
USD
$2499 $2249
$3999 $3599
$4999 $4249
$5999 $5099


*While we strive to always give you current and accurate information, the numbers depicted on the website are indicative and may differ from the actual numbers in the main report. At Expert Market Research, we aim to bring you the latest insights and trends in the market. Using our analyses and forecasts, stakeholders can understand the market dynamics, navigate challenges, and capitalize on opportunities to make data-driven strategic decisions.*
In 2025, the Asia Pacific renewable energy market reached an approximate value of USD 378.58 Billion.
Key strategies driving the market include localising supply chains, investing in hybrid systems, forming cross-border consortia, digitising O&M services, and aligning with country-specific policy roadmaps to capitalise on Asia Pacific's renewable energy expansion.
The rising environmental concerns, the surging investment in renewable resource expansion, and the growing focus on eco-friendly development in the region are the key trends guiding the market.
The major countries in the market include China, Japan, India, and Australia, among others.
The dominant types of renewable energy in the market are hydropower, wind, solar, bio energy, and solid biofuels.
The major fuel sources of renewable energy in the market are coal, natural gas, and nuclear renewables, among others.
The major players in the market are TBEA Sunoasis Co., Ltd., Mahindra EPC Irrigation Limited, Tata Power Limited, Suzhou Talesun Solar Technologies Co., Ltd., Windflow Technology Ltd., Zhejiang Chint New Energy Development Co Ltd, Abengoa, and Vestas Wind Systems A/S, among others.
The market is projected to grow at a CAGR of 9.10% between 2026 and 2035.
The market is estimated to witness a healthy growth in the forecast period of 2026-2035 to reach about USD 904.49 Billion by 2035.
The key challenges are grid instability, land acquisition delays, import dependencies for technology components, and inconsistent regulatory frameworks.
Explore our key highlights of the report and gain a concise overview of key findings, trends, and actionable insights that will empower your strategic decisions.
| REPORT FEATURES | DETAILS |
| Base Year | 2025 |
| Historical Period | 2019-2025 |
| Forecast Period | 2026-2035 |
| Scope of the Report |
Historical and Forecast Trends, Industry Drivers and Constraints, Historical and Forecast Market Analysis by Segment:
|
| Breakup by Type |
|
| Breakup by Region |
|
| Market Dynamics |
|
| Competitive Landscape |
|
| Companies Covered |
|
| Report Price and Purchase Option | Explore our purchase options that are best suited to your resources and industry needs. |
| Delivery Format | Delivered as an attached PDF and Excel through email, with an option of receiving an editable PPT, according to the purchase option. |
Datasheet
One User
USD 2,499
USD 2,249
tax inclusive*
Single User License
One User
USD 3,999
USD 3,599
tax inclusive*
Five User License
Five User
USD 4,999
USD 4,249
tax inclusive*
Corporate License
Unlimited Users
USD 5,999
USD 5,099
tax inclusive*
*Please note that the prices mentioned below are starting prices for each bundle type. Kindly contact our team for further details.*
Flash Bundle
Small Business Bundle
Growth Bundle
Enterprise Bundle
*Please note that the prices mentioned below are starting prices for each bundle type. Kindly contact our team for further details.*
Flash Bundle
Number of Reports: 3
20%
tax inclusive*
Small Business Bundle
Number of Reports: 5
25%
tax inclusive*
Growth Bundle
Number of Reports: 8
30%
tax inclusive*
Enterprise Bundle
Number of Reports: 10
35%
tax inclusive*
How To Order

Select License Type
Choose the right license for your needs and access rights.

Click on ‘Buy Now’
Add the report to your cart with one click and proceed to register.

Select Mode of Payment
Choose a payment option for a secure checkout. You will be redirected accordingly.
Strategic Solutions for Informed Decision-Making
Gain insights to stay ahead and seize opportunities.

Get insights & trends for a competitive edge.

Track prices with detailed trend reports.

Analyse trade data for supply chain insights.

Leverage cost reports for smart savings

Enhance supply chain with partnerships.

Connect For More Information
Our expert team of analysts will offer full support and resolve any queries regarding the report, before and after the purchase.
Our expert team of analysts will offer full support and resolve any queries regarding the report, before and after the purchase.
We employ meticulous research methods, blending advanced analytics and expert insights to deliver accurate, actionable industry intelligence, staying ahead of competitors.
Our skilled analysts offer unparalleled competitive advantage with detailed insights on current and emerging markets, ensuring your strategic edge.
We offer an in-depth yet simplified presentation of industry insights and analysis to meet your specific requirements effectively.


