

Consumer Insights
Uncover trends and behaviors shaping consumer choices today
Procurement Insights
Optimize your sourcing strategy with key market data
Industry Stats
Stay ahead with the latest trends and market analysis.
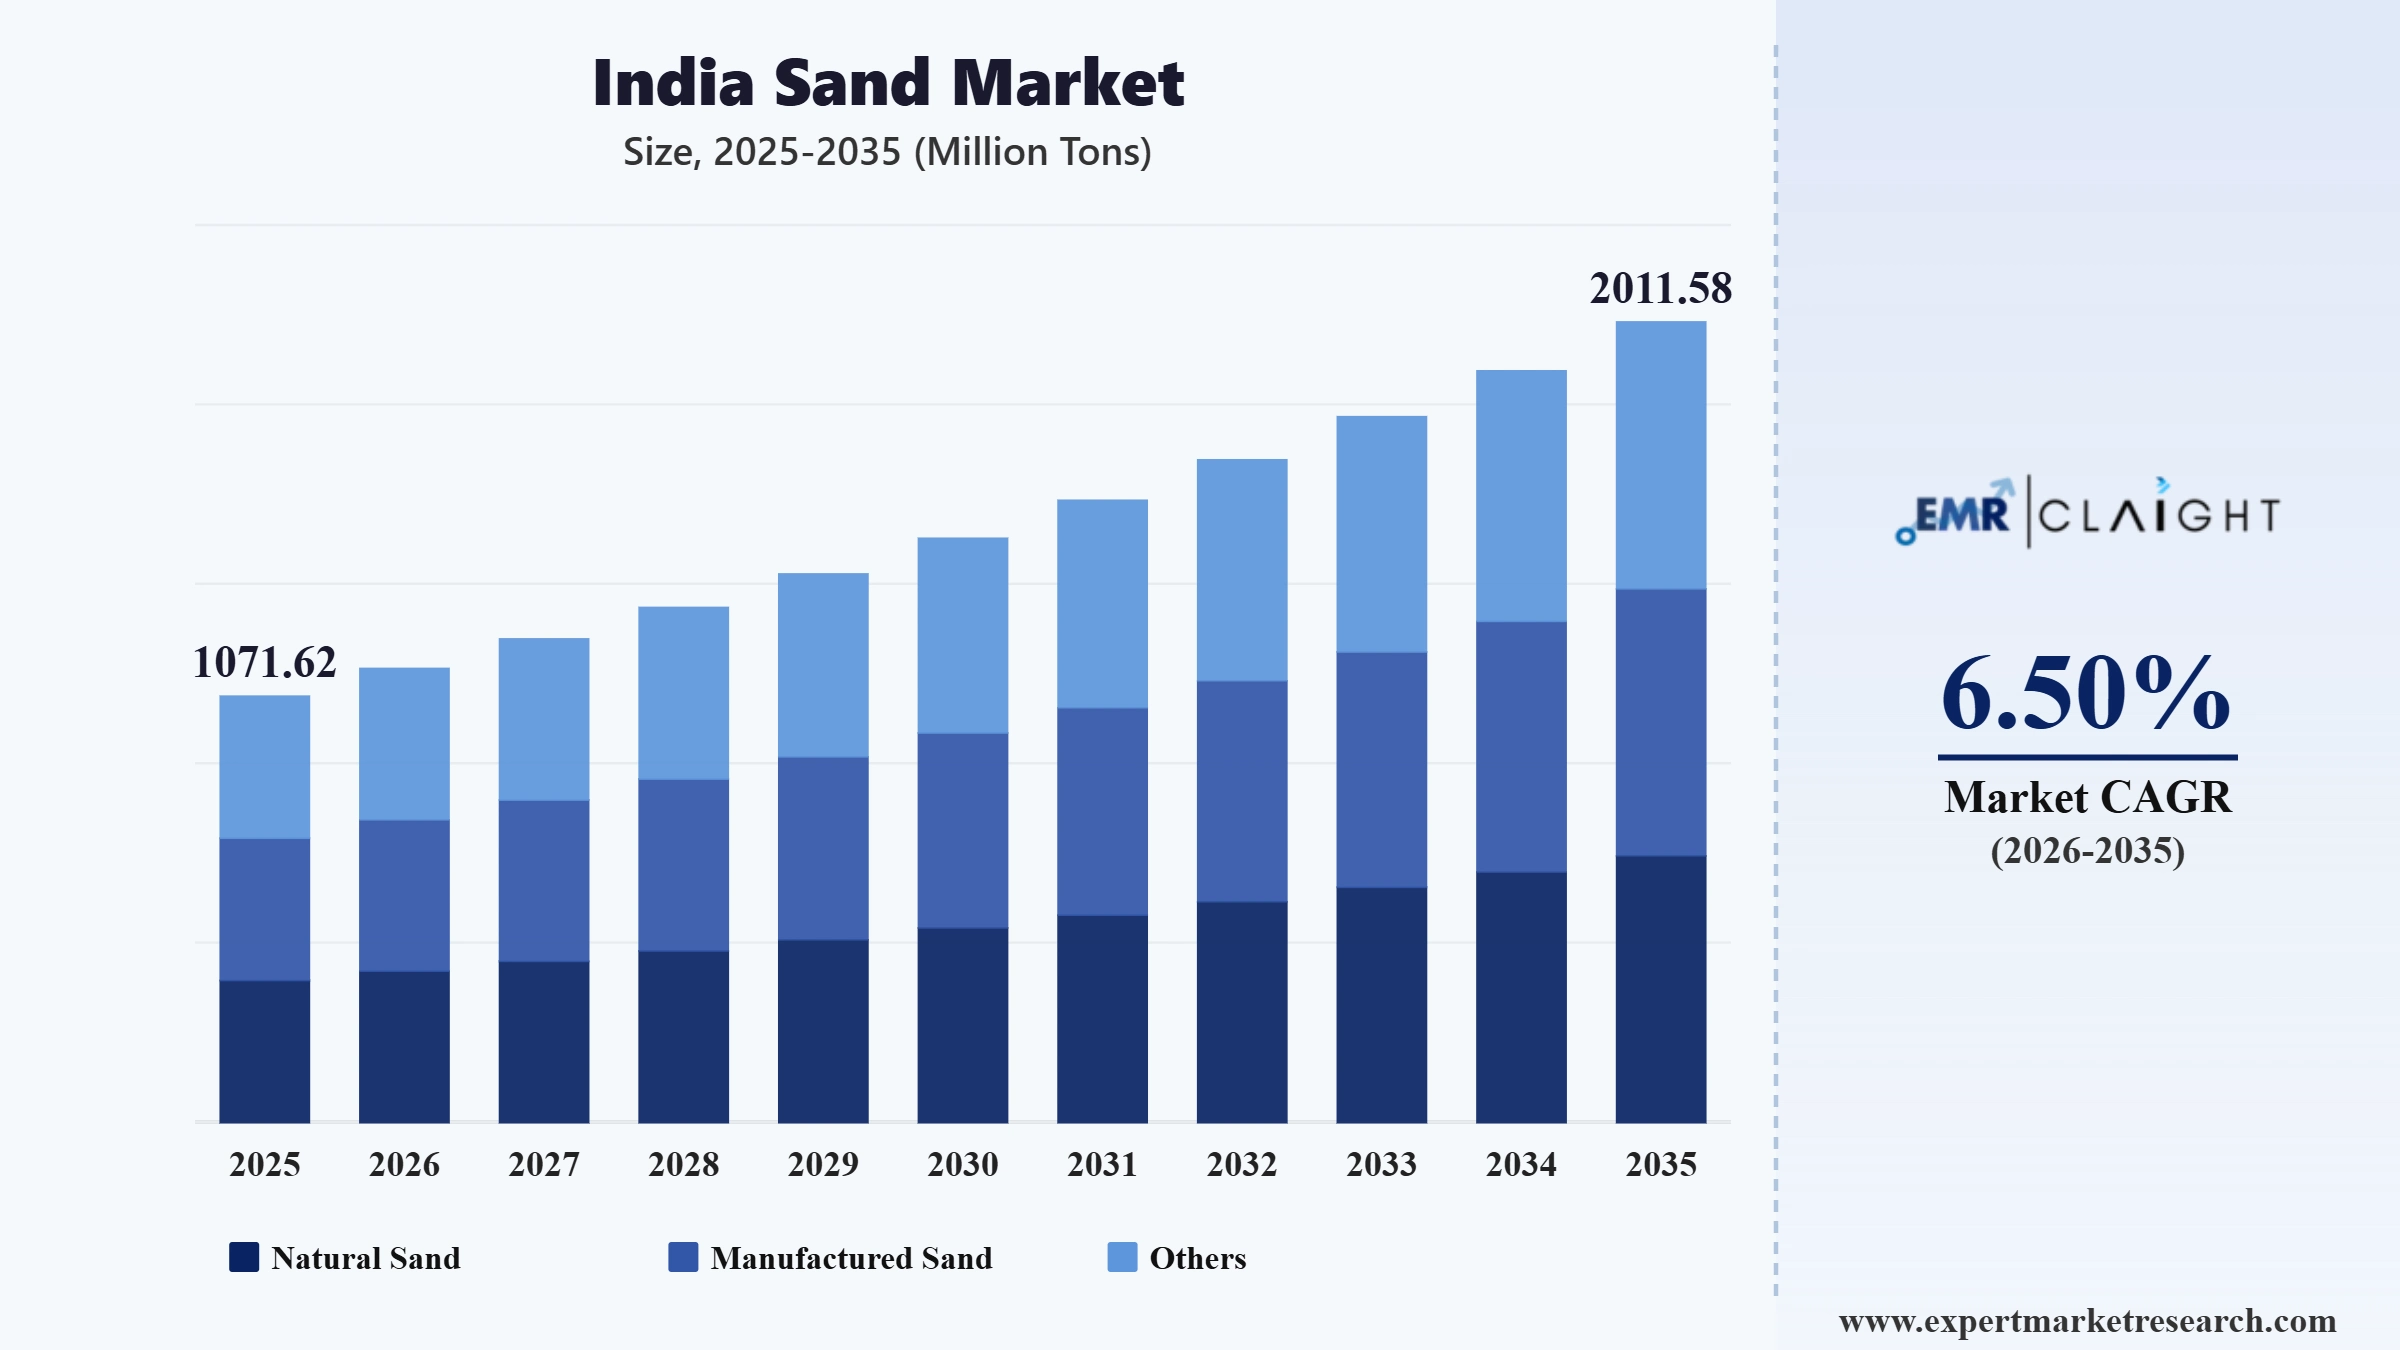
The India sand market attained a volume of 1071.62 Million Tons in 2025. The industry is expected to grow at a CAGR of 6.50% during the forecast period of 2026-2035 to reach a volume of 2011.58 Million Tons by 2035.
Growth in the sand market in India is spurred by government policy shifts, urbanisation pressures, and sustainable construction innovations. The continuous demand for sand in the country is due to infrastructure expansion, meanwhile illegal mining, environmental constraints, and supply chain inconsistencies have pushed the market towards regulated, tech-enabled alternatives. For example, the auction of sand mines in India is an initiative aimed at regulating the extraction of sand, promoting transparency, curbing illegal mining, and ensuring proper revenue generation for state governments. States like Madhya Pradesh, Odisha and Rajasthan have actively participated in the auction. Madhya Pradesh successfully auctioned 40 sand clusters, resulting in an increased revenue of INR 1243 crore in FY 2023-24.
Another trend making shifts in the India sand market is the “Sand Mining Framework” introduced by the Ministry of Mines. The initiative focuses on transparent sand pricing, e-auctions, and replenishment studies for sustainable sourcing. According to the Indian Bureau of Mines, the annual demand for sand is expected to cross 1.5 billion tonnes by 2030, with half of that stemming from smart city and industrial corridor developments. In Tamil Nadu and Maharashtra, public-private partnerships are enabling GPS-tracked sand transport logistics, reducing pilferage and boosting price efficiency.
In addition, the reuse of processed waste sand is now being incentivised under the Gati Shakti Master Plan. This evolving shift from riverbed dependence to alternative and manufactured sand sources has been economical for companies. For B2B players in construction, aggregates, and infrastructure logistics, the India sand market is becoming less about raw volume and more about intelligent sourcing.
Read more about this report - REQUEST FREE SAMPLE COPY IN PDF
| India Sand Market Report Summary | Description | Value |
| Base Year | Million Tons | 2025 |
| Historical Period | Million Tons | 2019-2025 |
| Forecast Period | Million Tons | 2026-2035 |
| Market Size 2025 | Million Tons | 1071.62 |
| Market Size 2035 | Million Tons | 2011.58 |
| CAGR 2019-2025 | Percentage | XX% |
| CAGR 2026-2035 | Percentage | 6.50% |
| CAGR 2026-2035 - Market by Region | Uttar Pradesh | 8.5% |
| CAGR 2026-2035 - Market by Type | Manufactured Sand | 7.3% |
| CAGR 2026-2035 - Market by Application | Industrial | 7.4% |
The mining department of India started an e-auction procedure to establish 31 M-sand manufacturing facilities throughout the state of Rajasthan in an effort to lessen reliance on river sand. Bids were placed on the Government of India's e-portal between January 28 and February 6.
An electric sand reclaimer was introduced by Resand Ltd., a company that specializes in the regeneration and recycling of foundry sand. With a delivery period of around four to five months, the reclaimer unit is a modular system that is easy for the foundry to install and commission.
Metso announced the release of its first portable Nordwheeler crusher for the manufacturing of produced sand. Since manufactured sand can be used to replace the limited supply of natural sand in the production of concrete, the Nordwheeler HRC 8TM is one of the most effective crushers for creating manufactured sand, providing a more environmentally friendly option.
Coal India Ltd. (CIL) planned to treat overburden rocks for the manufacture of sand in mines where overburden (OB) material, or fractured rock, contains roughly 60% sandstone by volume. This sandstone is obtained by crushing and processing overburden. Overlying rocks and soil are removed as trash during opencast mining in order to extract coal, and OB is piled in dumps.
With the country’s river sand reserves decreasing due to overexploitation, manufactured sand (M-sand) is gaining institutional support, boosting the overall India sand market value. For instance, the Tamil Nadu government has encouraged the M-sand use in all government construction tenders. In response, JSW Cement launched a plant producing eco-friendly M-sand using slag and fly ash, reducing pressure on river ecosystems. These facilities are also eligible for green tax benefits under India's EPCG (Export Promotion Capital Goods) scheme. As M-sand becomes more stable as per costs and regulated, B2B demand from developers, cement companies, and urban infrastructure projects are seeing a notable shift towards this sustainable input.
Illegal sand mining has resulted in over ₹1,100 crore lost revenue; however, local governments are expected to change this scenario. Uttar Pradesh has deployed AI-driven drone surveillance to monitor all kinds of mining activities, with automated anomaly detection systems. Meanwhile, Gujarat uses real-time geotagged vehicle tracking for all registered mining transporters. These innovations are not only curbing losses but also creating data points that help planners optimise routes and mine yield, boosting the India sand market revenue. For logistics operators and mining firms, this digitisation opens up room for compliance-based incentives, digital bidding, and predictive supply analytics for state contracts.
In cities like Delhi and Ahmedabad, construction debris processing plants are now producing quality sand substitutes, shaping the India sand market dynamics. These plants collect, crush, and screen demolition waste, converting it into reusable sand fit for non-structural and landscaping purposes. Startups such as ReMaterials and DebriTech are playing a pivotal role by integrating IoT-based tracking systems that monitor the flow and quality of recycled sand throughout the supply chain. Their technology-led solutions are enabling builders to meet sustainability benchmarks and secure green building certifications under frameworks like IGBC, without compromising on delivery timelines or consistency.
States like Karnataka and Maharashtra have launched official online sand portals with real-time bidding, GPS tracking, and digital payment integration, propelling the sand demand in India. These platforms help optimise last-mile delivery, attracting logistics tech startups and digital fleet operators keen to plug into regulated supply chains. For B2B players, digital procurement brings forecastable pricing and bulk order traceability, aligning with ESG and audit norms increasingly demanded by infrastructure financiers.
India’s EV transition and cloud infrastructure boom are fuelling the sand demand, particularly in key industrial corridors. In Gujarat and Tamil Nadu, where massive EV battery gigafactories and hyperscale data centres are under development, the need for high-quality aggregates is accelerating. These projects require large volumes of sand for concrete foundations, heat-resistant cooling pits, and reinforced access roads capable of supporting heavy equipment movement. With construction timelines often compressed, project contractors are sourcing pre-screened or M-sand variants to ensure consistency.
The EMR’s report titled “India Sand Market Report and Forecast 2026-2035” offers a detailed analysis of the market based on the following segments:
Market Breakup by Type
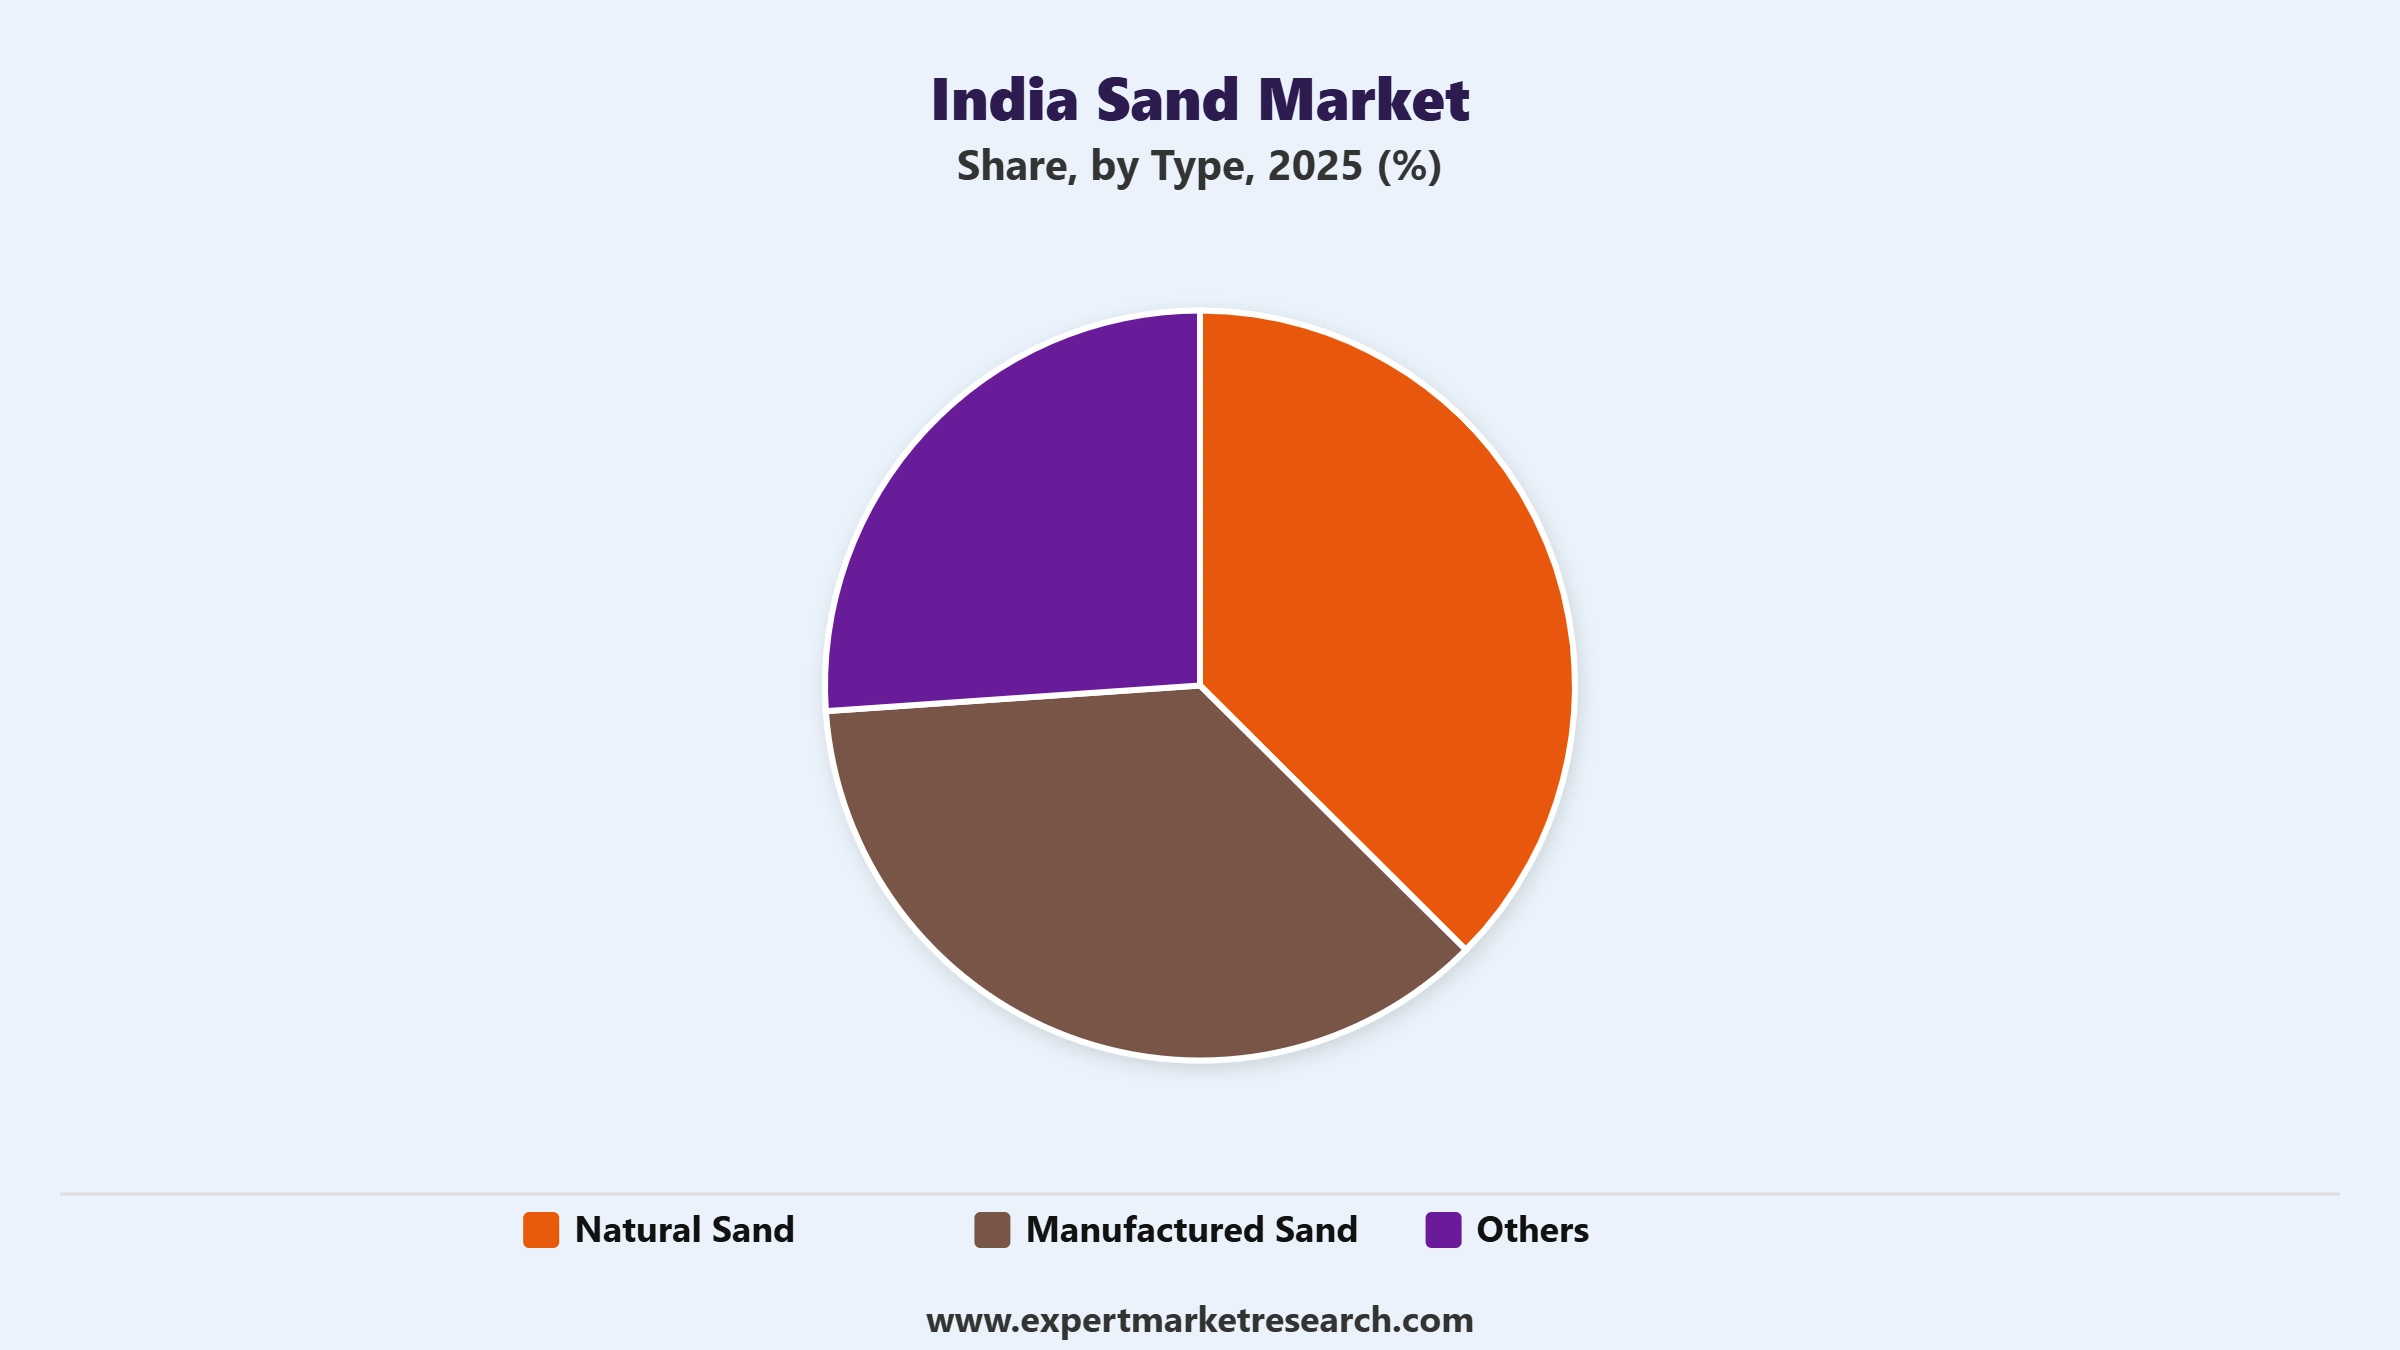
Key Insight: Natural sand, manufactured sand, and alternative types like recycled or marine sand have been considered in the India sand market. While natural sand dominates in public works and rural contracts, M-sand is rapidly becoming the urban standard, especially in sustainable architecture. Recycled sand, on the other hand, offers a circular economy edge for ESG-driven construction firms. Each segment's growth is shaped by application compatibility, pricing stability, and regulatory ease.
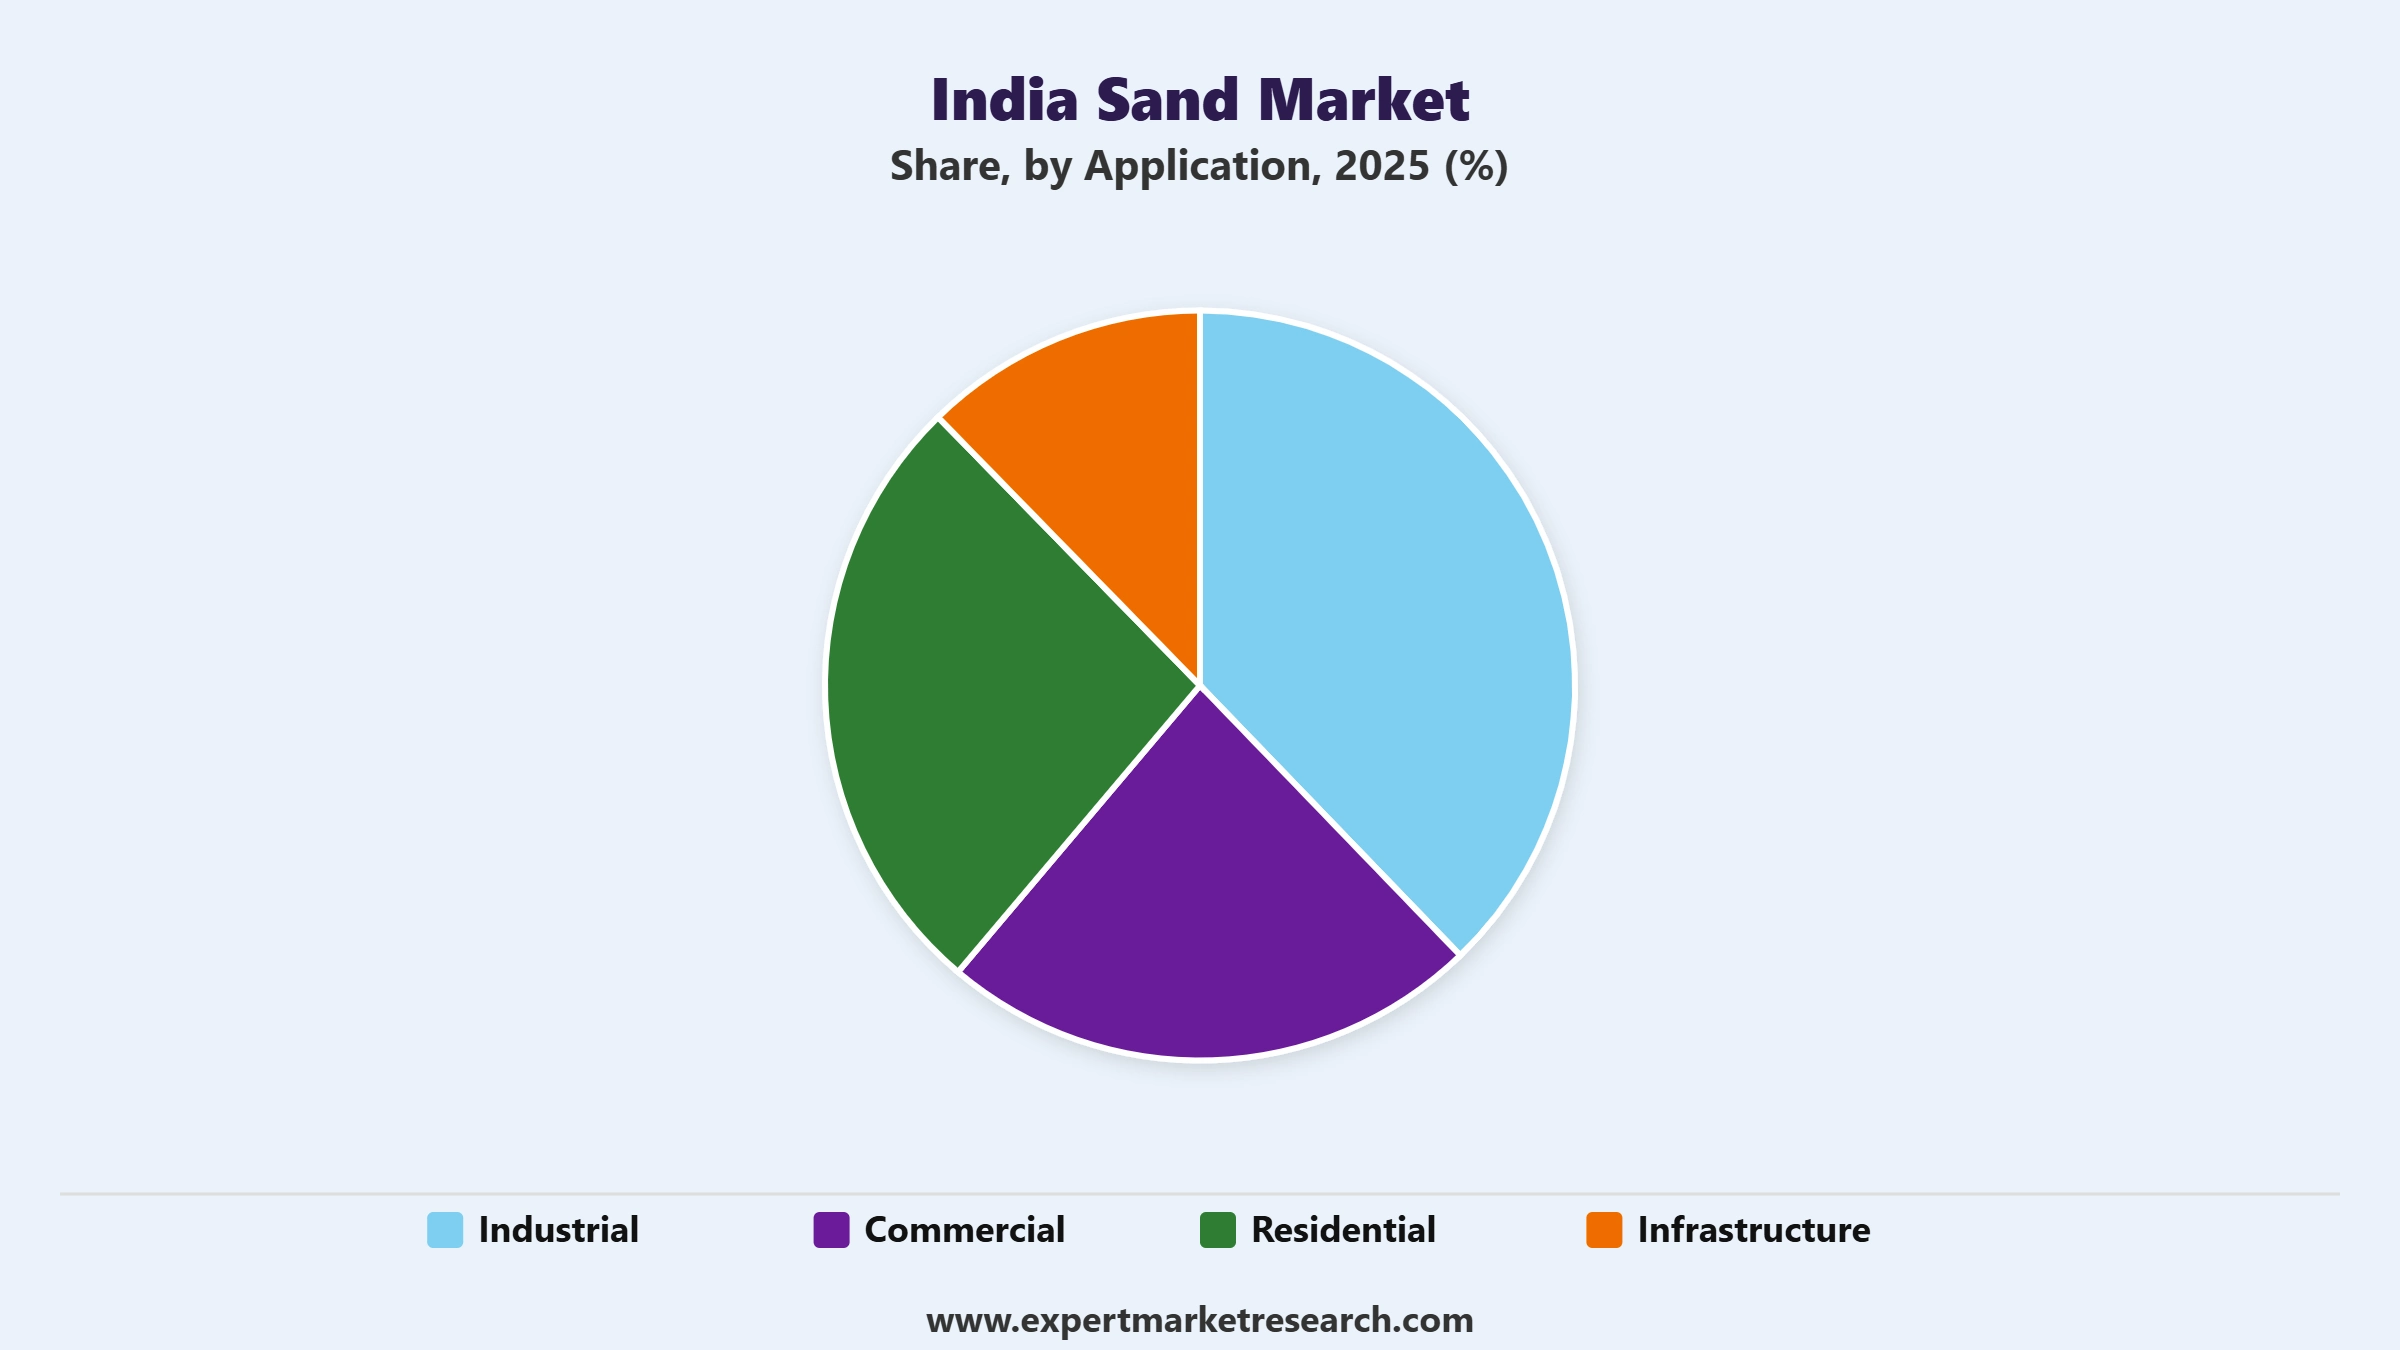
Market Breakup by Application
Key Insight: Sand applications in India spans across infrastructure, residential, industrial, and commercial developments. While infrastructure projects consume the largest volume due to sheer scale, the residential application segment is gaining pace due to volume and consistency needs. Industrial projects, especially in cement, metals, and ports, use sand in base-laying and filter systems. Commercial real estate needs high-purity sand for facade and flooring finishes. The type, grade, and logistics flexibility vary per application, giving B2B suppliers ample scope to specialise or diversify offerings across categories.
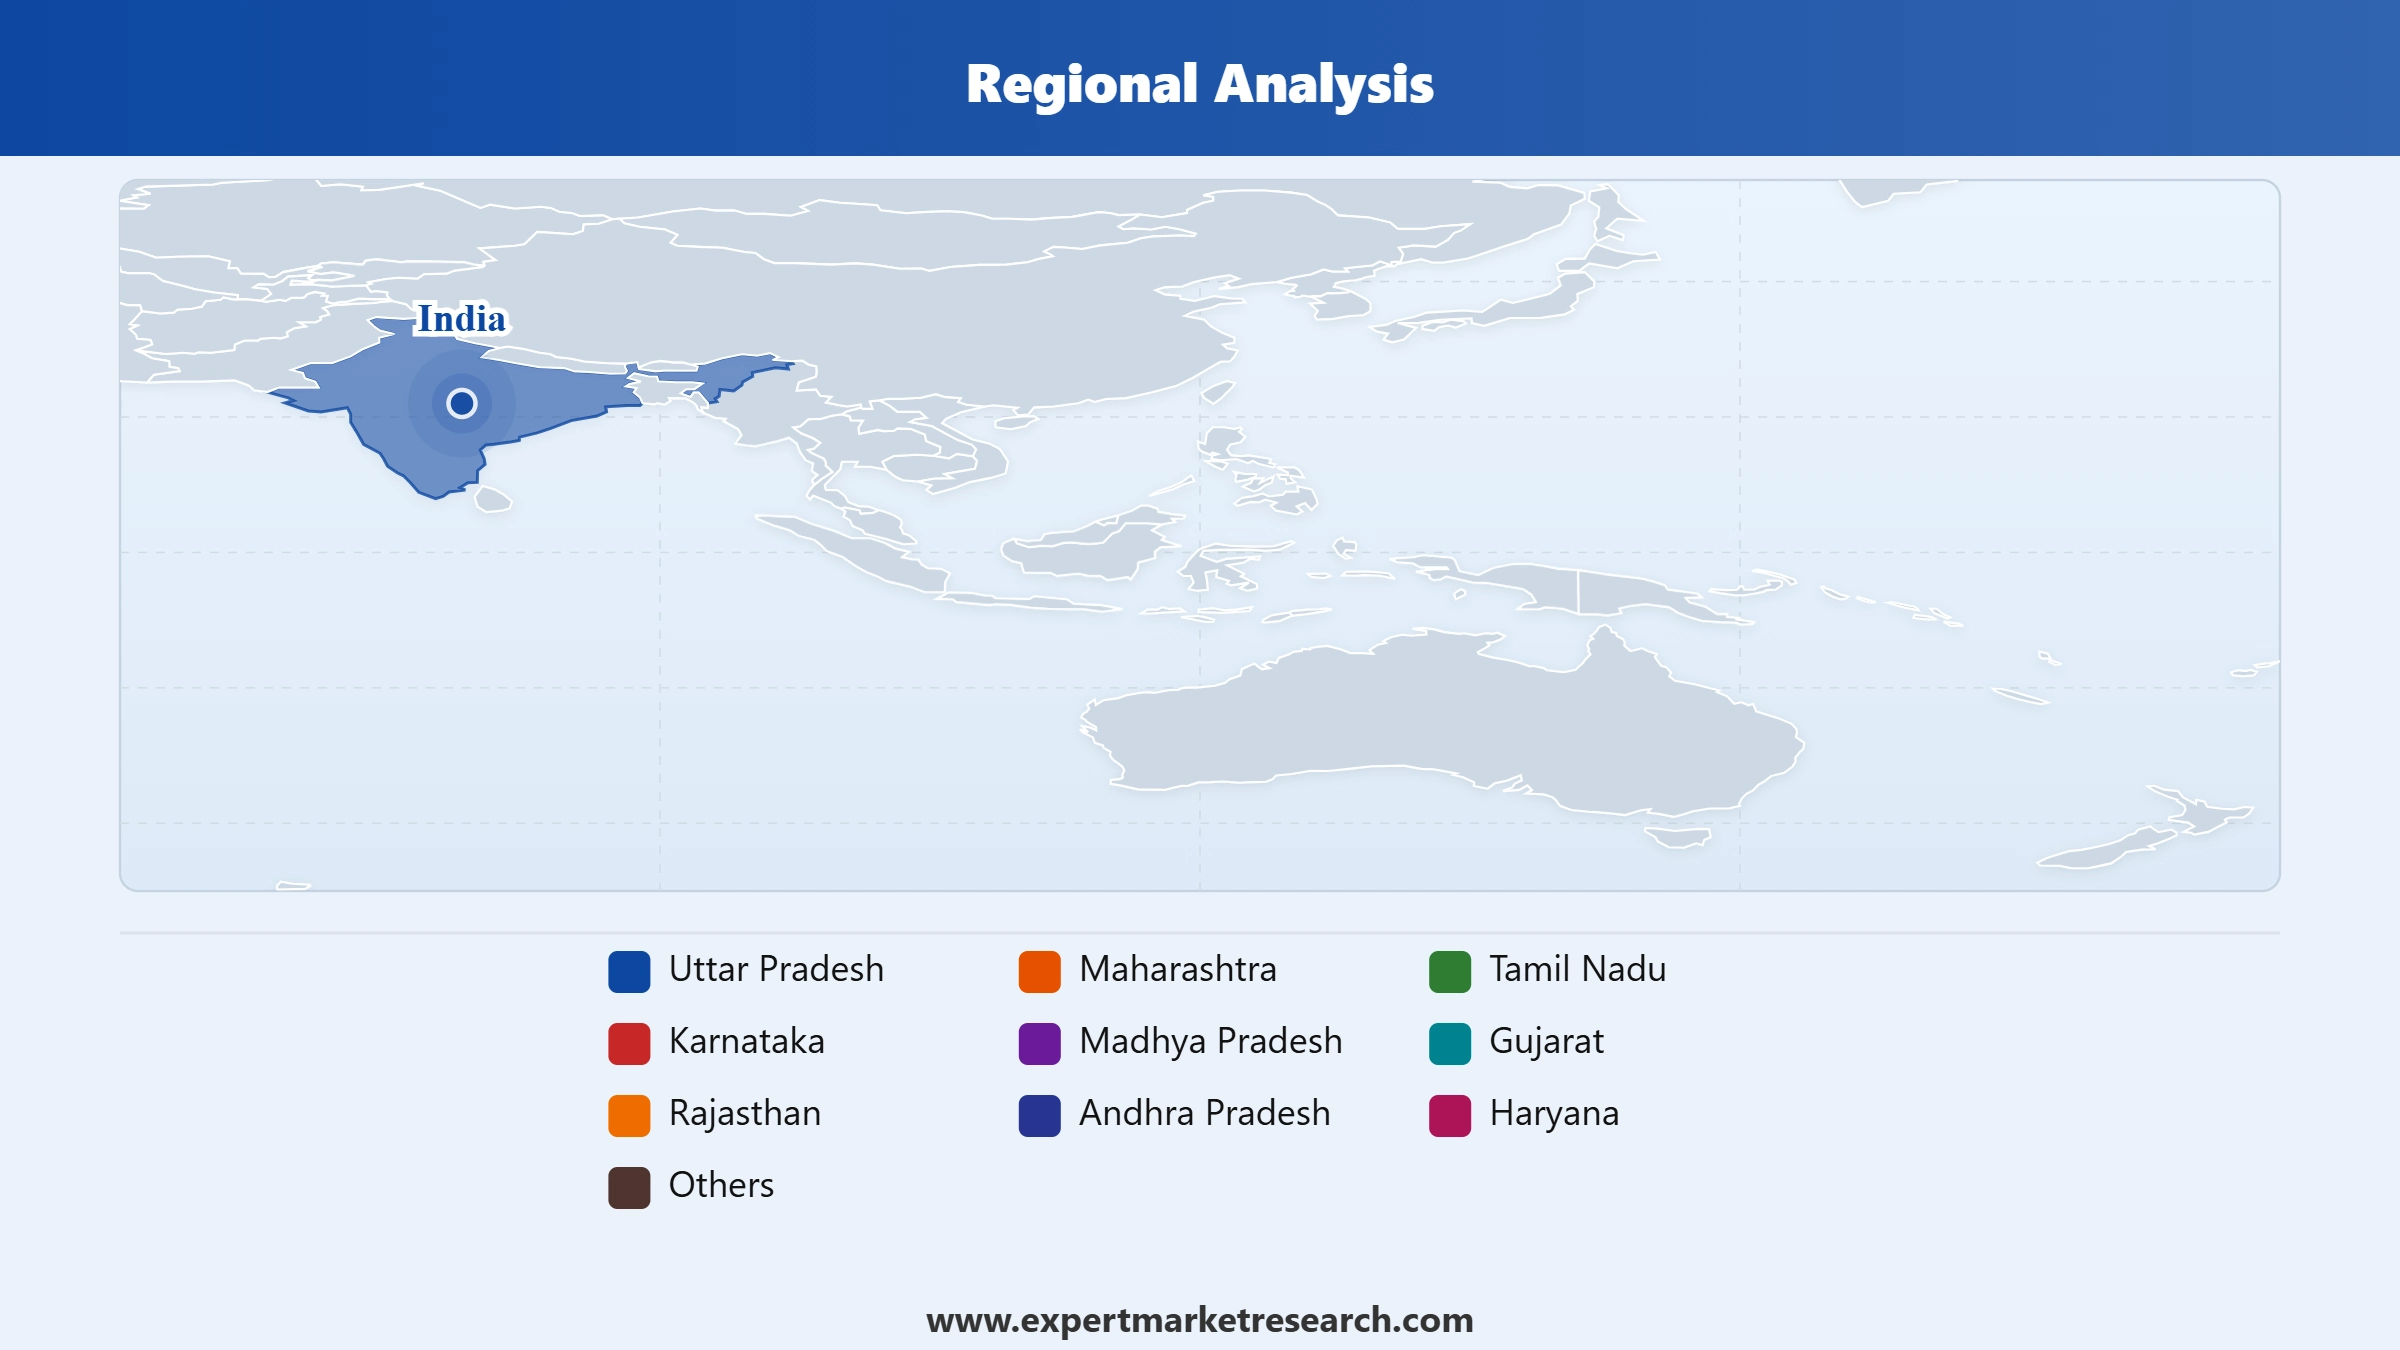
Market Breakup by States
Key Insight: States like Uttar Pradesh, Tamil Nadu, Maharashtra, and Gujarat are dominating the overall sand consumption owing to their project pipelines, sand governance, and material innovation. While northern states rely on river sand and traditional logistics, southern states are pivoting to sustainable and tech-integrated sand sources. Western states, driven by industrial demand, are adopting recycled and M-sand blends. These regional dynamics allow B2B suppliers to localise strategies whether through digital procurement platforms, cooperative tie-ups, or hybrid logistics chains to match state-specific regulatory and market maturity.
Read more about this report - REQUEST FREE SAMPLE COPY IN PDF
By Type, Natural Sand Accounts for the Dominant Share of the Market
Despite rising sustainability concerns, natural sand remains dominant in the India sand market due to its continuous use in public infrastructure and rural construction. In states like Uttar Pradesh and Bihar, local Panchayat bodies still procure bulk natural sand for roadways and flood-repair works. Its low processing requirement keeps costs predictable, making it preferred in low-margin projects. Furthermore, the Central Public Works Department (CPWD) continues to permit natural sand for structural concrete in national projects, particularly where geological characteristics demand specific granular compositions.
Read more about this report - REQUEST FREE SAMPLE COPY IN PDF
Manufactured sand is indicating a sharp rise in adoption across India's top urban and semi-urban centres. Encouraged by policy levers like GST exemption on recycled inputs and priority inclusion in smart city projects, M-sand is replacing natural alternatives in precast and high-rise developments, propelling further demand in the India sand market. Moreover, the advanced M-sand plants like in Ahmedabad use vertical shaft impact crushers and air classification for uniformity, making them ideal for modular construction. For suppliers, the appeal lies in repeat contracts, zero seasonality, and minimal legal compliance burdens compared to river sand procurement.
By Application, Infrastructure Registers the Significant Share of the Market
Infrastructure continues to dominate sand consumption in India, driven by roads, railways, airports, and ports. In cities like Mumbai and Hyderabad, underground metro work and coastal reclamation demand sand mixes that are tested for salinity and bearing capacity. Sand batching units at project sites are being embedded with moisture sensors to reduce cement waste. For sand vendors, infrastructure projects offer scale, long-term contracts, and tech-integrated logistics.
Read more about this report - REQUEST FREE SAMPLE COPY IN PDF
The residential segment, particularly affordable and mid-income housing, has emerged to be the fastest-growing segment in the India sand market. Under PMAY (Pradhan Mantri Awas Yojana), 20 million homes are under active construction, many using modular sand-based blocks. Builders are increasingly using ready-mix M-sand for speed and consistency. In Tier 2 cities, housing clusters like those in Indore and Surat are demanding pre-screened sandbags delivered in bulk via app-based ordering systems. These residential projects often operate under time-bound incentives, requiring on-demand sand supply.
By States, Uttar Pradesh Holds the Leading Position in the Indian Market
Uttar Pradesh dominates the India sand industry, owing the Ganga riverbed mining and an increased number of infrastructure activities under the UP Expressway Industrial Development Authority. The state has also implemented digitised sand tracking systems, linking quarry dispatch to contractor billing via mobile apps. Additionally, the newly launched Warehousing Policy includes mandates for sand-based flooring for cold chains. For sand logistics players, the state offers scale and regulatory maturity, despite political volatility. Localised cooperatives are now being licensed for community-based M-sand production, widening stakeholder involvement.
Read more about this report - REQUEST FREE SAMPLE COPY IN PDF
Tamil Nadu is emerging as the fastest-growing sand market, driven by tech-enabled mining and increasing M-sand adoption. The state has capped river sand extraction and promoted industrial waste-derived alternatives. Additionally, state tenders now incentivise sand sourced from construction waste, with Chennai Corporation leading the reuse model for civic infrastructure. Tamil Nadu is also pioneering academic-industry sand testing labs, standardising quality for builders.
The India sand market players are focusing on four key fronts: traceability, quality control, regulatory compliance, and speed-to-site. Companies like Robo Silicon and Tavara Mines are scaling up M-sand production using AI-integrated crushers. Meanwhile, logistics players like BlackBuck and Rivigo are stepping into last-mile sand delivery, leveraging fleet tracking and IoT integration. Startups in construction technology are collaborating with recyclers to offer sand-on-demand platforms for mid-scale housing developers.
Market entry for new India sand companies is increasingly being shaped by digital compliance readiness and ability to integrate with state sand portals. Those who offer end-to-end solutions, from extraction to batching, are gaining traction among large EPC firms. Opportunity lies in vertical integration, decentralised sand yards, and automation-based quality assurance that meets rising ESG and regulatory demands. Furthermore, AI surveillance, M-sand scaling, recycled debris sand, e-marketplaces, and data centre-driven sand demand are shaping the market. These shifts blend sustainability with technology to redefine how sand is sourced and delivered.
Headquartered in Mumbai, and founded in 1983, Ambuja Cements Ltd, a subsidiary of a multinational conglomerate LafargeHolcim, is one of India's largest cement producers. Ambuja Cement has a cement capacity of 31 million tonnes, along with 5 integrated cement production facilities and 8 cement grinding units, in India. Some of its flagship products include Ambuja Cement Compocem, Ambuja Kawach, Ambuja Cool Walls, and Ambuja Plus.
The POABS GROUP was founded in 1962, in Kerala, as POABSONS, a contracting company that subsequently expanded into multi-disciplinary commercial operations. The company aims to offer technologically viable and sustainable solutions in fields like plantations, infrastructure, waste management, biotechnology, and eco-tourism. Moreover, the company is one of the leading providers in the plantation, biotechnology, and crushing sectors.
A component of Thriveni Earthmovers Private limited, founded in 1994, the focus of Thriveni Sand is on the manufacturing of premium quality sand. Thriveni Sand has three manufacturing plants, namely, the Perindesam plant, the Kamandoddi plant, and the Thorapalli plant. Each day, the Perindesam facility produces 7000 MT of fine and coarse aggregates across a 532-acre area. The construction industry's requirements are fulfilled adequately since the EC capacity in the plant is about 9.311 million tons per year.
Robo Silicon Private Limited, founded in 1999, and based in Hyderabad, aims to offer the finest products in every area, from mining to quarrying to processing and to product delivery. It was the first company to introduce manufactured sand in India, marketing it as ‘ROBOSAND’. It operates ten manufacturing facilities in India and has plans to expand to sixteen more in upcoming years.
*Please note that this is only a partial list; the complete list of key players is available in the full report. Additionally, the list of key players can be customized to better suit your needs.*
Another key player in the market is Tavara Mines & Minerals among others.
Explore the latest trends shaping the India Sand Market 2026-2035 with our in-depth report. Gain strategic insights, future forecasts, and key market developments that can help you stay competitive. Download a free sample report or contact our team for customized consultation on India Sand Market trends 2026.
Latin America Silica Sand Market
Saudi Arabia Silica Sand Market
Asia Pacific Silica Sand Market
Middle East Silica Sand Market
Argentina Frac Sand Market
Cristobalite Sand Market
Silica Sand Market
Frac Sand Market
Upto 15% Off
USD
$2499 $2249
$3999 $3599
$4999 $4249
$5999 $5099


*While we strive to always give you current and accurate information, the numbers depicted on the website are indicative and may differ from the actual numbers in the main report. At Expert Market Research, we aim to bring you the latest insights and trends in the market. Using our analyses and forecasts, stakeholders can understand the market dynamics, navigate challenges, and capitalize on opportunities to make data-driven strategic decisions.*
In 2025, the India sand market reached an approximate volume of 1071.62 Million Tons.
The market is projected to grow at a CAGR of 6.50% between 2026 and 2035.
Key strategies driving the market include adopting digital traceability tools, expanding M-sand capacity, forging state-level PPPs, investing in recycled aggregates, and integrating app-based logistics to streamline bulk delivery and regulatory filings across sand projects.
The key trends augmenting the market’s growth are the increased need for housing and infrastructure and the rising demand for non-natural or synthetic sand.
The major regions in the industry are Uttar Pradesh, Maharashtra, Tamil Nadu, Karnataka, Madhya Pradesh, Gujarat, Rajasthan, Andhra Pradesh, and Haryana, among others.
The manufactured sand segment is the dominant type of sand in the industry.
In terms of application the market is segregated into industrial, commercial, residential, and infrastructure.
The major players in the industry are Ambuja Cements Ltd, H.O. POABS GROUP, Thriveni Sand (Thriveni Earthmovers Private Limited), Robo Silicon Private Limited, and Tavara Mines & Minerals, among others.
The market is estimated to witness a healthy growth in the forecast period of 2026-2035 to reach a volume of 2011.58 Million Tons by 2035.
The key challenges are rising transport costs, illegal competition, rapidly changing regulatory frameworks, and sand quality inconsistencies. Seasonal river mining bans and fragmented approvals further delay project execution and affect cash flow predictability.
Explore our key highlights of the report and gain a concise overview of key findings, trends, and actionable insights that will empower your strategic decisions.
| REPORT FEATURES | DETAILS |
| Base Year | 2025 |
| Historical Period | 2019-2025 |
| Forecast Period | 2026-2035 |
| Scope of the Report |
Historical and Forecast Trends, Industry Drivers and Constraints, Historical and Forecast Market Analysis by Segment:
|
| Breakup by Type |
|
| Breakup by Application |
|
| Breakup by Region |
|
| Market Dynamics |
|
| Competitive Landscape |
|
| Companies Covered |
|
| Report Price and Purchase Option | Explore our purchase options that are best suited to your resources and industry needs. |
| Delivery Format |
Delivered as an attached PDF and Excel through email, with an option of receiving an editable PPT, according to the purchase option. |
Datasheet
One User
USD 2,499
USD 2,249
tax inclusive*
Single User License
One User
USD 3,999
USD 3,599
tax inclusive*
Five User License
Five User
USD 4,999
USD 4,249
tax inclusive*
Corporate License
Unlimited Users
USD 5,999
USD 5,099
tax inclusive*
*Please note that the prices mentioned below are starting prices for each bundle type. Kindly contact our team for further details.*
Flash Bundle
Small Business Bundle
Growth Bundle
Enterprise Bundle
*Please note that the prices mentioned below are starting prices for each bundle type. Kindly contact our team for further details.*
Flash Bundle
Number of Reports: 3
20%
tax inclusive*
Small Business Bundle
Number of Reports: 5
25%
tax inclusive*
Growth Bundle
Number of Reports: 8
30%
tax inclusive*
Enterprise Bundle
Number of Reports: 10
35%
tax inclusive*
How To Order

Select License Type
Choose the right license for your needs and access rights.

Click on ‘Buy Now’
Add the report to your cart with one click and proceed to register.

Select Mode of Payment
Choose a payment option for a secure checkout. You will be redirected accordingly.
Strategic Solutions for Informed Decision-Making
Gain insights to stay ahead and seize opportunities.

Get insights & trends for a competitive edge.

Track prices with detailed trend reports.

Analyse trade data for supply chain insights.

Leverage cost reports for smart savings

Enhance supply chain with partnerships.

Connect For More Information
Our expert team of analysts will offer full support and resolve any queries regarding the report, before and after the purchase.
Our expert team of analysts will offer full support and resolve any queries regarding the report, before and after the purchase.
We employ meticulous research methods, blending advanced analytics and expert insights to deliver accurate, actionable industry intelligence, staying ahead of competitors.
Our skilled analysts offer unparalleled competitive advantage with detailed insights on current and emerging markets, ensuring your strategic edge.
We offer an in-depth yet simplified presentation of industry insights and analysis to meet your specific requirements effectively.


