

Consumer Insights
Uncover trends and behaviors shaping consumer choices today
Procurement Insights
Optimize your sourcing strategy with key market data
Industry Stats
Stay ahead with the latest trends and market analysis.
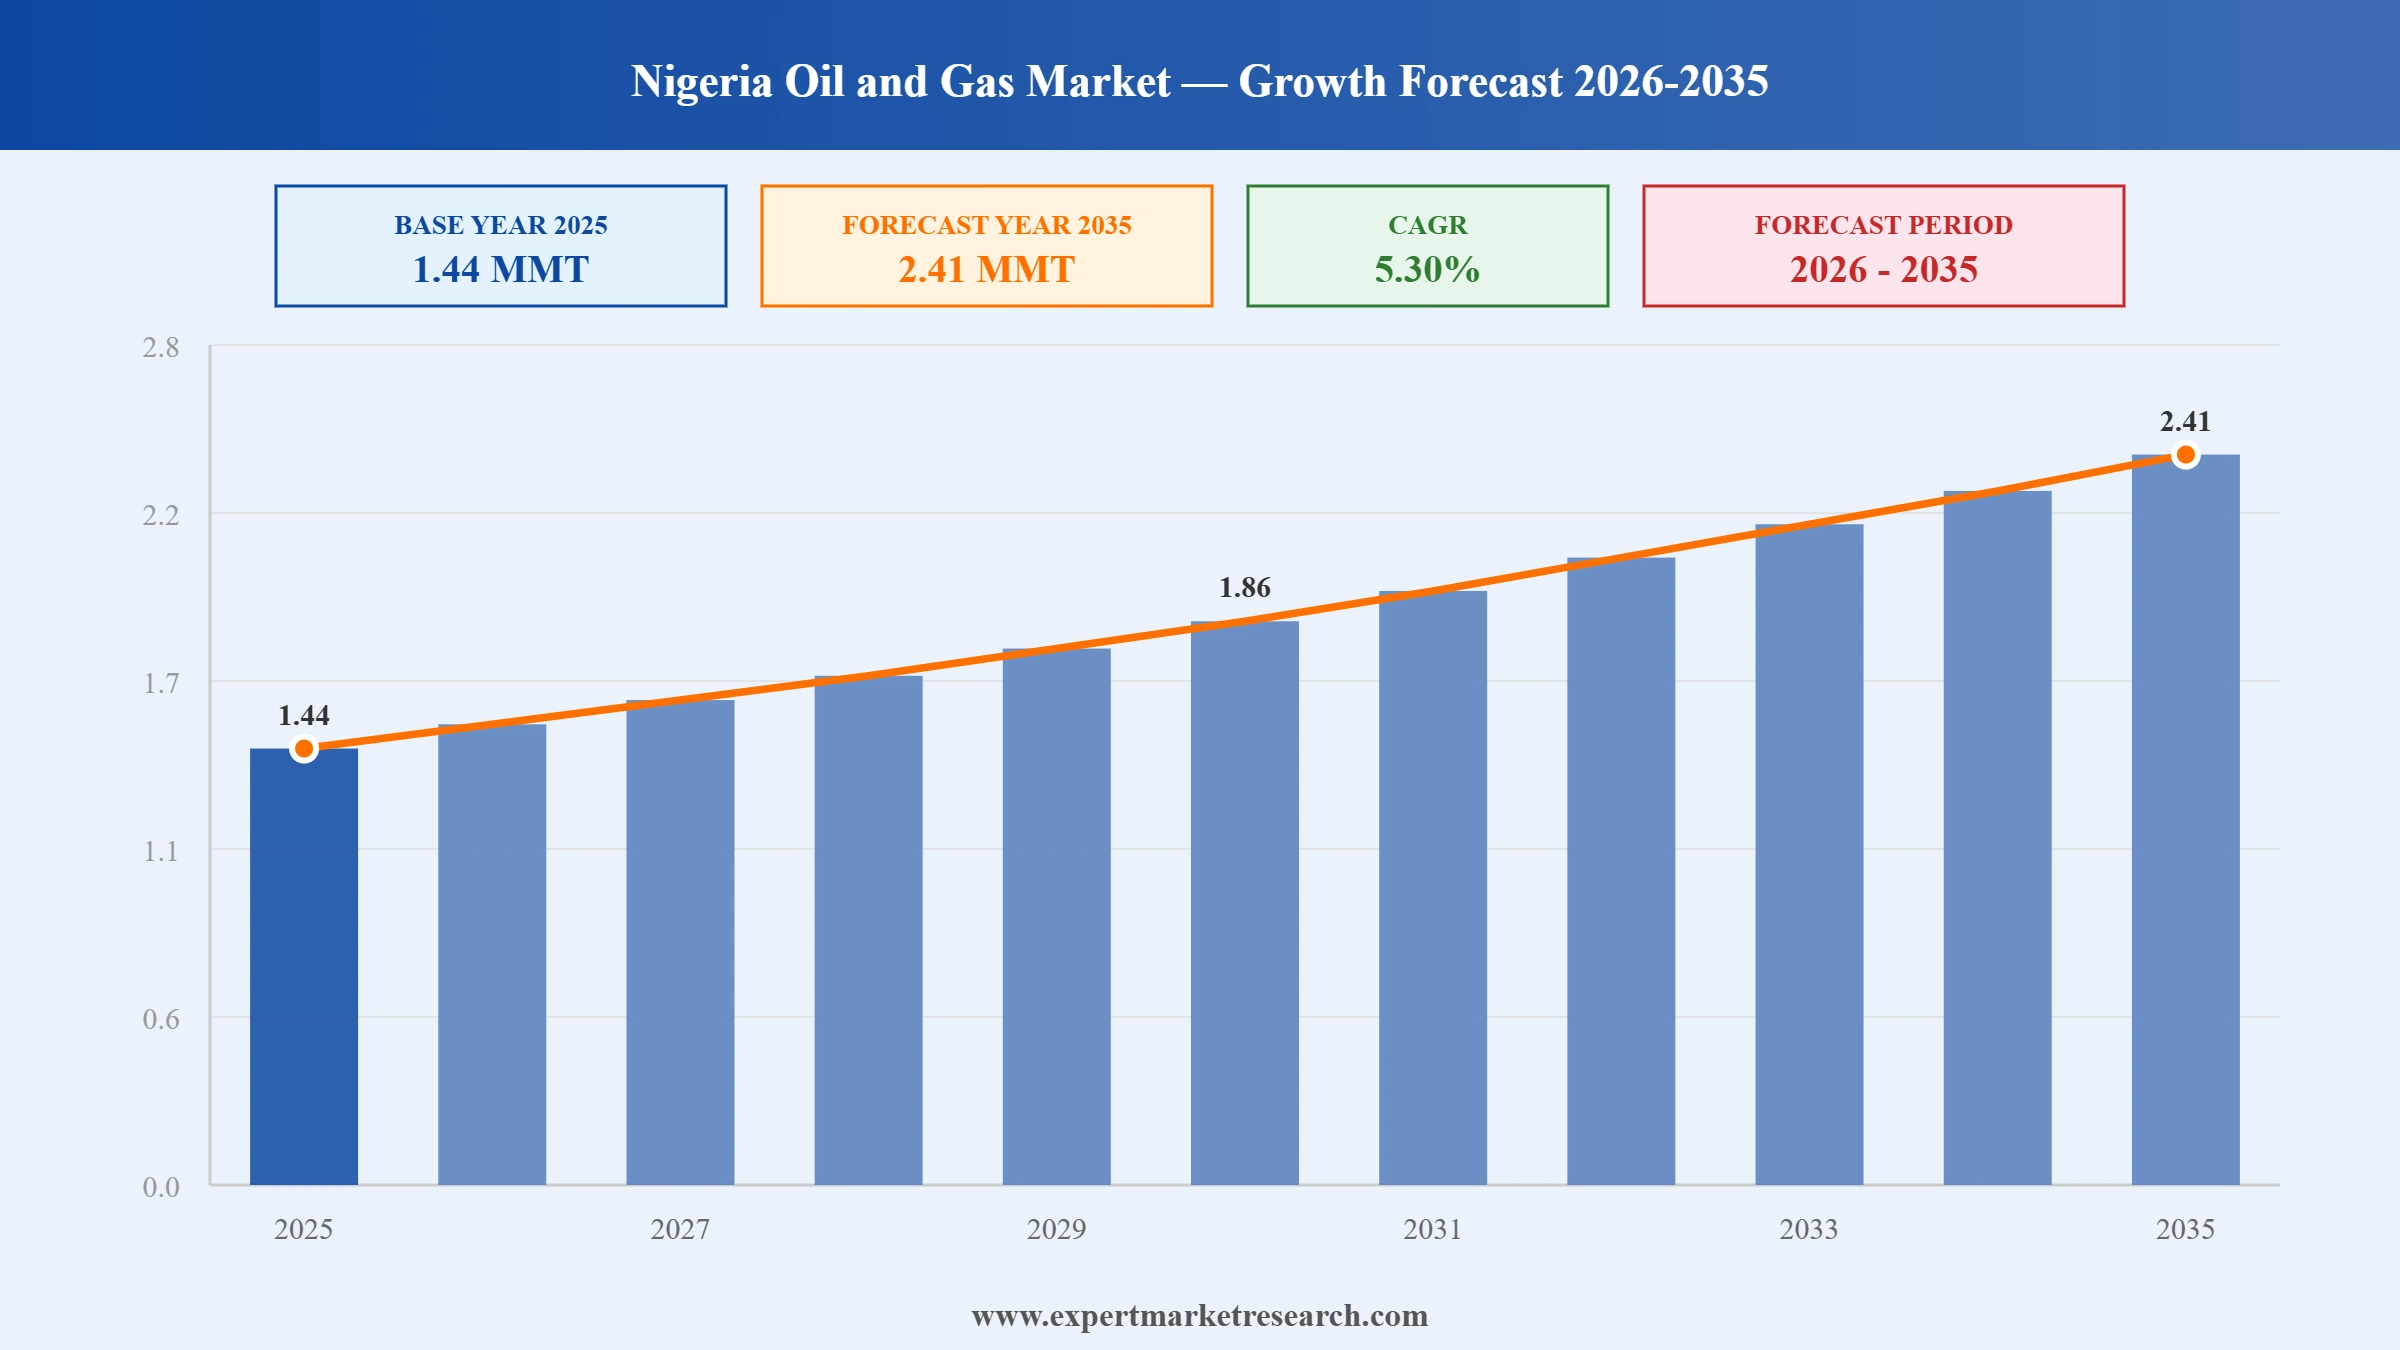
The Nigeria oil and gas market reached a volume of 1.44 MMT at 2025 and is projected to expand at a CAGR of around 5.30% during the forecast period of 2026-2035. Supported by rising indigenous operator participation under the Petroleum Industry Act, the ongoing Decade of Gas initiative expanding domestic gas commercialisation, robust deepwater exploration activity, and a recovery in crude oil production to multi-year highs, the market is expected to reach 2.41 MMT by 2035.
Read more about this report - REQUEST FREE SAMPLE COPY IN PDF
| Nigeria Oil and Gas Market Report Summary | Description | Value |
| Base Year | MMT | 2025 |
| Historical Period | MMT | 2019-2025 |
| Forecast Period | MMT | 2026-2035 |
| Market Size 2025 | MMT | 1.44 |
| Market Size 2035 | MMT | 2.41 |
| CAGR 2019-2025 | Percentage | XX% |
| CAGR 2026-2035 | Percentage | 5.30% |
| CAGR 2026-2035 - Market by Type | Downstream Gas | 6.0% |
The Nigeria oil and gas market is undergoing a significant structural reset, as international oil companies accelerate onshore divestments and indigenous operators scale up across marginal fields and mid-tier assets. Simultaneously, deepwater investment is growing with fresh commitments from ExxonMobil, Shell, TotalEnergies, and Chevron, while the national drive toward gas commercialisation is opening new downstream frontiers. These parallel forces are reshaping the competitive and operational landscape across all three sectors of Nigeria's oil and gas industry.
ExxonMobil committed USD 1.5 billion in investment toward Nigeria's deepwater oil fields between 2025 and 2027 in February 2026, reaffirming its long-term upstream presence in Nigeria despite its earlier onshore divestment to Seplat Energy.
NNPC unveiled an upstream investment drive targeting USD 30 billion in new investments by 2030 in January 2026, aimed at scaling domestic production and expanding gas infrastructure to strengthen Nigeria's position as Africa's leading oil and gas producer.
NNPC signed a production sharing contract with the TotalEnergies-Sapetro consortium in September 2025 for Petroleum Prospecting Licenses 2000 and 2001, marking the first PSC in Nigeria to comprehensively cover both crude oil and natural gas assets.
Seplat Energy completed a USD 1.28 billion acquisition of ExxonMobil's onshore oil and gas assets in December 2024, gaining 11 oil blocks, 48 oil and gas fields, three export terminals, and five gas processing facilities, significantly expanding its Nigerian portfolio.
The Dangote Refinery, Africa's largest single-train refinery at 650,000 barrels per day, is transforming the Nigeria oil and gas market by cutting fuel import dependency and saving up to USD 15 billion annually in foreign exchange through expanded domestic processing.
International oil companies are divesting Nigerian onshore assets to indigenous operators, reshaping market dynamics. Shell agreed to sell onshore operations to Renaissance Africa Energy for USD 2.4 billion, while Eni completed its Nigerian Agip Oil Co. divestment in August 2024.
Nigeria's Petroleum Industry Act has streamlined governance and introduced transparent fiscal terms, boosting upstream investment confidence. The Nigeria oil and gas market recorded over USD 10 billion in new investments by mid-2024, attracting indigenous and international operators to exploration licenses.
Nigeria's Decade of Gas initiative is accelerating gas commercialisation and reducing flaring across the Nigeria oil and gas market. Gas supply reached 7.5 billion standard cubic feet per day by end-2025, supported by new commercial agreements with major industrial users.
Nigeria's crude oil trading reached 1.71 million barrels per day in 2025, a five-year high. This milestone reflects the success of anti-theft operations, enhanced pipeline security, and sector reforms that have fundamentally strengthened Nigeria oil and gas market output levels.
The report of Expert Market Research's titled "Nigeria Oil and Gas Market Report and Forecast 2026-2035" offers a detailed analysis of the market based on the following segments:
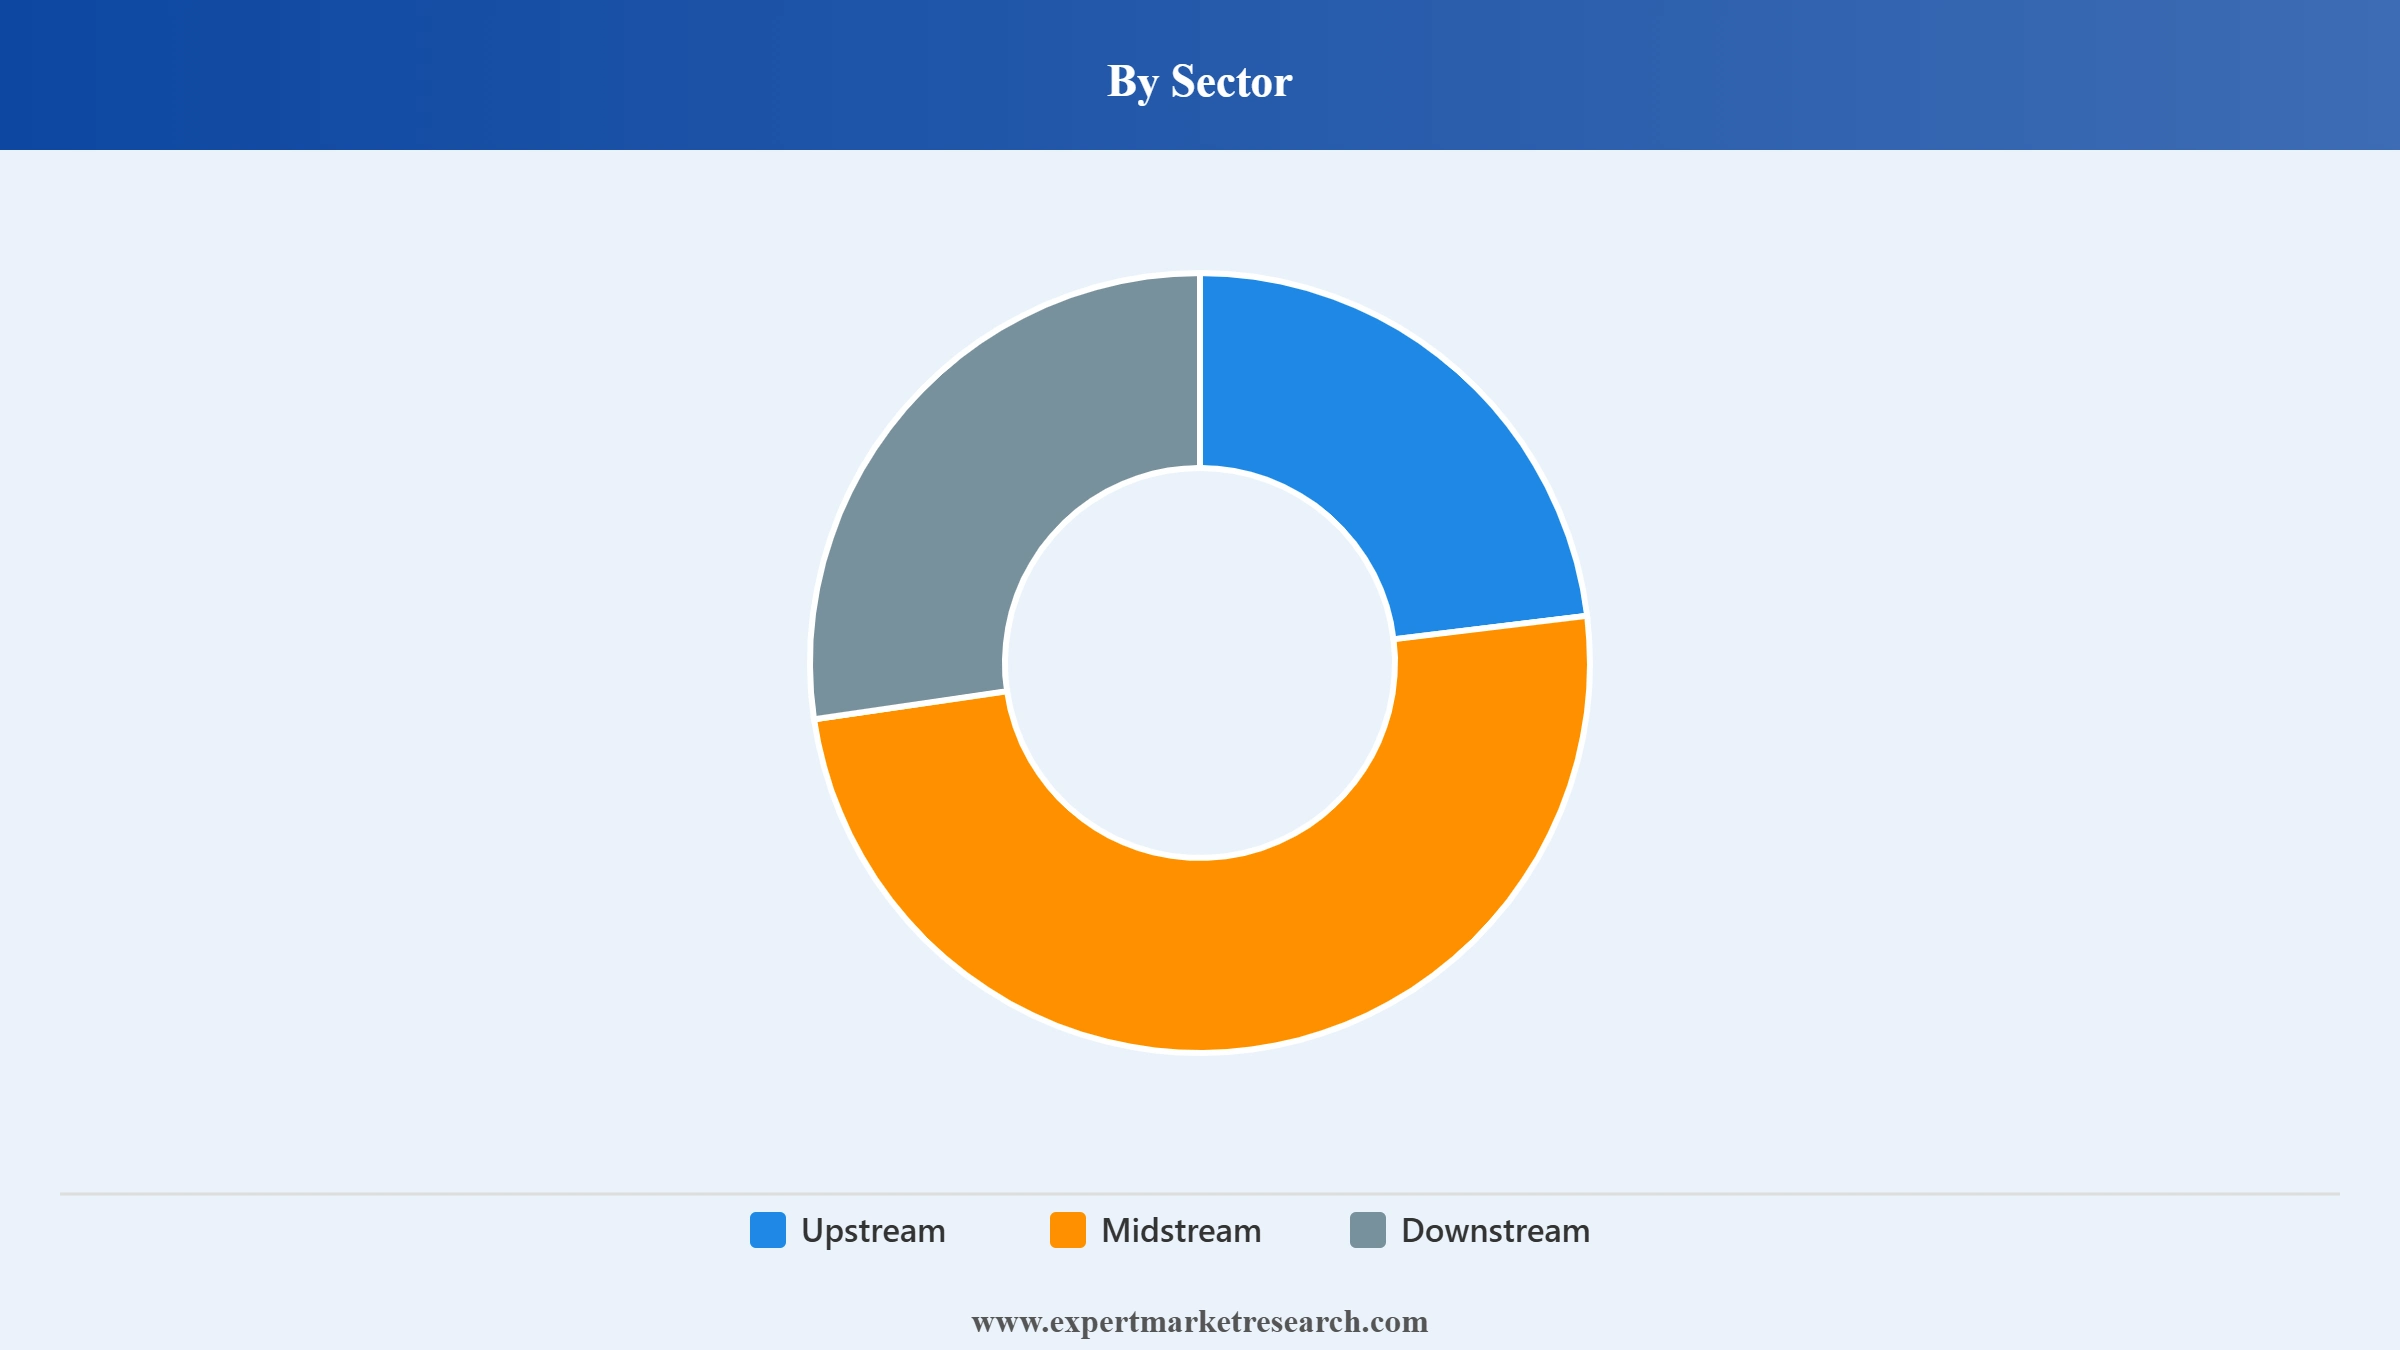
Market Breakup by Sector
Key Insight: The upstream sector commands the dominant share of the Nigeria oil and gas market, accounting for approximately 75% of total sector revenue, anchored by Nigeria's vast crude oil and natural gas reserves concentrated in the Niger Delta and deepwater offshore blocks. Nigeria holds crude oil reserves of 37.5 billion barrels and proven gas reserves exceeding 209 trillion cubic feet, among the largest in Africa. Production recovery to 1.71 million barrels per day in 2025, combined with deepwater investment commitments from ExxonMobil, Shell, TotalEnergies, and Chevron, sustains upstream as the market's primary value engine throughout the forecast period.
Downstream Oil Market Breakup by End Use
Key Insight: Transportation is the dominant end-use for downstream oil, consuming petrol and diesel through a vehicle fleet that has grown substantially with Nigeria's urbanisation and economic development. Nigeria's vehicle penetration remains well below comparable-income-level peers, meaning transportation fuel demand growth has structural runway ahead of it. Industrial consumption is the second-largest end-use, encompassing manufacturing, commercial operations, and the extensive diesel generator capacity that substitutes for grid electricity in a country with chronic power supply deficits. Residential consumption is largely kerosene for cooking in lower-income households.
Downstream Gas Market Breakup by End Use
Key Insight: Power is the dominant downstream gas end-use and simultaneously the sector with the most structural demand potential. Nigeria's electricity generation capacity is chronically inadequate for a country of 220 million people. Gas-to-power is the primary route through which Nigeria intends to address this deficit, and the domestic gas supply expansion under the Decade of Gas initiative is explicitly designed to support power sector gas demand growth. Fertilizer represents a significant downstream gas end-use given Nigeria's agricultural scale: the Dangote Fertilizer plant at Lekki, which uses natural gas as feedstock, is among the largest urea producers in Africa and demonstrates the industrial value-capture potential of Nigeria's gas resources. Industrial gas consumption grows with manufacturing sector development.
Read more about this report - REQUEST FREE SAMPLE COPY IN PDF
By Sector, upstream accounts for the dominant share of the market due to Nigeria's extensive crude oil reserves and high-volume offshore production operations
The upstream sector commands the dominant share of the Nigeria oil and gas market, underpinned by Nigeria's position as Africa's largest crude oil producer and one of the world's top five LNG exporters. Offshore deepwater operations, which account for approximately 68% of upstream revenue, attract the bulk of international capital due to lower security risks and larger reservoir potential compared to onshore acreage. Fresh commitments including ExxonMobil's USD 1.5 billion deepwater pledge in February 2026, Shell's Bonga North field development targeting 110,000 barrels per day, and TotalEnergies' increased stake in OPL 257 signal sustained sector leadership.
The midstream sector is gaining strategic importance within the Nigeria oil and gas market as Nigeria accelerates investment in pipelines, gas processing plants, and liquefaction infrastructure. The Ajaokuta-Kaduna-Kano gas pipeline, the ANOH Gas Processing Plant capacity expansion, and the government's Midstream and Downstream Gas Infrastructure Fund are collectively channelling investment into midstream connectivity, linking gas producers to power plants, industrial parks, and export terminals. The downstream sector is being fundamentally restructured by the Dangote Refinery's operational ramp-up, modular refinery additions, and the transition from an import-dependent to a domestically supplied fuel market.
Read more about this report - REQUEST FREE SAMPLE COPY IN PDF
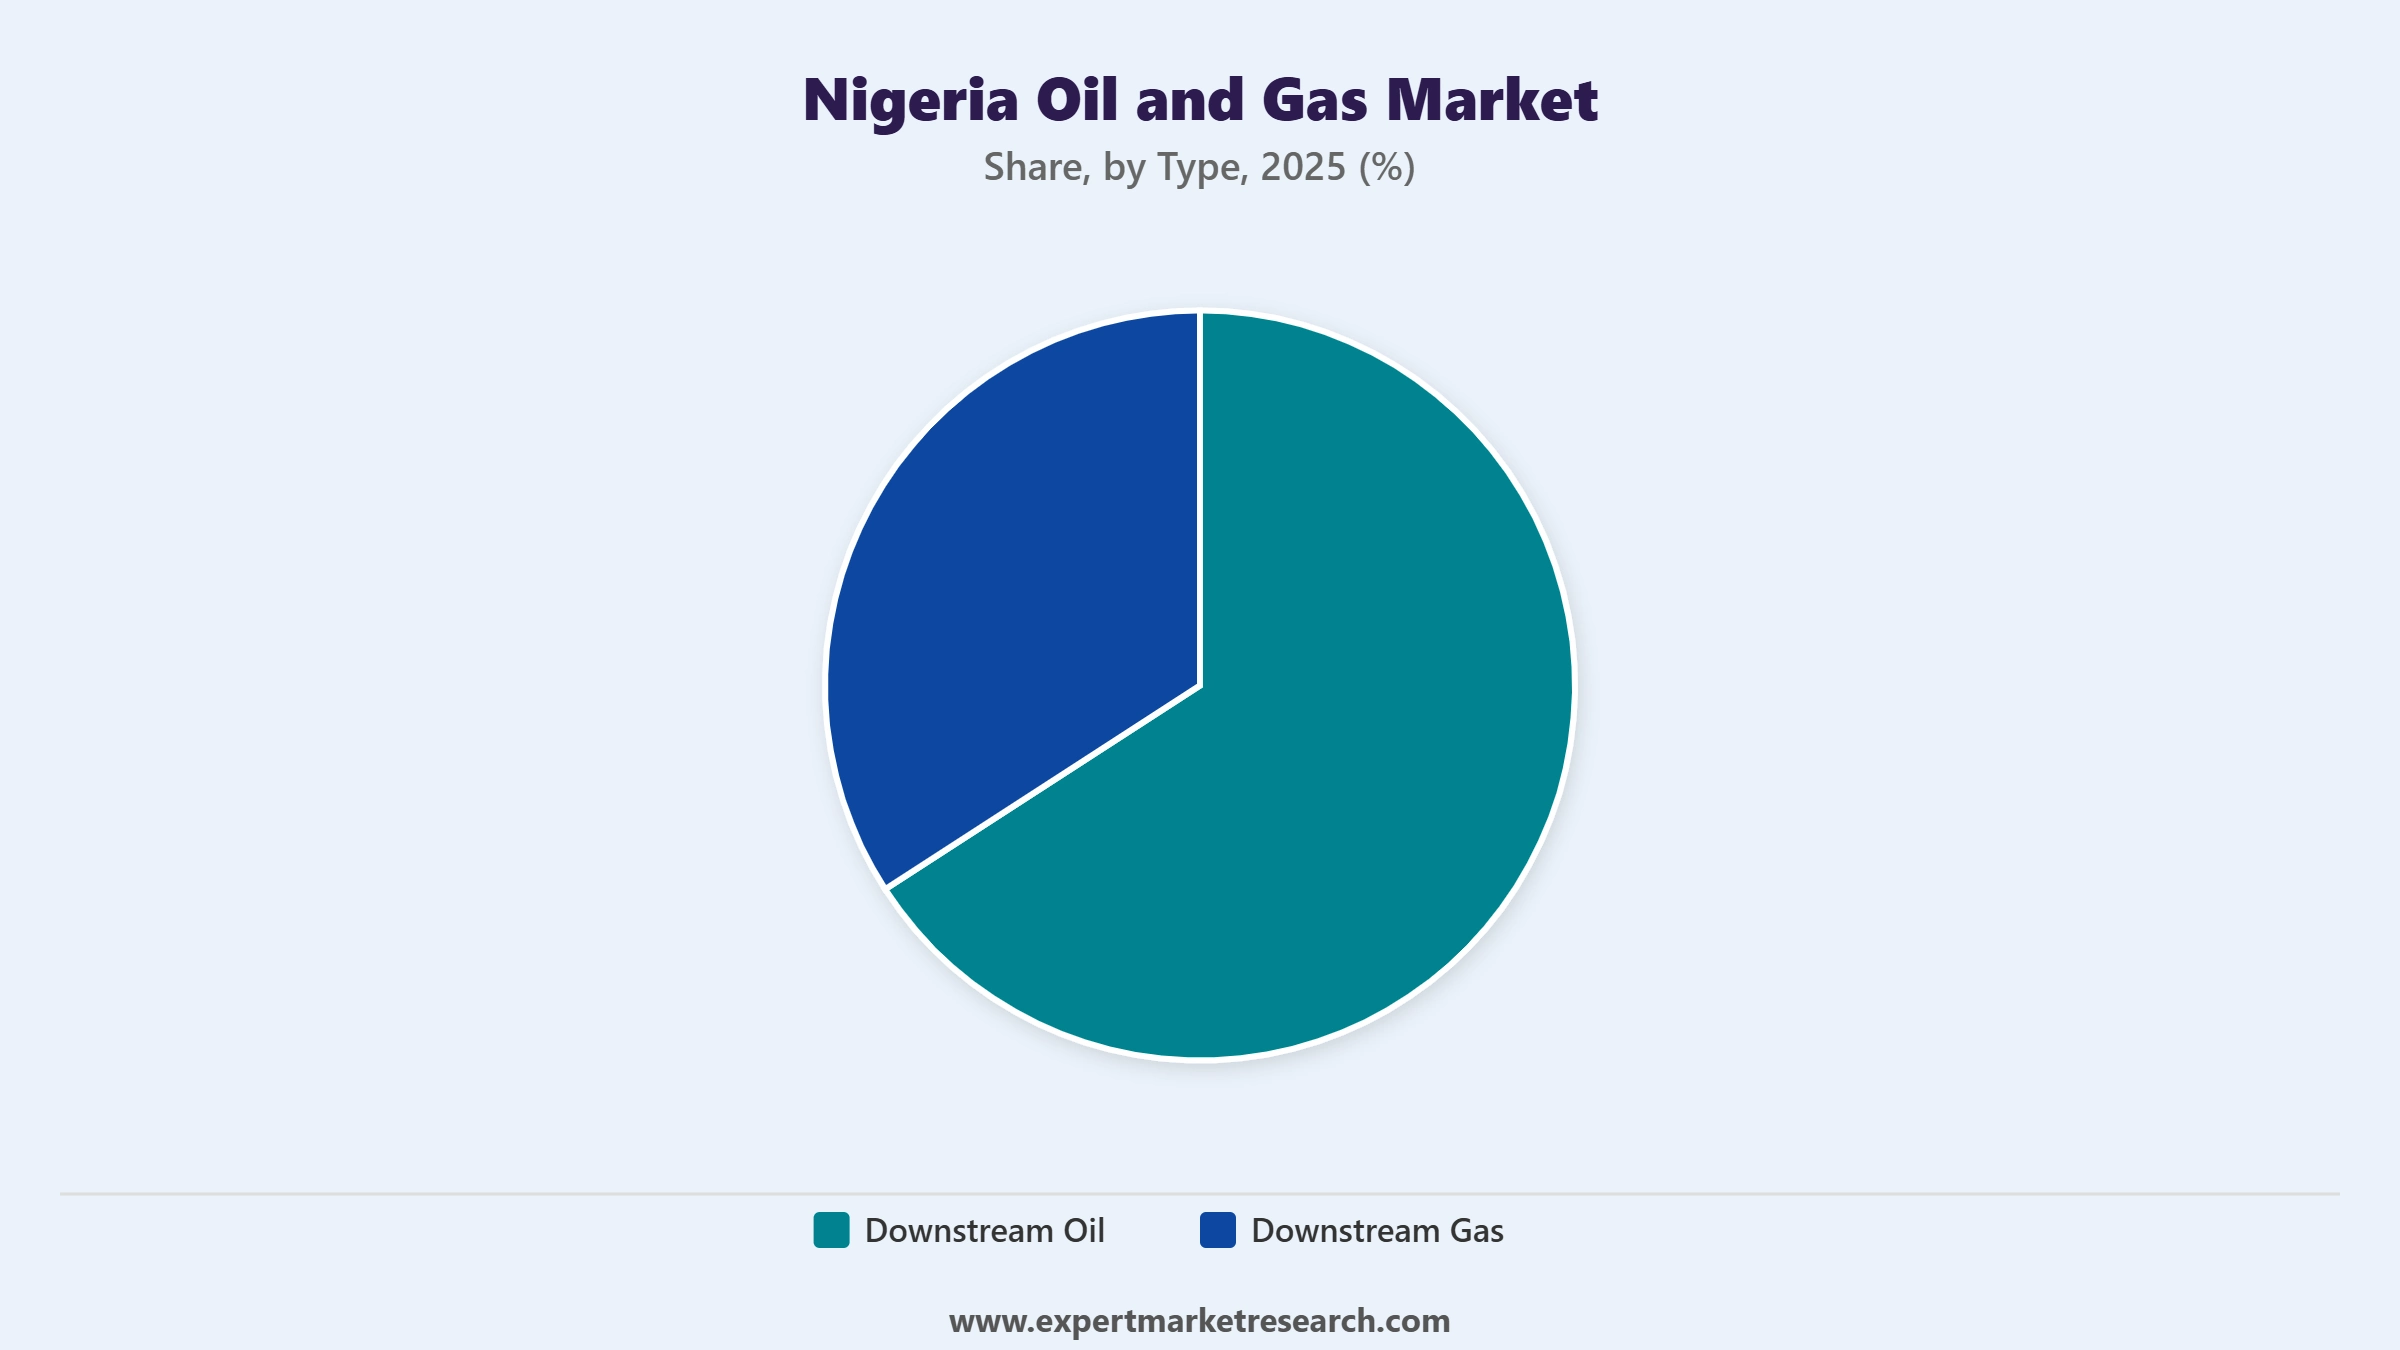
By Type, downstream oil accounts for the dominant share of the market due to widespread transportation and industrial fuel demand across Nigeria's large and growing economy
Downstream oil holds the larger share of the Nigeria oil and gas market by type, driven by transportation fuel consumption across Nigeria's vast commercial vehicle fleet, diesel-dependent power generation by households and businesses, and industrial fuel demand from manufacturing, construction, and agricultural sectors. Transportation represents the single largest end-use category within downstream oil, reflecting Nigeria's high vehicle population and extensive road freight network. The Dangote Refinery's crude-for-Naira initiative, supported by NNPC's commitment of over 112 million barrels of crude between December 2023 and September 2025, is transforming domestic supply reliability.
Downstream gas is the fastest-growing type segment in the Nigeria oil and gas market, expanding at a 6.0% CAGR, fuelled by the government's Decade of Gas programme that prioritises gas utilisation over flaring and positions Nigeria's 209 trillion cubic feet of proven reserves as a domestic and export resource. The power sector is the largest end user of downstream gas, with gas-fired plants supplying approximately 80% of Nigeria's on-grid electricity generation. Fertilizer production and industrial applications are emerging high-growth end uses, with the Indorama Eleme and Dangote fertilizer plants representing anchor demand centres. Five mini-LNG plants commissioned in early 2025 further broadened decentralised gas supply to remote industrial zones.
Read more about this report - REQUEST FREE SAMPLE COPY IN PDF
The Nigeria oil and gas market features a moderately concentrated competitive structure in its upstream segment, where the Nigerian National Petroleum Corporation, operating through joint ventures with Shell, TotalEnergies, ExxonMobil, Chevron, and Eni, has historically dominated production across both onshore and offshore assets. The sector is undergoing a structural shift as international oil companies divest onshore portfolios to indigenous players, concentrating global IOC capital in deepwater assets while creating new leadership opportunities for domestic operators. Indigenous companies including Seplat Energy, Oando, and Chappal Energies are scaling up through asset acquisitions, positioning themselves as the next generation of Nigerian upstream operators.
Competitive priorities in the market include deepwater reserve development, gas infrastructure investment, cost efficiency under the Petroleum Industry Act's incentive structures, and compliance with domestic gas supply obligations. The government's Cost Efficiency Incentive, launched in June 2025 and offering tax credits through 2035 for operators achieving sub-benchmark lifting costs, is reshaping how companies approach operational efficiency. Digital oilfield adoption, including edge analytics for uptime optimisation and methane detection platforms, is becoming a differentiator across both international and indigenous operators.
Nigerian National Petroleum Corporation, established in 1977 and headquartered in Abuja, Nigeria, is the country's state oil company and the single most influential participant in the Nigeria oil and gas market, holding equity stakes in joint ventures with Shell, TotalEnergies, ExxonMobil, Chevron, and Eni. Following its transformation into a commercial entity in 2022, NNPCL has signed over 20 new partnerships and is pursuing a USD 30 billion upstream investment drive by 2030, while retaining a 7.25% equity stake in the Dangote Refinery.
Exxon Mobil Corporation, founded in 1870 and headquartered in Spring, Texas, United States, has operated in Nigeria for over seven decades through its subsidiary ExxonMobil Nigeria, with interests spanning offshore deepwater and shallow-water assets. While completing the divestment of its onshore assets to Seplat Energy in December 2024 for USD 1.28 billion, ExxonMobil simultaneously committed USD 1.5 billion to Nigeria's deepwater development between 2025 and 2027, including the Owowo and Bosi offshore developments expected to begin production by 2029 and 2030.
TotalEnergies SE, founded in 1924 and headquartered in Courbevoie, France, is one of the largest IOC operators in Nigeria, with flagship deepwater assets including the Egina field producing over 200,000 barrels per day. In 2024, TotalEnergies advanced its Ubeta gas field toward first gas with USD 550 million allocated, while increasing its interest in OPL 257 to 90% in January 2026 and partnering with NNPC on the first combined oil-and-gas PSC. The company plans to develop the offshore Preowei Phase I project at 65,000 barrels per day with startup anticipated in 2026.
Shell Plc, founded in 1907 and headquartered in London, United Kingdom, has a decades-long presence in Nigeria and is transitioning from onshore to deepwater-focused operations. After agreeing to sell its onshore SPDC joint venture operations to Renaissance Africa Energy for USD 2.4 billion, Shell received final investment decision approval in December 2024 for the Bonga North deepwater project, targeting 110,000 barrels per day production from reserves exceeding 300 million barrels of oil equivalent, with startup targeted for 2027.
Other key players in the market are Chevron Corporation, Lekoil Nigeria Limited, Sterling Oil Exploration and Energy Production Co. Ltd., Pinnacle Oil and Gas Company Limited, CNOOC International Ltd., Eni S.p.A., and Others.
*Please note that this is only a partial list; the complete list of key players is available in the full report. Additionally, the list of key players can be customized to better suit your needs.*
Unlock strategic clarity in the Nigeria oil and gas market 2026 with our comprehensive research report. From IOC divestment trends and indigenous operator growth to deepwater investment commitments, Dangote Refinery's downstream impact, and the Decade of Gas transformation, this report delivers the intelligence you need to act with confidence. Whether you are entering Nigeria's energy sector, evaluating upstream assets, planning downstream infrastructure, or tracking competitive shifts, download your free sample today and discover the forces shaping Africa's most dynamic oil and gas market.
United States Oil and Gas Downstream Market
North America Oil and Gas Lubricants Market
Mexico Oil and Gas Decommissioning Market
Australia Oil and Gas Midstream Market
Argentina Oil and Gas Upstream Market
Upto 15% Off
USD
$2499 $2249
$3999 $3599
$4999 $4249
$5999 $5099


*While we strive to always give you current and accurate information, the numbers depicted on the website are indicative and may differ from the actual numbers in the main report. At Expert Market Research, we aim to bring you the latest insights and trends in the market. Using our analyses and forecasts, stakeholders can understand the market dynamics, navigate challenges, and capitalize on opportunities to make data-driven strategic decisions.*
At 2025, the market reached an approximate volume of 1.44 MMT.
The market is projected to grow at a CAGR of 5.30% between 2026 and 2035.
The market reaches 2.41 MMT by 2035, supported by indigenous operator-driven upstream production recovery, the Dangote refinery's downstream import substitution impact, the Decade of Gas initiative's domestic gas supply expansion and LNG export growth, and the fiscal clarity provided by the Petroleum Industry Act 2021 that is converting into tangible investment commitments across all three sectors.
Stakeholders are investing in modular facilities, partnering with refiners, expanding gas distribution, deploying digital monitoring, securing offtake contracts, and localizing services to improving margins, reliability, and capital efficiency nationwide sustainably.
Companies face pipeline insecurity, financing gaps, regulatory transition risks, foreign exchange volatility, aging infrastructure, and rising compliance costs while maintaining production reliability and meeting domestic supply obligations amid market reforms.
The key players in the market include Nigerian National Petroleum Corporation, Exxon Mobil Corporation, Total Energies SE, Shell Plc, Chevron Corporation, Lekoil Nigeria Limited, Sterling Oil Exploration & Energy Production Co. Ltd., Pinnacle Oil and Gas Company Limited, CNOOC International Ltd., Eni S.p.A., and Others.
Explore our key highlights of the report and gain a concise overview of key findings, trends, and actionable insights that will empower your strategic decisions.
| REPORT FEATURES | DETAILS |
| Base Year | 2025 |
| Historical Period | 2019-2025 |
| Forecast Period | 2026-2035 |
| Scope of the Report |
Historical and Forecast Trends, Industry Drivers and Constraints, Historical and Forecast Market Analysis by Segment:
|
| Breakup by Sector |
|
| Breakup by Type |
|
| Market Dynamics |
|
| Competitive Landscape |
|
| Companies Covered |
|
Datasheet
One User
USD 2,499
USD 2,249
tax inclusive*
Single User License
One User
USD 3,999
USD 3,599
tax inclusive*
Five User License
Five User
USD 4,999
USD 4,249
tax inclusive*
Corporate License
Unlimited Users
USD 5,999
USD 5,099
tax inclusive*
*Please note that the prices mentioned below are starting prices for each bundle type. Kindly contact our team for further details.*
Flash Bundle
Small Business Bundle
Growth Bundle
Enterprise Bundle
*Please note that the prices mentioned below are starting prices for each bundle type. Kindly contact our team for further details.*
Flash Bundle
Number of Reports: 3
20%
tax inclusive*
Small Business Bundle
Number of Reports: 5
25%
tax inclusive*
Growth Bundle
Number of Reports: 8
30%
tax inclusive*
Enterprise Bundle
Number of Reports: 10
35%
tax inclusive*
How To Order

Select License Type
Choose the right license for your needs and access rights.

Click on ‘Buy Now’
Add the report to your cart with one click and proceed to register.

Select Mode of Payment
Choose a payment option for a secure checkout. You will be redirected accordingly.
Strategic Solutions for Informed Decision-Making
Gain insights to stay ahead and seize opportunities.

Get insights & trends for a competitive edge.

Track prices with detailed trend reports.

Analyse trade data for supply chain insights.

Leverage cost reports for smart savings

Enhance supply chain with partnerships.

Connect For More Information
Our expert team of analysts will offer full support and resolve any queries regarding the report, before and after the purchase.
Our expert team of analysts will offer full support and resolve any queries regarding the report, before and after the purchase.
We employ meticulous research methods, blending advanced analytics and expert insights to deliver accurate, actionable industry intelligence, staying ahead of competitors.
Our skilled analysts offer unparalleled competitive advantage with detailed insights on current and emerging markets, ensuring your strategic edge.
We offer an in-depth yet simplified presentation of industry insights and analysis to meet your specific requirements effectively.


