

Consumer Insights
Uncover trends and behaviors shaping consumer choices today
Procurement Insights
Optimize your sourcing strategy with key market data
Industry Stats
Stay ahead with the latest trends and market analysis.
The United Kingdom oil and gas market was valued at USD 335.95 Billion in 2025. The industry is expected to grow at a CAGR of 1.65% during the forecast period of 2026-2035 to attain a valuation of USD 395.68 Billion by 2035.
Compound Annual Growth Rate
1.65%
Value in USD Billion
2026-2035
Read more about this report - Request a Free Sample
| United Kingdom Oil and Gas Market Report Summary | Description | Value |
| Base Year | USD Billion | 2025 |
| Historical Period | USD Billion | 2019-2025 |
| Forecast Period | USD Billion | 2026-2035 |
| Market Size 2025 | USD Billion | 335.95 |
| Market Size 2035 | USD Billion | 395.68 |
| CAGR 2019-2025 | Percentage | XX% |
| CAGR 2026-2035 | Percentage | 1.65% |
| CAGR 2026-2035 - Market by Sector | Upstream | 4.8% |
The United Kingdom oil and gas market benefits the country by increasing GDP and job creation, improving energy security through decreased reliance on imports, and fostering technological advancements in offshore drilling and renewable energy. These elements contribute to overall economic stability and progress in the wider energy sector.
The United Kingdom oil and gas market dynamics and trends show that the downstream oil sector is a significant contributor to the nation's GDP. The six largest refineries Stanlow, Prax Lindsey, Pembroke, Fawley, Grangemouth, and Humber have a combined annual capacity of 58 million tonnes (MT) and exported over 21 MT in 2022.
Natural gas is an increasingly popular option for electricity generation in Europe due to increased availability and the advantage of releasing lower amounts of CO2 compared to coal. Natural gas is also widely used for heating and cooking and in the production of key chemicals for fertilisers and plastics, which contributes to the United Kingdom oil and gas industry growth.
Figure: Energy Consumption by Fuel Type (in %) in the UK, 2022
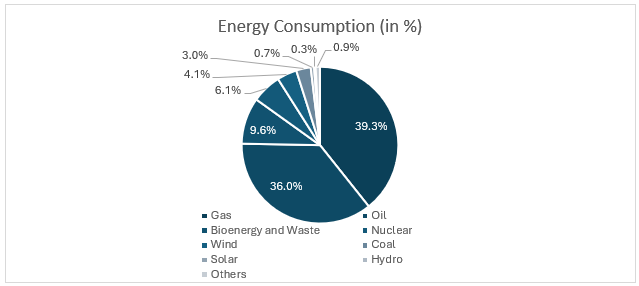
Read more about this report - Request a Free Sample
According to the BP Statistical Review of World Energy, in 2021, the United Kingdom showed strong energy consumption trends across different fuel types. Oil consumption increased to 2.50 exajoules from 2.35 exajoules in 2020. Natural gas usage also saw a modest rise, moving from 2.63 exajoules in 2020 to 2.77 exajoules in 2021. Overall, the UK's total primary energy consumption grew from 7.06 exajoules in 2020 to 7.18 exajoules in 2021, indicating a steady rise in energy demand and use. This rising energy consumption reflects the need for a stable and reliable energy supply, bolstering the demand of United Kingdom oil and gas market.
According to the BP Statistical Review of World Energy, in 2019, the United Kingdom's oil production was 1,118 thousand barrels per day, showing stability compared to 1,092 thousand barrels per day in 2018. This marked a continued recovery from a decade-low of 820 thousand barrels per day in 2014. Production in 2014 was at 854 thousand barrels per day, and it increased to 964 thousand barrels per day by 2015. This increasing oil production has resulted in bolstering the growth of United Kingdom oil and gas industry revenue.
The United Kingdom has demonstrated a significant upward trajectory in renewable energy generation over the past decade. In 2011, the UK generated 29.5 terawatt-hours (TWh) of renewable energy. This figure has seen a substantial increase, reaching 127.8 TWh by 2020. In 2012, generation rose to 35.9 TWh, marking an increase of 16 TWh from 2011. By 2013, the generation further escalated to 48.5 TWh. The years 2014 and 2015 witnessed substantial growth, with renewable energy generation reaching 58.6 TWh and 77.1 TWh, respectively. By 2016, renewable energy generation had increased to 77.6 TWh. The momentum continued into 2017 and 2018, with renewable energy generation reaching 93.0 TWh and 104.6 TWh, respectively. This increase in renewable energy generation aligns with the UK's carbon reduction goals, necessitating advancements in CCS technology, further contributing to the United Kingdom oil and gas market revenue.
Read more about this report - Request a Free Sample
“United Kingdom Oil and Gas Market Report and Forecast 2026-2035” offers a detailed analysis of the market based on the following segments:
Market Breakup by Sector
| CAGR 2026-2035 - Market by | Sector |
| Upstream | 4.8% |
| Midstream | XX% |
| Downstream | XX% |
The transport sector is the leading segment in the downstream oil market by end-use, with a substantial portion of the UK's energy for transportation derived from petroleum products. Petrol fuels cars and motorcycles, while diesel powers buses, trucks, and marine vessels. In 2022, road transport saw a 3% increase, and energy consumption for air travel doubled, indicating strong oil demand. Following transport, agriculture and public and commercial services contributed significantly to the growth of the United Kingdom oil and gas industry.
The companies in the United Kingdom oil and gas market are deploying innovative technologies in the production and exploration activities and attracting highly skilled talent to ensure smooth operations.
United States Conferences, Concert, and Event Market
MENA Maintenance, Repair, and Operations (MRO) Market
Saudi Arabia Bottled Water Market
Upto 15% Off
USD
$2499 $2249
$3999 $3599
$4999 $4249
$5999 $5099


*While we strive to always give you current and accurate information, the numbers depicted on the website are indicative and may differ from the actual numbers in the main report. At Expert Market Research, we aim to bring you the latest insights and trends in the market. Using our analyses and forecasts, stakeholders can understand the market dynamics, navigate challenges, and capitalize on opportunities to make data-driven strategic decisions.*
The United Kingdom downstream oil and gas market attained a value of USD 335.95 Billion in 2025.
The major sectors considered in the market report include upstream, midstream, and downstream.
The factors driving the market include rising electricity consumption, increasing energy requirements from the household sector, and the presence of significant number of offshore oil and gas sites.
Based on the end use, the market is divided into transport, agriculture, public and commercial services, industrial energy use and household energy use.
The competitive landscape consists of BP Plc., Shell plc, TotalEnergies SE, Chevron Corporation, Energean PLC, Exxon Mobil Corporation, ConocoPhillips Company, Centrica plc, Harbour Energy, EnQuest Plc, and Dana Petroleum Limited, among others.
The market is assessed to grow at a CAGR of 1.65% between 2026 and 2035.
The market is estimated to witness a healthy growth in the forecast period of 2026-2035 to reach about USD 395.68 Billion by 2035.
Explore our key highlights of the report and gain a concise overview of key findings, trends, and actionable insights that will empower your strategic decisions.
| REPORT FEATURES | DETAILS |
| Base Year | 2025 |
| Historical Period | 2019-2025 |
| Forecast Period | 2026-2035 |
| Scope of the Report |
Historical and Forecast Trends, Industry Drivers and Constraints, Historical and Forecast Market Analysis by Segment:
|
| Breakup by Sector |
|
| Market Dynamics |
|
| Competitive Landscape |
|
| Companies Covered |
|
Datasheet
One User
USD 2,499
USD 2,249
tax inclusive*
Single User License
One User
USD 3,999
USD 3,599
tax inclusive*
Five User License
Five User
USD 4,999
USD 4,249
tax inclusive*
Corporate License
Unlimited Users
USD 5,999
USD 5,099
tax inclusive*
*Please note that the prices mentioned below are starting prices for each bundle type. Kindly contact our team for further details.*
Flash Bundle
Small Business Bundle
Growth Bundle
Enterprise Bundle
*Please note that the prices mentioned below are starting prices for each bundle type. Kindly contact our team for further details.*
Flash Bundle
Number of Reports: 3
20%
tax inclusive*
Small Business Bundle
Number of Reports: 5
25%
tax inclusive*
Growth Bundle
Number of Reports: 8
30%
tax inclusive*
Enterprise Bundle
Number of Reports: 10
35%
tax inclusive*
How To Order

Select License Type
Choose the right license for your needs and access rights.

Click on ‘Buy Now’
Add the report to your cart with one click and proceed to register.

Select Mode of Payment
Choose a payment option for a secure checkout. You will be redirected accordingly.
Strategic Solutions for Informed Decision-Making
Gain insights to stay ahead and seize opportunities.

Get insights & trends for a competitive edge.

Track prices with detailed trend reports.

Analyse trade data for supply chain insights.

Leverage cost reports for smart savings

Enhance supply chain with partnerships.

Connect For More Information
Our expert team of analysts will offer full support and resolve any queries regarding the report, before and after the purchase.
Our expert team of analysts will offer full support and resolve any queries regarding the report, before and after the purchase.
We employ meticulous research methods, blending advanced analytics and expert insights to deliver accurate, actionable industry intelligence, staying ahead of competitors.
Our skilled analysts offer unparalleled competitive advantage with detailed insights on current and emerging markets, ensuring your strategic edge.
We offer an in-depth yet simplified presentation of industry insights and analysis to meet your specific requirements effectively.


