

Consumer Insights
Uncover trends and behaviors shaping consumer choices today
Procurement Insights
Optimize your sourcing strategy with key market data
Industry Stats
Stay ahead with the latest trends and market analysis.
The global smart building market reached a value of about USD 95.37 Billion in 2025. The market is further expected to grow at a CAGR of 10.40% in the forecast period of 2026-2035 to reach a value of approximately USD 256.51 Billion by 2035.
Compound Annual Growth Rate
10.4%
Value in USD Billion
2026-2035
Read more about this report - REQUEST FREE SAMPLE COPY IN PDF
| Global Smart Building Market Report Summary | Description | Value |
| Base Year | USD Billion | 2025 |
| Historical Period | USD Billion | 2019-2025 |
| Forecast Period | USD Billion | 2026-2035 |
| Market Size 2025 | USD Billion | 95.37 |
| Market Size 2035 | USD Billion | 256.51 |
| CAGR 2019-2025 | Percentage | XX% |
| CAGR 2026-2035 | Percentage | 10.40% |
| CAGR 2026-2035 - Market by Region | Asia Pacific | 11.2% |
| CAGR 2026-2035 - Market by Country | China | 11.8% |
| CAGR 2026-2035 - Market by Country | Brazil | 11.4% |
| CAGR 2026-2035 - Market by Component | Energy Management Solution | 12.7% |
| CAGR 2026-2035 - Market by Building Type | Commercial | 11.6% |
| Market Share by Country 2025 | Australia | 2.2% |
Smart buildings refer to complex residential, commercial, or industrial infrastructures integrated with smart technologies, such as IoT, and AI, aimed at lowering energy consumption costs, supporting a robust electric grid, and alleviating environmental impact. Smart buildings provide occupants with illumination, thermal comfort, ventilation, air conditioning, and other benefits.
The key drivers influencing smart building market development are the rapid technological advancements, including cloud, AI, and edge computing, which are creating growth opportunities. The increasing focus of governments on sustainable development and the growing adoption of IoT devices in building energy management systems are also driving the market. Additionally, the rise in smart city projects and the growing need for energy-efficient structures are further propelling the market growth.


Read more about this report - REQUEST FREE SAMPLE COPY IN PDF
Increasing demand for smart infrastructure owing to governmental aid and technological advancements are boosting the smart building market growth
EllisDon, RBC, and Mattamy Homes have launched the Responsible Buildings Pact, a collaborative initiative aimed at increasing the use of lower carbon building materials in the construction industry.
Letianpai, a leading smart home company, has launched the LeTianPai Presence Sensor Box, the world's first Matter millimetre wave radar technology human presence sensor. It turns on the lights upon entering a room and automatically switches them off when people exit the room.
The Ayodhya Development Authority (ADA) and SBUT (Smart City Urban Transformation) have won the top smart infrastructure award at the 5th FICCI Smart Urban Innovation for their efforts in developing Ayodhya's infrastructure.
The U.S. Department of Energy (DOE) has announced USD 250 million in funding for energy efficiency upgrades and retrofits of commercial buildings through the Energy Efficiency Revolving Loan Fund Capitalisation Grant Program.
The growing need for energy-efficient structures and rising public and private investment in smart cities are driving the adoption of smart building solutions and thus, fuelling smart building market expansion.
The growing adoption of IoT and automation technologies is enabling the integration of various building systems, improving efficiency, and reducing costs. For example, IoT-enabled lighting systems can adjust brightness and colour based on natural light availability, reducing energy consumption.
The concept of smart cities has been gaining traction, and favourable initiatives are being introduced by governments in developing countries, creating a favourable environment for the smart building market.
The increasing focus on sustainability and environmental concerns is driving the adoption of smart building solutions that can reduce energy consumption and waste. Smart buildings incorporate green technologies like solar panels, advanced insulation, and energy-efficient lighting and HVAC systems which meet LEED, Fitwel, and WELL Building Standards.
Rapid urbanisation is compelling governments across the globe to invest in smart city projects and intelligent infrastructures to enhance the relationship between the government and its citizens. With rising investments in smart city projects, the smart building market outlook is expected to turn out favourable during the forecast period.
Moreover, rapid technological advancements focused on providing safety to building occupants and environmental sustainability are expected to further boost the market growth. While rising cybercrimes may hamper the market growth during the forecast period, many building owners are investing in robust cybersecurity measures, such as encryption, network monitoring, and regular security assessments to protect sensitive data and ensure data integrity and privacy.
Read more about this report - REQUEST FREE SAMPLE COPY IN PDF
The EMR’s report titled Smart Building Market Report and Forecast 2026-2035 offers a detailed analysis of the market based on the following segments:
Market Breakup by Component
Market Breakup by Building Type
Market Breakup by Region
| CAGR 2026-2035 - Market by | Country |
| China | 11.8% |
| Brazil | 11.4% |
| USA | 10.9% |
| UK | 10.4% |
| Australia | 10.2% |
| Canada | XX% |
| Germany | XX% |
| France | 9.8% |
| Italy | XX% |
| Japan | XX% |
| India | XX% |
Rising demand for energy management solutions to foster the smart building industry growth
Based on type, the energy management segment is expected to account for a significant share in the market owing to various green building initiatives and government regulations aimed at reducing energy consumption. The systems are known to help in reducing and monitoring the amount of power consumed by the building. By adopting such solutions, building owners and stakeholders can lower their operational expenses. These advantages are expected to increase the popularity of energy management segment in smart building market report.
The building infrastructure management solution is expected to grow steadily due to the rising challenges in optimising high commercial building operational costs. This segment is further categorised into parking management systems, smart water management systems, and elevators & escalators systems. The demand for these solutions is driven by the need for efficient management of building infrastructure, which can help reduce operational costs and enhance occupant comfort.
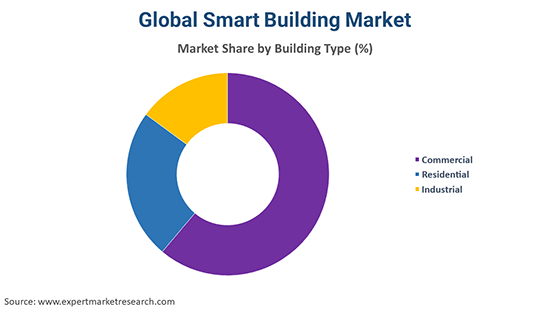
Commercial segment holds a significant market share due to the need of improving energy costs
As per smart building market analysis, the commercial segment holds the largest share in the market. The demand for smart building solutions in the commercial sector is driven by the need to improve energy efficiency, enhance occupant comfort and safety, and reduce operating costs.
Commercial buildings are adopting advanced IoT sensors to collect data from various building systems and subsystems. This data can be used by building operators to automate and optimise building operations and maintenance, leading to improved efficiency and cost savings. The rapid digitalisation across industry verticals, increasing adoption of smart connected devices, and rising technological advancements have further fueled the growth of the smart building market in the commercial sector.
The residential segment is also expected to grow at a significant CAGR during the forecast period due to a surge in demand for smart home technologies, such as lighting, HVAC, and security systems. The growing awareness of the benefits of smart home technologies, such as remote control, energy savings, and enhanced security, is propelling the adoption of smart building solutions in the residential sector.
Market players are focused on developing solutions for energy management and physical security systems, to cater to the growing demand for sustainable and efficient buildings
Honeywell International Inc. is a multinational conglomerate corporation headquartered in Charlotte, North Carolina. Founded in 1925, it operates in four main areas: aerospace, building automation, performance materials and technologies (PMT), and safety and productivity solutions (SPS). It is known for its innovative solutions in energy efficiency, automation, and cybersecurity areas.
Cisco Systems, Inc. is a multinational technology company headquartered in San Jose, California. Founded in 1984, it specialises in networking hardware, software, and services. Cisco is known for its routers, switches, and network security solutions. The company has a significant presence in the global IT industry and is a major player in the development of the Internet of Things (IoT).
Siemens AG, founded in 1847, headquartered in Munich, Germany, is a leading provider of industrial automation solutions for energy, healthcare, and transportation industries. The company has a significant global presence and is known for its innovative technologies and solutions in areas such as industrial automation and renewable energy.
Hitachi, Ltd. is a Japanese multinational conglomerate founded in 1910 and headquartered in Chiyoda, Tokyo. The company is active in various industries, including digital systems, power and renewable energy solutions, railway systems, healthcare products, and financial systems.
*Please note that this is only a partial list; the complete list of key players is available in the full report. Additionally, the list of key players can be customized to better suit your needs.*
Other key players in the global smart building market include Schneider Electric SE, and Huawei Technologies Co., Ltd., among others.
North American market is driven by the high adoption of smart technologies and the presence of major players
North America dominates due to rising use of technologies, such as IoT, big data analytics, AI, and cloud computing to develop smart solutions for buildings and increase the safety of the occupants. The government of US is also working towards protecting the country’s environment and resources by increasing the energy efficiency of buildings by adopting smart technologies. For example, Duke Energy Centre in North Carolina boasts the highest green certification of LEED Platinum. It features 450,000 LED lights and reuses approximately 10 million gallons of water each year, harvested from groundwater, rainwater, and HVAC condensation.
Asia Pacific is also augmenting the smart building market growth by increasingly adopting smart technologies in public spaces, such as shopping centres, neighborhoods, and workplaces. Moreover, the rising urban population and the increasing disposable income are compelling consumers in the region to invest in smart building infrastructures. The Asia Pacific region is also home to several smart city projects, such as Songdo International Business District in South Korea and GIFT City in India, which are expected to drive the demand for smart building solutions.
Upto 15% Off
USD
$2499 $2249
$3999 $3599
$4999 $4249
$5999 $5099


*While we strive to always give you current and accurate information, the numbers depicted on the website are indicative and may differ from the actual numbers in the main report. At Expert Market Research, we aim to bring you the latest insights and trends in the market. Using our analyses and forecasts, stakeholders can understand the market dynamics, navigate challenges, and capitalize on opportunities to make data-driven strategic decisions.*
In 2025, the global smart building market attained a value of nearly USD 95.37 Billion.
The market is expected to grow at a CAGR of 10.40% between 2026 and 2035.
The market is estimated to witness a healthy growth in the forecast period of 2026-2035 to reach USD 256.51 Billion by 2035.
The rapid urbanisation, stringent government regulations aimed at environmental sustainability, rising demand for occupant’s safety, investments in smart city projects, and need to reduce energy consumption and costs are factors expected to aid the market growth.
Key trends aiding market expansion include the growing technological advancements, favourable government initiatives, and rising smart city projects.
Regions considered in the market are North America, Europe, the Asia Pacific, Latin America, and the Middle East and Africa.
The significant types of smart building are commercial, residential, and industrial.
The major components considered within the market report are building infrastructure management solution, energy management solution, workforce management solution, network management solution, and services.
Key players in the market are Honeywell International Inc., Cisco Systems, Inc., Siemens AG, Hitachi, Ltd., Schneider Electric SE, and Huawei Technologies Co., Ltd., among others.
Explore our key highlights of the report and gain a concise overview of key findings, trends, and actionable insights that will empower your strategic decisions.
| REPORT FEATURES | DETAILS |
| Base Year | 2025 |
| Historical Period | 2019-2025 |
| Forecast Period | 2026-2035 |
| Scope of the Report |
Historical and Forecast Trends, Industry Drivers and Constraints, Historical and Forecast Market Analysis by Segment:
|
| Breakup by Component |
|
| Breakup by Building Type |
|
| Breakup by Region |
|
| Market Dynamics |
|
| Competitive Landscape |
|
| Companies Covered |
|
| Report Price and Purchase Option | Explore our purchase options that are best suited to your resources and industry needs. |
| Delivery Format | Delivered as an attached PDF and Excel through email, with an option of receiving an editable PPT, according to the purchase option. |
Datasheet
One User
USD 2,499
USD 2,249
tax inclusive*
Single User License
One User
USD 3,999
USD 3,599
tax inclusive*
Five User License
Five User
USD 4,999
USD 4,249
tax inclusive*
Corporate License
Unlimited Users
USD 5,999
USD 5,099
tax inclusive*
*Please note that the prices mentioned below are starting prices for each bundle type. Kindly contact our team for further details.*
Flash Bundle
Small Business Bundle
Growth Bundle
Enterprise Bundle
*Please note that the prices mentioned below are starting prices for each bundle type. Kindly contact our team for further details.*
Flash Bundle
Number of Reports: 3
20%
tax inclusive*
Small Business Bundle
Number of Reports: 5
25%
tax inclusive*
Growth Bundle
Number of Reports: 8
30%
tax inclusive*
Enterprise Bundle
Number of Reports: 10
35%
tax inclusive*
How To Order

Select License Type
Choose the right license for your needs and access rights.

Click on ‘Buy Now’
Add the report to your cart with one click and proceed to register.

Select Mode of Payment
Choose a payment option for a secure checkout. You will be redirected accordingly.
Strategic Solutions for Informed Decision-Making
Gain insights to stay ahead and seize opportunities.

Get insights & trends for a competitive edge.

Track prices with detailed trend reports.

Analyse trade data for supply chain insights.

Leverage cost reports for smart savings

Enhance supply chain with partnerships.

Connect For More Information
Our expert team of analysts will offer full support and resolve any queries regarding the report, before and after the purchase.
Our expert team of analysts will offer full support and resolve any queries regarding the report, before and after the purchase.
We employ meticulous research methods, blending advanced analytics and expert insights to deliver accurate, actionable industry intelligence, staying ahead of competitors.
Our skilled analysts offer unparalleled competitive advantage with detailed insights on current and emerging markets, ensuring your strategic edge.
We offer an in-depth yet simplified presentation of industry insights and analysis to meet your specific requirements effectively.


