

Consumer Insights
Uncover trends and behaviors shaping consumer choices today
Procurement Insights
Optimize your sourcing strategy with key market data
Industry Stats
Stay ahead with the latest trends and market analysis.
The Global Visual Effects (VFX) Market reached a value of USD 40.18 Billion at 2025 and is projected to expand at a CAGR of around 12.90% during the forecast period of 2026-2035. With generative AI integration, virtual production scale-up, surging streaming content slates, and the expansion of advertising and gaming VFX pipelines, the market is expected to reach USD 135.19 Billion by 2035.
Compound Annual Growth Rate
12.9%
Value in USD Billion
2026-2035
Read more about this report - REQUEST FREE SAMPLE COPY IN PDF
| Global Visual Effect (VFX) Market Report Summary | Description | Value |
| Base Year | USD Billion | 2025 |
| Historical Period | USD Billion | 2019-2025 |
| Forecast Period | USD Billion | 2026-2035 |
| Market Size 2025 | USD Billion | 40.18 |
| Market Size 2035 | USD Billion | 135.19 |
| CAGR 2019-2025 | USD Billion | XX% |
| CAGR 2026-2035 | USD Billion | 12.90% |
| CAGR 2026-2035 - Market by Region | Asia Pacific | 13.3% |
| CAGR 2026-2035 - Market by Country | India | 13.7% |
| CAGR 2026-2035 - Market by Country | Italy | 13.4% |
| CAGR 2026-2035 - Market by Component | SOFTWARE | 13.5% |
| CAGR 2026-2035 - Market by Application | Movies | 13.2% |
| Market Share by Country 2025 | USA | 41.0% |
Generative AI, virtual production scaling, talent globalisation and growing streaming content slates are the dominant drivers shaping the Global Visual Effects (VFX) Market growth profile through the forecast period.
In February 2026, Foundry released Nuke 17.0, NukeX 17.0 and Nuke Studio 17.0, introducing native Gaussian Splat support, a production-ready USD-based 3D system, and BigCat – an extension of the CopyCat machine learning toolset designed for training custom AI models on very large VFX datasets. The release strengthens Nuke's position as the leading compositing platform among VFX studios, accelerating productivity for rotoscoping, beauty work and shot finishing while preserving artist-driven control over generative model outputs across feature, episodic and advertising pipelines.
Foundry announced in February 2026 the acquisition of Griptape, a generative AI orchestration platform, with plans to integrate the technology across its product line including Nuke, Mari and Modo. The deal extends Foundry's machine-learning roadmap, allowing artists to incorporate outputs from a range of generative AI models into their creative workflow. The acquisition reinforces software vendors' strategic shift to AI-augmented compositing, look development and asset generation, supporting studios looking to compress shot turnaround without sacrificing visual fidelity on premium content.
Framestore announced a joint venture with iwot studios on 11 February 2026, extending its global creative production footprint and reinforcing its commitment to feature, episodic and immersive work. Framestore had earlier expanded its London headquarters with a 30,000-square-foot virtual production stage equipped with LED walls comprising more than 15 million pixels, and the joint venture builds on this infrastructure base. The deal positions Framestore to deepen partnerships with streamers and studios on AI-enabled, virtual production-led pipelines.
In April 2025, Foundry unveiled Nuke Stage, a new application purpose-built for virtual production and in-camera visual effects (ICVFX) that connects preproduction to final pixel output within a single Nuke-based pipeline. The launch addresses the rapid scaling of LED stages, where standardised toolchains for content authoring and on-set finishing are needed to manage cost and quality. By extending its compositing leadership into virtual production, Foundry positions itself alongside hardware and stage operators in the rapidly growing in-camera VFX category.
Cinesite, the global VFX and animation studio with hubs in London, Montreal, Toronto and Vancouver, was acquired in March 2025, marking one of the largest VFX consolidations of the year. The transaction reinforces an industry-wide trend of scale-driven M&A as studios seek to combine creative IP, multi-territory tax-credit footprints and AI-enabled pipelines. The deal also follows the bankruptcy of Technicolor's group, which redistributed senior MPC and Mikros India talent across Framestore and Cinesite's Assemblage operation.
Generative AI has shifted from experimental tooling to mainstream production utility across global VFX pipelines. Foundry's Nuke 17.0 release in February 2026 introduced BigCat large-dataset machine learning, while its acquisition of Griptape that same month extended generative orchestration across the product portfolio. Studios are deploying AI for rotoscoping, beauty work, asset generation and look development, freeing senior artists for high-creativity sequences. The trend is supporting Global Visual Effects (VFX) Market growth by compressing shot turnaround times and unlocking new mid-budget projects that previously could not absorb premium VFX costs.
Virtual production stages have scaled from roughly 120 global installations in 2022 to more than 300 by 2024, with hardware costs down approximately 40% over the same period. Foundry's April 2025 Nuke Stage launch standardises ICVFX toolchains, while studios such as Framestore and Cinesite invest in dedicated LED facilities. The economics now favour mid-budget films, episodic series and high-end commercials – not just tentpoles – materially expanding the addressable VFX market. Real-time rendering quality has reached thresholds where in-camera pixels are increasingly final pixels, reducing reliance on green-screen.
The bankruptcy of Technicolor's MPC and Mikros operations in early 2025, followed by Cinesite's March 2025 acquisition and Framestore's February 2026 joint venture with iwot studios, marks an accelerating consolidation cycle. Phantom Media Group's 2025 roll-up of Milk VFX, Tippett Studio, PhantomFX, Lola Post and Spectre Post under one umbrella underscores the shift. Scale provides access to multi-territory tax credits, integrated AI pipelines and global talent pools – all increasingly necessary to compete on streaming volume contracts and premium feature work.
India is consolidating its position as a global VFX hub, supported by a 40% national VFX incentive, additional state-level uplifts in Maharashtra and Telangana, and a growing talent base across studios such as DNEG, Red Chillies VFX, Phantom Digital Effects and Prime Focus. DNEG raised USD 200 million from the United Al Saqer Group and is producing the Ramayana franchise project on a tentpole-scale budget. India's VFX sector is on track to reach approximately USD 3.8 billion in 2026, increasingly servicing both domestic content and global streaming and feature pipelines.
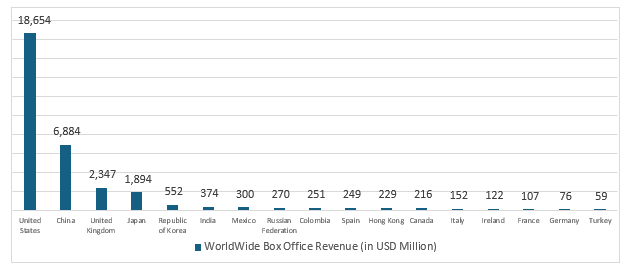
Figure: Worldwide Box Office Collection for Leading Countries (in USD Million), 2023
Read more about this report - REQUEST FREE SAMPLE COPY IN PDF
“Global Visual Effects (VFX) Market Report and Forecast 2026-2035” offers a detailed analysis of the market based on the following segments:
Market Breakup by Component
Key Insight: Software is the dominant component segment, anchored by Autodesk Maya and 3ds Max, Foundry Nuke (with the February 2026 Nuke 17 release embedding generative AI tooling), SideFX Houdini and Blender. Vendor consolidation and AI-driven feature releases – including Foundry's Griptape acquisition – are intensifying. Hardware spend benefits from LED stage build-out and high-performance GPU adoption, while services – encompassing pipeline integration, on-set supervision and outsourced shot work – capture a substantial share of total VFX value, particularly across India, Canada and the UK.
Market Breakup by Production Method
Key Insight: Modelling – encompassing 3D asset creation for environments, characters and props – is the leading production method, increasingly accelerated by generative-AI starting points and procedural workflows in Houdini. Matte painting remains a high-value craft for establishing shots and environment extension, with digital matte techniques merging seamlessly into virtual production stages. Other methods including motion capture, simulation, compositing and rotoscoping are expanding as content slates demand denser visual effects density per minute, especially in fantasy and superhero franchises.
Market Breakup by Application
Key Insight: Movies retain the largest share of VFX spend, supported by tentpole productions, Indian event films and recovering theatrical pipelines. Television (including streaming series) is the fastest-expanding application area, with episodic budgets routinely supporting feature-grade VFX work. Gaming benefits from real-time engines such as Unreal and Unity converging with VFX toolchains, while advertisements increasingly rely on virtual production for cost-efficient brand storytelling. The blurring lines across these applications support broader market growth.
Market Breakup by Region
Key Insight: North America leads VFX value capture, anchored by Hollywood studios, the Walt Disney Company and Warner Bros., and a large concentration of Vancouver, Toronto and Montreal facilities. Europe remains a creative powerhouse with Framestore, Foundry, RISE FX and the wider London cluster, supported by UK and German tax incentives. Asia-Pacific is the fastest-growing region driven by India's 40% incentive, China's domestic content investment and South Korea's gaming/streaming output. Latin America benefits from cost-competitive talent in Argentina and Brazil, while the Middle East and Africa is rising on Saudi Arabia's NEOM media investments.
By Component, Software is the dominant sub-segment, accounting for the largest share of VFX market revenue thanks to recurring subscriptions and the rapid release cadence of AI-augmented features. Foundry's Nuke 17.0 release in February 2026 and its near-simultaneous acquisition of generative AI firm Griptape illustrate why software vendors are widening their lead. Studios increasingly bundle Nuke, Houdini, Maya and proprietary tools into AI-orchestrated pipelines, while the supplier base remains relatively concentrated, with switching costs reinforcing share among Autodesk, Foundry, SideFX and Blender Foundation.
Figure: Revenue of Top 4 Categories of Games (in USD Billion), 2022

Read more about this report - REQUEST FREE SAMPLE COPY IN PDF
By Application, Movies hold the leading share, sustained by superhero franchises, fantasy event films and Indian tentpoles. DNEG's USD 200 million capital raise in 2025 and the high-profile Ramayana programme exemplify how feature production continues to drive the deepest, longest VFX engagements. Streaming-driven episodic television is the fastest-growing application, but movies' per-title VFX intensity – often involving thousands of shots and multi-vendor collaboration – preserves the segment's leadership in revenue terms across the forecast period.


Read more about this report - REQUEST FREE SAMPLE COPY IN PDF
North America is the leading regional VFX market, anchored by major Hollywood studios, deep streamer content slates from Disney, Warner Bros., Netflix and Amazon, and dense Canadian production hubs in Vancouver, Toronto and Montreal. The region hosts headquarters or major facilities for Digital Domain, Walt Disney Animation Studios, ILM and Rodeo FX, supported by federal and provincial tax credits that channel global production work northward. Investments in virtual production stages have expanded across Los Angeles, Vancouver and Atlanta, while AI-orchestration tooling adoption is highest among the top-five studios. Demand drivers include franchise tentpoles, premium episodic content, immersive theme park experiences and brand storytelling for Fortune 500 advertisers.
Asia Pacific is the fastest-growing regional VFX market, led by India's competitive 40% national incentive, Maharashtra and Telangana state uplifts, and a deep talent base spanning DNEG, Red Chillies VFX, Phantom Digital Effects and Prime Focus. DNEG's USD 200 million capital raise in 2025 and its tentpole-scale Ramayana production illustrate the depth of investment, while China's domestic content boom and South Korea's gaming/streaming pipelines complete the regional growth picture. Demand drivers include event films, OTT regional originals, advertising and gaming localisation, with Asia-Pacific expected to capture an increasingly material share of premium VFX work.
The Global Visual Effects (VFX) Market is moderately fragmented, with leading positions held by software vendors such as Autodesk, Foundry, SideFX and Blender Foundation, and major service studios including Framestore, Digital Domain, Cinesite, Rodeo FX and DNEG. Walt Disney and Warner Bros. integrate VFX inside their production ecosystems, while Indian studios such as Red Chillies VFX and Animal Logic anchor a growing global delivery network.
Competitive priorities centre on AI-orchestrated pipelines, virtual production stage capacity, tax-credit footprint diversification and senior creative talent retention. M&A is accelerating – exemplified by Foundry's Griptape acquisition (Feb 2026), the Cinesite ownership change (Mar 2025) and Framestore's iwot joint venture (Feb 2026) – as studios pursue scale and AI capability simultaneously.
Founded in 1996 and headquartered in London, United Kingdom, Foundry develops Nuke, Mari, Modo, Katana and Nuke Stage. The company is among the most strategically active in AI-augmented VFX tooling, having released Nuke 17.0 in February 2026 and acquired generative AI orchestration firm Griptape the same month. Foundry serves nearly all leading global VFX and animation studios.
Founded in 1982 and headquartered in San Francisco, California, Autodesk anchors the 3D content creation market with Maya, 3ds Max, Arnold, Flame and Bifrost. Its tools form the backbone of modelling, animation and rendering pipelines for both major film studios and game developers. Autodesk's geographic reach spans the entire global content creation ecosystem, with deep enterprise relationships across studios.
Founded in 1987 and headquartered in Toronto, Canada, Side Effects Software develops Houdini, the leading procedural FX and simulation toolset. Houdini is the de facto standard for fluid, fire, destruction and crowd simulations, and is increasingly used in real-time virtual production via Houdini Engine. The company's strengths include open APIs, strong artist community engagement and deep technical innovation.
Founded in 1986 and headquartered in London, United Kingdom, Framestore is one of the world's largest creative studios, with operations spanning film, episodic, immersive and advertising. The company opened a 30,000-square-foot London virtual production stage and on 11 February 2026 announced a joint venture with iwot studios, deepening its global production footprint and AI-enabled pipeline capabilities.
Other key players in the market are Blender Foundation, Cinesite, Digital Domain, Rodeo FX, Inc., RISE FX GmbH, Animal Logic Group, The Walt Disney Company, Warner Bros. Entertainment Inc., BluBlu Studios, Red Chillies Entertainments, and Others.
*Please note that this is only a partial list; the complete list of key players is available in the full report. Additionally, the list of key players can be customized to better suit your needs.*
Discover the latest insights on the Global Visual Effects (VFX) Market 2026 with our comprehensive report. Stay ahead of the curve with valuable data on software innovation, virtual production scaling and top growth regions across the AI-augmented post-production landscape. Whether you are launching new VFX software, investing in studio capacity or acquiring talent, this report gives you the clarity you need. Download your free sample now and discover the key opportunities in the thriving Global Visual Effects (VFX) industry.
Upto 15% Off
USD
$2999 $2699
$4399 $3959
$5599 $4759
$6659 $5660


*While we strive to always give you current and accurate information, the numbers depicted on the website are indicative and may differ from the actual numbers in the main report. At Expert Market Research, we aim to bring you the latest insights and trends in the market. Using our analyses and forecasts, stakeholders can understand the market dynamics, navigate challenges, and capitalize on opportunities to make data-driven strategic decisions.*
At 2025, the market reached an approximate value of USD 40.18 Billion.
The market is projected to grow at a CAGR of 12.90% between 2026 and 2035.
The market is projected to grow significantly during the forecast period 2026 - 2035 to reach USD 135.19 Billion by 2035.
Key drivers include rising streaming content investment, the integration of generative AI into VFX pipelines, the rapid scaling of LED virtual production stages, India's competitive incentive regime and accelerating cross-application convergence between film, episodic, gaming and advertising.
By component, the market is segmented into software, hardware and services. Software currently dominates revenue contribution, anchored by Foundry's Nuke (Nuke 17.0 with BigCat AI tools), Autodesk Maya and SideFX Houdini, with services and hardware closely following on the back of virtual production scale-up.
Key trends include mainstream generative AI adoption, scaling of virtual production economics into mid-budget projects, accelerating M&A and consolidation, and India's emergence as a global VFX powerhouse.
The key players in the market include The Foundry Visionmongers Ltd, Blender Foundation, Autodesk, Inc., Side Effects Software Inc., Cinesite, Digital Domain, Framestore Limited, Rodeo FX, Inc., RISE FX GmbH, Animal Logic Group, The Walt Disney Company, Warner Bros. Entertainment Inc., BluBlu Studios, Red Chillies Entertainments and Others.
North America, Europe, Asia-Pacific, Latin America, the Middle East, and Africa are the major regions covered in the market report.
Explore our key highlights of the report and gain a concise overview of key findings, trends, and actionable insights that will empower your strategic decisions.
| REPORT FEATURES | DETAILS |
| Base Year | 2025 |
| Historical Period | 2019-2025 |
| Forecast Period | 2026-2035 |
| Scope of the Report |
Historical and Forecast Trends, Industry Drivers and Constraints, Historical and
|
| Breakup by Component |
|
| Breakup by Production Method |
|
| Breakup by Application |
|
| Breakup by Region |
|
| Market Dynamics |
|
| Competitive Landscape |
|
| Companies Covered |
|
Datasheet
One User
USD 2,999
USD 2,699
tax inclusive*
Single User License
One User
USD 4,399
USD 3,959
tax inclusive*
Five User License
Five User
USD 5,599
USD 4,759
tax inclusive*
Corporate License
Unlimited Users
USD 6,659
USD 5,660
tax inclusive*
*Please note that the prices mentioned below are starting prices for each bundle type. Kindly contact our team for further details.*
Flash Bundle
Small Business Bundle
Growth Bundle
Enterprise Bundle
*Please note that the prices mentioned below are starting prices for each bundle type. Kindly contact our team for further details.*
Flash Bundle
Number of Reports: 3
20%
tax inclusive*
Small Business Bundle
Number of Reports: 5
25%
tax inclusive*
Growth Bundle
Number of Reports: 8
30%
tax inclusive*
Enterprise Bundle
Number of Reports: 10
35%
tax inclusive*
How To Order

Select License Type
Choose the right license for your needs and access rights.

Click on ‘Buy Now’
Add the report to your cart with one click and proceed to register.

Select Mode of Payment
Choose a payment option for a secure checkout. You will be redirected accordingly.
Strategic Solutions for Informed Decision-Making
Gain insights to stay ahead and seize opportunities.

Get insights & trends for a competitive edge.

Track prices with detailed trend reports.

Analyse trade data for supply chain insights.

Leverage cost reports for smart savings

Enhance supply chain with partnerships.

Connect For More Information
Our expert team of analysts will offer full support and resolve any queries regarding the report, before and after the purchase.
Our expert team of analysts will offer full support and resolve any queries regarding the report, before and after the purchase.
We employ meticulous research methods, blending advanced analytics and expert insights to deliver accurate, actionable industry intelligence, staying ahead of competitors.
Our skilled analysts offer unparalleled competitive advantage with detailed insights on current and emerging markets, ensuring your strategic edge.
We offer an in-depth yet simplified presentation of industry insights and analysis to meet your specific requirements effectively.


