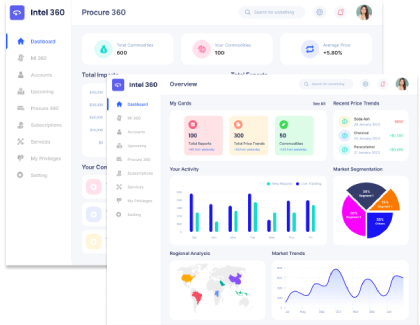
Consumer Insights
Uncover trends and behaviors shaping consumer choices today
Procurement Insights
Optimize your sourcing strategy with key market data
Industry Stats
Stay ahead with the latest trends and market analysis.
The Netherlands paid the most for extracted soybean flour in Q3 2026: USD 720/MT, up 1.4% from USD 710/MT in Q2. Import costs, energy costs and steady demand from food and feed makers keep Dutch prices above the other three markets. Worldwide, the average rose 1.3% to USD 615/MT from USD 607/MT, mostly because higher soybean costs and firm demand from food and feed makers led crushers and processors to raise prices in all four markets. What about Q4 2026? We expect a global average somewhere in the USD 600-650/MT range, with soybean prices, crush margins, demand from feed and food makers and freight costs doing most of the work.
Extracted soybean flour is a fine powder made by grinding soybean flakes after the oil has been removed with a solvent. It is high in protein and is used in bakery, meat products, pet food, feed and plant-based foods. Prices in this report refer to defatted soybean flour in bulk bags and are quoted per metric ton. They depend on soybean prices, crush margins and demand from food and feed makers.
Crushers clean, crack and flake soybeans, extract the oil with a solvent and toast the remaining flakes. Part of the flakes is ground into flour for food use, and the rest becomes soybean meal for feed. Argentina, Brazil, the United States and China are the main crushing regions. Flour sells at a premium to meal because it needs finer grinding, heat control and food grade handling.
Prices should rise modestly through the rest of 2026. Soybean costs are firm and demand from food and feed makers is steady. Large crush volumes in South America limit the size of the increase. Against USD 590/MT in Q3 2025, the current global average of USD 615/MT represents an increase of 4.2%.
The risks for Q4 are balanced, with no clear tilt either way. What could push prices higher? Higher soybean prices, lower crush volumes or stronger demand from food makers would lift prices. What could pull them lower? Lower soybean prices, larger crush volumes or weaker demand from feed makers would lower prices.
| Region | 2026 Price Range (USD/MT) | Outlook |
| Global Average | 600 - 650 | Firm soybean costs support a modest rise |
| Argentina | 525 - 570 | Large crush volumes keep prices lowest |
| Brazil | 545 - 590 | Large crush volumes limit prices |
| United States | 625 - 675 | Food grade demand supports prices |
| Netherlands | 700 - 760 | Import costs and food grade demand keep prices highest |
Argentina's average moved up 1.5% in Q3 2026, to USD 540/MT from USD 532/MT in Q2. Argentine prices rose as the demand from feed and food makers improved. The year-on-year change is a 4.9% increase, from USD 515/MT in Q3 2025. The price in Argentina was 12.2% below the group average of USD 615/MT in Q3 2026.
Why did the price of Extracted Soybean Flour change in Q3 2026 in Argentina?
Argentina rose. Demand from feed and food makers improved, soybean costs increased, and crushers raised prices. Over the first nine months of 2026 the price in Argentina has risen by 3.4%, which compares with a 3.2% gain in the global average. Across the four markets the average was 1.3% higher on the quarter.
Prices in Brazil firmed 1.3% in Q3 2026 to USD 560/MT, compared with USD 553/MT in Q2. Brazilian prices rose as the demand from feed makers improved. The Q3 2026 average is 4.1% above the USD 538/MT recorded in Q3 2025. The gap to the four-market average of USD 615/MT was 8.9% below for Brazil.
Why did the price of Extracted Soybean Flour change in Q3 2026 in Brazil?
Brazil rose. Demand from feed makers improved, soybean costs increased, and crushers raised offers. Since the end of 2025, the price in Brazil has risen 3.1%, from USD 543/MT to USD 560/MT, while the global average has risen 3.2%. On the global measure the average was 1.3% higher over the quarter. This represents a quarter-on-quarter change of 1.3% for Brazil.
The United States recorded a 1.3% gain in Q3 2026, with the average reaching USD 640/MT against USD 632/MT in Q2. American prices rose as the demand from bakery and meat processors improved. Compared with Q3 2025, when the United States averaged USD 616/MT, the current price is 3.9% higher. Relative to the four-market average of USD 615/MT, the United States traded 4.1% above in Q3 2026.
Why did the price of Extracted Soybean Flour change in Q3 2026 in United States?
The United States rose. Demand from bakery and meat processors improved, soybean costs increased, and processors raised prices. The cumulative 2026 change for the United States is a 2.9% increase, from USD 622/MT to USD 640/MT, while the global average shows a 3.2% gain over the same period. For comparison, the global average moved 1.3% higher over the same quarter.
The Q3 2026 average for the Netherlands stood at USD 720/MT, an increase of 1.4% on the USD 710/MT recorded in Q2. Dutch prices rose as the demand from food and feed makers improved. Measured against Q3 2025, when the average stood at USD 689/MT, the market is 4.5% higher. This places the Netherlands 17.1% above the four-market average of USD 615/MT for Q3 2026.
Why did the price of Extracted Soybean Flour change in Q3 2026 in Netherlands?
The Netherlands rose. Demand from food and feed makers improved, import costs increased, and importers raised prices. At USD 720/MT, the Netherlands is 3.3% higher than in Q4 2025, when the average was USD 697/MT, and the global average is 3.2% higher over the same period. The global average shifted 1.3% higher in the same quarter.
The Q2 2026 average for Argentina stood at USD 532/MT, an increase of 1.1% on the USD 526/MT recorded in Q1. Argentine prices rose as the demand from feed makers strengthened. Year on year, the average is 5.3% higher, against USD 505/MT in Q2 2025. The four markets averaged USD 607/MT in the quarter, so the price in Argentina was 12.4% lower.
Why did the price of Extracted Soybean Flour change in Q2 2026 in Argentina?
Argentina rose. Demand from feed makers strengthened, soybean costs went up, and crushers lifted prices. After a 0.8% gain in Q1, the quarter closed 5.3% above the USD 505/MT recorded in Q2 2025. The same direction continued in Q3, with the price reaching USD 540/MT. The global average shifted 1.0% higher in the same quarter.
Brazil registered a 1.1% increase in Q2 2026, taking the average to USD 553/MT from USD 547/MT in Q1. Brazilian prices rose as the demand from feed makers strengthened. The current level is 4.5% above the Q2 2025 average of USD 529/MT. In comparison with the average of USD 607/MT across the four markets, the price in Brazil was 8.9% lower.
Why did the price of Extracted Soybean Flour change in Q2 2026 in Brazil?
Brazil rose. Demand from feed makers strengthened, energy costs went up, and crushers lifted offers. This came on top of a 0.7% gain in Q1, and the average ended 4.5% above its level of a year earlier, when it stood at USD 529/MT. Q3 added to the change, with the price at USD 560/MT.
The United States firmed 0.8% to USD 632/MT in Q2 2026, from USD 627/MT in Q1. American prices rose as the demand from bakery makers strengthened. A year earlier, in Q2 2025, the average stood at USD 607/MT, which makes the current price 4.1% higher. The United States ended the quarter 4.1% above the group average of USD 607/MT.
Why did the price of Extracted Soybean Flour change in Q2 2026 in United States?
The United States rose. Demand from bakery makers strengthened, labor costs went up, and processors lifted prices. Q1 had brought a 0.8% gain, and by the end of Q2 the price was 4.1% above the Q2 2025 average of USD 607/MT. The move then extended in Q3, taking the price to USD 640/MT.
In Q2 2026, the average price in the Netherlands rose 1.0% to USD 710/MT, compared with USD 703/MT in Q1. Dutch prices rose as the demand from food makers strengthened. Taking Q2 2025 as the base, at USD 676/MT, the latest quarter is 5.0% higher. The price in the Netherlands was 17.0% above the group average of USD 607/MT in Q2 2026.
Why did the price of Extracted Soybean Flour change in Q2 2026 in Netherlands?
The Netherlands rose. Demand from food makers strengthened, energy costs went up, and importers lifted prices. Coming after a 0.9% gain in Q1, the Q2 figure sits 5.0% above the USD 676/MT of Q2 2025. The same direction continued in Q3, with the price reaching USD 720/MT. For comparison, the global average moved 1.0% higher over the same quarter.
Extracted Soybean Flour prices rose through 2025 and the first half of 2026 and rose again in the third quarter in all four markets. The global average moved from USD 570/MT in Q1 2025 to 579 in Q2, 590 in Q3 and 596 in Q4, then 601 in Q1 2026, 607 in Q2 and 615 in Q3, a net gain of roughly 7.9% across the window. Higher soybean costs and steady demand from food and feed makers lifted prices for six quarters.
| Quarter | Price (USD/MT) | QoQ Change | Direction |
| Q3 2026 | 615 | +1.3% | ↑ Rising |
| Q2 2026 | 607 | +1.0% | ↑ Rising |
| Q1 2026 | 601 | +0.8% | ↑ Rising |
| Q4 2025 | 596 | +1.0% | ↑ Rising |
| Q3 2025 | 590 | - | - Stable |
| Q4 2026 | In Progress | - | - In Progress |
2025 was a year of gradual increases for extracted soybean flour, with prices rising in each quarter in all four markets. Starting near USD 570/MT in Q1, the global average finished the year at 596 in Q4, a gain of about 4.6%. Higher soybean costs and steady demand from food and feed makers supported crushers throughout the year.
In Argentina, prices moved from about USD 497/MT in Q1 2025 to USD 522/MT by Q4, up roughly 5.0%. Argentine prices rose gradually as soybean costs and demand from feed makers increased. The Q4 2025 close of USD 522/MT compares with USD 540/MT in Q3 2026, a 3.4% increase. The quarterly sections above show how the annual average developed over the year.
In Brazil, prices moved from about USD 522/MT in Q1 2025 to USD 543/MT by Q4, up roughly 4.0%. Brazilian prices rose gradually as the energy costs and demand from feed makers increased. Relative to the end of 2025, the price in Brazil is 3.1% higher at USD 560/MT. The quarterly breakdown above allows each stage of that path to be traced.
In the United States, prices moved from about USD 598/MT in Q1 2025 to USD 622/MT by Q4, up roughly 4.0%. American prices rose gradually as the labor costs and demand from bakery makers increased. By Q3 2026 the average for the United States had reached USD 640/MT, 2.9% above the Q4 2025 close.
In the Netherlands, prices moved from about USD 664/MT in Q1 2025 to USD 697/MT by Q4, up roughly 5.0%. Dutch prices rose gradually as the energy costs and demand from food makers increased. The latest quarter places the Netherlands at USD 720/MT, which is 3.3% above the level at which 2025 ended.
Expert Market Research: Your Source for Real-Time Extracted Soybean Flour Price Intelligence
We keep a continuous eye on extracted soybean flour prices wherever it is produced or consumed at scale, tracing causation through soybean prices, crush margins, grinding costs, freight and demand from food and feed makers. Our forecasts draw on production data, trade flows, input cost trends and demand indicators across all reporting regions, so subscribers see why a price moved and not just that it did. Need pricing data, bespoke market analysis, or procurement advisory? Reach out to our team.


Upto 15% Off
USD
$799 $699


*While we strive to always give you current and accurate information, the numbers depicted on the website are indicative and may differ from the actual numbers in the main report. At Expert Market Research, we aim to bring you the latest insights and trends in the market. Using our analyses and forecasts, stakeholders can understand the market dynamics, navigate challenges, and capitalize on opportunities to make data-driven strategic decisions.*
Bakery, meat products, pet food, animal feed and plant-based foods.
In Q3 2026, it averaged USD 540/MT in Argentina, USD 560/MT in Brazil, USD 640/MT in the United States, and USD 720/MT in the Netherlands. The Netherlands was the priciest market.
The global average went from USD 596/MT in Q4 2025 to 601 in Q1, 607 in Q2 and 615 in Q3, up 3.2% overall. Gradual increases through 2025 and early 2026 continued in the third quarter.
Higher soybean costs and firm demand from food and feed makers led crushers to raise prices.
We expect a global average somewhere in the USD 600-650/MT range. Firm soybean costs and steady demand point to a modest rise.
The Netherlands sits at the top and Argentina at the bottom. The Netherlands pays the most on import costs and food grade demand, while Argentina sits lowest on large crush volumes.
Monthly. Need something more current? The Expert Market Research team is available directly.
Soybean prices, crush margins, weather and demand from food makers drive the volatility.
Argentina, Brazil, the United States and the Netherlands lead supply and use of extracted soybean flour.
Agree contracts with crushers, track soybean prices and diversify between supply regions.
One Year Subscription
One Year Subscription
USD 799
USD 699
tax inclusive*
*Please note that the prices mentioned below are starting prices for each bundle type. Kindly contact our team for further details.*
Flash Bundle
Small Business Bundle
Growth Bundle
Enterprise Bundle
*Please note that the prices mentioned below are starting prices for each bundle type. Kindly contact our team for further details.*
Flash Bundle
Number of Reports: 3
20%
tax inclusive*
Small Business Bundle
Number of Reports: 5
25%
tax inclusive*
Growth Bundle
Number of Reports: 8
30%
tax inclusive*
Enterprise Bundle
Number of Reports: 10
35%
tax inclusive*
How To Order

Select License Type
Choose the right license for your needs and access rights.

Click on ‘Buy Now’
Add the report to your cart with one click and proceed to register.

Select Mode of Payment
Choose a payment option for a secure checkout. You will be redirected accordingly.
Strategic Solutions for Informed Decision-Making
Gain insights to stay ahead and seize opportunities.
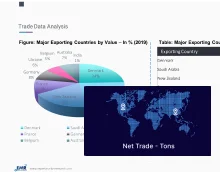
Get insights & trends for a competitive edge.
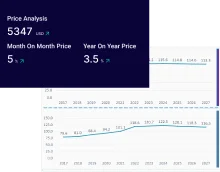
Track prices with detailed trend reports.
Analyse trade data for supply chain insights.

Leverage cost reports for smart savings
Enhance supply chain with partnerships.
Connect For More Information
Our expert team of analysts will offer full support and resolve any queries regarding the report, before and after the purchase.
Our expert team of analysts will offer full support and resolve any queries regarding the report, before and after the purchase.
We employ meticulous research methods, blending advanced analytics and expert insights to deliver accurate, actionable industry intelligence, staying ahead of competitors.
Our skilled analysts offer unparalleled competitive advantage with detailed insights on current and emerging markets, ensuring your strategic edge.
We offer an in-depth yet simplified presentation of industry insights and analysis to meet your specific requirements effectively.