Consumer Insights
Uncover trends and behaviors shaping consumer choices today
Procurement Insights
Optimize your sourcing strategy with key market data
Industry Stats
Stay ahead with the latest trends and market analysis.
In Germany, the highest-cost reporting region, Halogenated Solvent Waste prices moved only just under 0.2% in Q3 2026, moving from just above USD 626/MT in Q2 to roughly USD 625/MT in Q3, and it was stable incineration capacity and steady volumes from pharmaceutical and chemical generators that most plausibly shaped the move. Across the tracked regions, the global average moved from close to USD 472/MT in Q2 to about USD 471/MT in Q3, a change of near 0.2%. For Q4 2026, a global average of just under USD 452 to 495/MT is expected, with incinerator capacity, hazardous waste regulation, and generator volumes guiding the range.
Halogenated solvent waste is spent solvent containing chlorine, fluorine, or bromine, such as dichloromethane, chloroform, trichloroethylene, and perchloroethylene, which is collected from industrial users and sent for incineration or solvent recovery. It is generated in pharmaceutical synthesis, degreasing, electronics, paint stripping, and laboratory work, and it is treated by high temperature incineration with acid gas scrubbing or by distillation and reuse, with pharmaceutical and chemical producers generating the largest share. Incinerator capacity, hazardous waste regulation, energy and transport costs, and generator volumes all feed into the price, which is the fee paid for treatment in most regions.
The balance of supply and demand for halogenated solvent waste treatment through the end of 2026 leans stable. Incinerator capacity has been adequate, and generator volumes were steady through the third quarter. Treatment fees in the major regions moved only slightly.
The main upside risk is an outage at a major incinerator or tighter permit rules that restrict capacity and lift fees above the forecast range. The main downside risk is new treatment capacity or a drop in pharmaceutical output, which would pull fees below the forecast.
| Region | 2026 Price Range (USD/MT) | Outlook |
| Global Average | 452 - 495 | Stable capacity guides the range |
| Germany | 600 - 656 | Strict rules hold the top |
| United States | 523 - 572 | Permitted incinerators hold a firm level |
| China | 319 - 349 | Cluster facilities hold a middle level |
| India | 367 - 401 | Competition keeps China lowest |
The Germany market held to an average of just under USD 625/MT in Q3 2026, a move of just roughly 0.2% against just above USD 626/MT in Q2 2026. What kept the range tight was steady incinerator capacity, while balanced volumes from pharmaceutical generators offset the pull in the other direction.
Why did the price of Halogenated Solvent Waste change in Q3 2026 in Germany?
The Germany market sat in a narrow band as Balanced volumes from pharmaceutical generators and steady incinerator capacity cancelled each other out. Strict hazardous waste rules and high incineration costs keep Germany the highest priced region. The average for the quarter was just under USD 625/MT.
The United States Halogenated Solvent Waste prices averaged close to USD 545/MT in Q3 2026, little changed at near 0.2% from about USD 546/MT in Q2 2026. It was balanced volumes from pharmaceutical generators that held the market in balance, with steady incinerator capacity limiting any move.
Why did the price of Halogenated Solvent Waste change in Q3 2026 in United States?
Steady incinerator capacity and balanced volumes from pharmaceutical generators pulled in opposite directions through the quarter, and neither was able to dominate. Permitted hazardous waste incinerators set the market, with transport costs adding to the delivered price. The United States average stayed at close to USD 545/MT.
The China market held to an average of just under USD 332/MT in Q3 2026, a move of just roughly 0.3% against just above USD 333/MT in Q2 2026. What kept the range tight was steady incinerator capacity, while balanced volumes from pharmaceutical generators offset the pull in the other direction.
Why did the price of Halogenated Solvent Waste change in Q3 2026 in China?
The China market sat in a narrow band as Balanced volumes from pharmaceutical generators and steady incinerator capacity cancelled each other out. Licensed treatment plants compete for volume, which keeps the cost of disposal the lowest. The average for the quarter was just under USD 332/MT.
India Halogenated Solvent Waste prices averaged close to USD 382/MT in Q3 2026, little changed at near 0.3% from about USD 383/MT in Q2 2026. It was balanced volumes from pharmaceutical generators that held the market in balance, with steady incinerator capacity limiting any move.
Why did the price of Halogenated Solvent Waste change in Q3 2026 in India?
Steady incinerator capacity and balanced volumes from pharmaceutical generators pulled in opposite directions through the quarter, and neither was able to dominate. Common treatment facilities near industrial clusters set a middle price. The India average stayed at close to USD 382/MT.
The Germany market held to an average of just under USD 626/MT in Q2 2026, a move of just roughly 0.3% against just above USD 628/MT in Q1 2026. What kept the range tight was steady incinerator capacity, while balanced volumes from pharmaceutical generators offset the pull in the other direction.
Why did the price of Halogenated Solvent Waste change in Q2 2026 in Germany?
The Germany market sat in a narrow band as Balanced volumes from pharmaceutical generators and steady incinerator capacity cancelled each other out. Strict hazardous waste rules and high incineration costs keep Germany the highest priced region. The average for the quarter was just under USD 626/MT.
The United States Halogenated Solvent Waste prices averaged close to USD 546/MT in Q2 2026, little changed at near 0.4% from about USD 548/MT in Q1 2026. It was balanced volumes from pharmaceutical generators that held the market in balance, with steady incinerator capacity limiting any move.
Why did the price of Halogenated Solvent Waste change in Q2 2026 in United States?
Steady incinerator capacity and balanced volumes from pharmaceutical generators pulled in opposite directions through the quarter, and neither was able to dominate. Permitted hazardous waste incinerators set the market, with transport costs adding to the delivered price. The United States average stayed at close to USD 546/MT.
The China market held to an average of just under USD 333/MT in Q2 2026, a move of just roughly 0.3% against just above USD 334/MT in Q1 2026. What kept the range tight was steady incinerator capacity, while balanced volumes from pharmaceutical generators offset the pull in the other direction.
Why did the price of Halogenated Solvent Waste change in Q2 2026 in China?
The China market sat in a narrow band as Balanced volumes from pharmaceutical generators and steady incinerator capacity cancelled each other out. Licensed treatment plants compete for volume, which keeps the cost of disposal the lowest. The average for the quarter was just under USD 333/MT.
India Halogenated Solvent Waste prices averaged close to USD 383/MT in Q2 2026, little changed at near 0.3% from about USD 384/MT in Q1 2026. It was balanced volumes from pharmaceutical generators that held the market in balance, with steady incinerator capacity limiting any move.
Why did the price of Halogenated Solvent Waste change in Q2 2026 in India?
Steady incinerator capacity and balanced volumes from pharmaceutical generators pulled in opposite directions through the quarter, and neither was able to dominate. Common treatment facilities near industrial clusters set a middle price. The India average stayed at close to USD 383/MT.
In the round, the global Halogenated Solvent Waste average opened the window at just above USD 471/MT in Q2 2025, moved to roughly USD 475/MT in Q3 and close to USD 475/MT in Q4, then moved to about USD 474/MT in Q1 2026, moved to near USD 472/MT in Q2 and moved to just under USD 471/MT in Q3 2026, a net gain of just above 0.0% over the window. Incinerator capacity, hazardous waste regulation, and generator volumes drove the overall price pattern.
| Quarter | Price (USD/MT) | QoQ Change | Direction |
| Q3 2026 | 471 | -0.2% | - Stable |
| Q2 2026 | 472 | -0.4% | - Stable |
| Q1 2026 | 474 | -0.2% | - Stable |
| Q4 2025 | 475 | +0.0% | - Stable |
| Q3 2025 | 475 | +0.8% | ↑ Rising |
| Q4 2026 | In Progress | - | - In Progress |
Halogenated solvent waste fees edged up through 2025 and then levelled off as capacity stayed adequate. The global average rose from roughly USD 468/MT in Q1 2025 to close to USD 475/MT by Q4, a full-year gain of about 1.5%.
Germany prices rose from near USD 620/MT in Q1 2025 to just under USD 630/MT by Q4, a gain of just above 1.6%. It was high incineration costs and stable volumes from pharmaceutical and chemical producers that shaped the year.
The United States prices rose from near USD 540/MT in Q1 2025 to just under USD 550/MT by Q4, a gain of just above 1.9%. It was stable incinerator capacity and steady volumes from industrial generators that shaped the year.
China prices rose from near USD 330/MT in Q1 2025 to just under USD 335/MT by Q4, a gain of just above 1.5%. It was stable treatment capacity and steady volumes from pharmaceutical and electronics producers that shaped the year.
India prices rose from near USD 380/MT in Q1 2025 to just under USD 385/MT by Q4, a gain of just above 1.3%. It was stable treatment capacity and steady volumes from pharmaceutical clusters that shaped the year.
Expert Market Research: Your Source for Real-Time Halogenated Solvent Waste Price Intelligence
Expert Market Research tracks Halogenated Solvent Waste prices continuously across every major producing and consuming region. The team traces causation through incinerator capacity, hazardous waste regulation, and generator volumes. Contact Expert Market Research today for Halogenated Solvent Waste pricing data, bespoke market analysis, and strategic procurement advisory.


Upto 15% Off
USD
$799 $699


*While we strive to always give you current and accurate information, the numbers depicted on the website are indicative and may differ from the actual numbers in the main report. At Expert Market Research, we aim to bring you the latest insights and trends in the market. Using our analyses and forecasts, stakeholders can understand the market dynamics, navigate challenges, and capitalize on opportunities to make data-driven strategic decisions.*
Pharmaceutical and chemical producers generate the largest share. The waste comes from synthesis, degreasing, electronics, and paint stripping and is treated by incineration or recovery.
The Q3 2026 average was near USD 625/MT in Germany, just under USD 545/MT in the United States, just above USD 332/MT in China, and roughly USD 382/MT in India. Germany carried the highest cost, on strict waste rules and high incineration costs.
The global average moved only slightly from close to USD 472/MT in Q2 to about USD 471/MT in Q3 2026, a move of near 0.2%. Stable incinerator capacity and steady generator volumes kept fees in a narrow band.
Incinerator capacity was adequate, pharmaceutical and chemical output was steady, and treatment operators held their fees. No outage changed the pattern.
The global average is expected between just under USD 452 and USD 495/MT for Q4 2026. Incinerator capacity, hazardous waste regulation, and generator volumes are expected to guide the range, with a stable bias.
Germany holds the premium on strict rules and incineration costs, the United States holds a firm level, India holds a middle level, and China prices lowest on competition between treatment plants.
The data is refreshed every month, and the Expert Market Research team can provide live pricing on request.
Fees respond mainly to incinerator capacity, hazardous waste regulation, energy and transport costs, and generator volumes.
Large hazardous waste groups in Europe, the United States, China, and India operate most of the treatment capacity.
Generators can use quarterly trends to time treatment contracts, compare incineration with recovery routes, and secure capacity before annual shutdowns.
One Year Subscription
One Year Subscription
USD 799
USD 699
tax inclusive*
*Please note that the prices mentioned below are starting prices for each bundle type. Kindly contact our team for further details.*
Flash Bundle
Small Business Bundle
Growth Bundle
Enterprise Bundle
*Please note that the prices mentioned below are starting prices for each bundle type. Kindly contact our team for further details.*
Flash Bundle
Number of Reports: 3
20%
tax inclusive*
Small Business Bundle
Number of Reports: 5
25%
tax inclusive*
Growth Bundle
Number of Reports: 8
30%
tax inclusive*
Enterprise Bundle
Number of Reports: 10
35%
tax inclusive*
How To Order

Select License Type
Choose the right license for your needs and access rights.

Click on ‘Buy Now’
Add the report to your cart with one click and proceed to register.

Select Mode of Payment
Choose a payment option for a secure checkout. You will be redirected accordingly.
Strategic Solutions for Informed Decision-Making
Gain insights to stay ahead and seize opportunities.
Get insights & trends for a competitive edge.
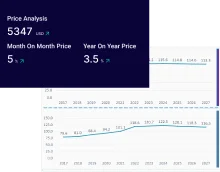
Track prices with detailed trend reports.
Analyse trade data for supply chain insights.
Leverage cost reports for smart savings
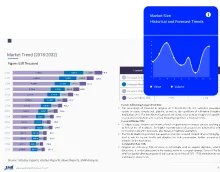
Enhance supply chain with partnerships.
Connect For More Information
Our expert team of analysts will offer full support and resolve any queries regarding the report, before and after the purchase.
Our expert team of analysts will offer full support and resolve any queries regarding the report, before and after the purchase.
We employ meticulous research methods, blending advanced analytics and expert insights to deliver accurate, actionable industry intelligence, staying ahead of competitors.
Our skilled analysts offer unparalleled competitive advantage with detailed insights on current and emerging markets, ensuring your strategic edge.
We offer an in-depth yet simplified presentation of industry insights and analysis to meet your specific requirements effectively.