

Consumer Insights
Uncover trends and behaviors shaping consumer choices today
Procurement Insights
Optimize your sourcing strategy with key market data
Industry Stats
Stay ahead with the latest trends and market analysis.
The North America weather barrier market reached a value of around USD 4.86 Billion in 2025. The industry is further expected to grow at a CAGR of about 3.50% between 2026 and 2035 to reach a value of USD 6.86 Billion by 2035.
Compound Annual Growth Rate
3.5%
Value in USD Billion
2026-2035
| North America Weather Barrier Market Report Summary | Description | Value |
| Base Year | USD Billion | 2025 |
| Historical Period | USD Billion | 2019-2025 |
| Forecast Period | USD Billion | 2026-2035 |
| Market Size 2025 | USD Billion | 4.86 |
| Market Size 2035 | USD Billion | 6.86 |
| CAGR 2019-2025 | Percentage | XX% |
| CAGR 2026-2035 | Percentage | 3.50% |
| CAGR 2026-2035 - Market by USA Region | New England | 3.4% |
| CAGR 2026-2035 - Market by Country | Canada | 3.7% |
| CAGR 2026-2035 - Market by Type | Roofing Underlayment | 3.8% |
| CAGR 2026-2035 - Market by Membrane Type | Fluid Applied | 3.9% |
| Market Share by Application 2025 | Mechanical | 70.2% |
The United States was the significant weather-resistant barrier market in North America in 2020. North America accounts for a 23% share in the global weather-resistant barrier industry. An essential part of the weather barrier industry includes air barriers. Air barriers protect the critical elements of the building like the walls, floors, and base, among others, from corrosion and chemical damage. It, therefore, guarantees that buildings are preserved and extends their lives. Air barrier systems have airtight quality and stability in a wide range of temperatures. Europe is the largest market for air barriers and accounts for 36% of the industry, globally. It is followed by the Asia Pacific, North America, Latin America, and the Middle East and Africa.
The industry is majorly driven by the global construction industry, which is rapidly growing. Increasing construction of non-residential buildings and modernizing transportation are significant drivers for the industry. The construction industry is aided by the rising population, urbanization as well as an increase in domestic manufacturing. The hurricanes and the California wildfires in the United States are leading to rising demand for new constructions, and are, thus, aiding the growth of the weather barrier industry in North America. Most of the house wrap and weather-resistant barrier (WRB) find their application in new buildings in the US, i.e., about 60% of house wrap / WRB material is installed on new buildings. The remainder is mainly installed on resided homes. Fluid-applied membranes now make up about 3% of new house wrap / WRB facilities.


A weather barrier prevents humidity, rain, and wind passage over critical areas of the walls and roofs and protects fragile building elements against degradation.
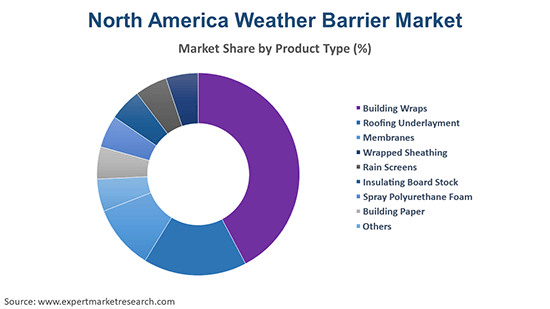
Market Breakup by Product Type
Market Breakup by Membrane Type
Market Breakup by End Use
Market Breakup by Region
Read more about this report - REQUEST FREE SAMPLE COPY IN PDF
| CAGR 2026-2035 - Market by | Type |
| Roofing Underlayment | 3.8% |
| Spray Polyurethane Foam | 3.5% |
| Insulating Board Stock | 3.3% |
| Building Wraps | XX% |
| Rain Screens | XX% |
| Others | XX% |
| CAGR 2026-2035 - Market by | Membrane Type |
| Fluid Applied | 3.9% |
| Mechanical | 3.5% |
| Self-Adhered | XX% |
| CAGR 2026-2035 - Market by | Country |
| Canada | 3.7% |
| USA | XX% |
Rising construction activities are driving the weather barrier industry in North America. The growing construction and infrastructure industries are significant drivers for the weather barrier industry. The regional industry is growing due to the increased demand for energy-efficient buildings by to meet the green building codes. Advances in building science, along with new and evolving codes, is leading to the rise in the construction of residential and commercial buildings, thus, aiding the weather barrier industry in North America.
| Market Share by | Membrane Type |
| Mechanical | 70.2% |
| Self-Adhered | XX% |
| Fluid Applied | XX% |
The increasing purchasing power of the consumers is also driving the industry forward. Rapid urbanisation is driving the demand for new infrastructure, thus, supporting the weather barrier industry. The rising population is driving the weather barrier industry in North America. The increasing customer awareness regarding the advantages of geomembranes combined with the introduction of new materials is expected to drive the demand further. The changing consumer preferences to durable and robust building materials are aiding the industry growth. The increasing competition among different key players is expected to push the production further.
| CAGR 2026-2035 - USA Market by | Region |
| New England | 3.4% |
| Great Lakes | 3.2% |
| Mideast | XX% |
| Plains | XX% |
| Southeast | 3.6% |
| Southwest | XX% |
| Rocky Mountain | 4.1% |
| Far West | 3.9% |
The report gives a detailed analysis of the following key players in the weather barrier market in North America, covering their competitive landscape, capacity, and latest developments like mergers, acquisitions, and investments, expansions of capacity, and plant turnarounds:
The comprehensive EMR report provides an in-depth assessment of the market based on the Porter's five forces model along with giving a SWOT analysis.
Saudi Arabia Structural Steel Market
Europe Freeze-Dried Fruit Products Market
Saudi Arabia Electric Motors and Transformers Maintenance Market
Upto 15% Off
USD
$2999 $2699
$4399 $3959
$5599 $4759
$6659 $5660


*While we strive to always give you current and accurate information, the numbers depicted on the website are indicative and may differ from the actual numbers in the main report. At Expert Market Research, we aim to bring you the latest insights and trends in the market. Using our analyses and forecasts, stakeholders can understand the market dynamics, navigate challenges, and capitalize on opportunities to make data-driven strategic decisions.*
The North America weather barrier market reached a value of about USD 4.86 Billion in 2025.
The market is projected to grow at a CAGR of nearly 3.50% in the forecast period of 2026-2035.
The market is estimated to reach a value of about USD 6.86 Billion by 2035.
The major drivers of the market include rising disposable incomes, increasing population, rising construction industry, rapid urbanisation, and an increase in domestic manufacturing.
The rising consumer awareness regarding the benefits of geomembranes, changing consumer preferences for robust and durable building materials, and the increasing use of weather barriers in new construction activities are the key trends propelling the market.
The major countries of weather barrier in North America includes the United States of America and Canada.
The various product types of weather barrier in the market include building wraps, roofing underlayment, membranes, wrapped sheathing, rain screens, insulating board stock, spray polyurethane foam, and building paper.
The major membrane types considered in the market report are self-adhered, mechanical, and fluid applied.
The major end-use segments of weather barrier in the market are residential, commercial, and public infrastructure.
The major market players include RPM International Inc., BASF SE, DuPont de Nemours, Inc., LATICRETE International, Inc., and GCP Applied Technologies Inc., among others.
Explore our key highlights of the report and gain a concise overview of key findings, trends, and actionable insights that will empower your strategic decisions.
| REPORT FEATURES | DETAILS |
| Base Year | 2025 |
| Historical Period | 2019-2025 |
| Forecast Period | 2026-2035 |
| Scope of the Report |
Historical and Forecast Trends, Industry Drivers and Constraints, Historical and Forecast Market Analysis by Segment:
|
| Breakup by Product Type |
|
| Breakup by Membrane Type |
|
| Breakup by End Use |
|
| Breakup by Region |
|
| Market Dynamics |
|
| Competitive Landscape |
|
| Companies Covered |
|
| Report Price and Purchase Option | Explore our purchase options that are best suited to your resources and industry needs. |
| Delivery Format | Delivered as an attached PDF and Excel through email, with an option of receiving an editable PPT, according to the purchase option. |
Datasheet
One User
USD 2,999
USD 2,699
tax inclusive*
Single User License
One User
USD 4,399
USD 3,959
tax inclusive*
Five User License
Five User
USD 5,599
USD 4,759
tax inclusive*
Corporate License
Unlimited Users
USD 6,659
USD 5,660
tax inclusive*
*Please note that the prices mentioned below are starting prices for each bundle type. Kindly contact our team for further details.*
Flash Bundle
Small Business Bundle
Growth Bundle
Enterprise Bundle
*Please note that the prices mentioned below are starting prices for each bundle type. Kindly contact our team for further details.*
Flash Bundle
Number of Reports: 3
20%
tax inclusive*
Small Business Bundle
Number of Reports: 5
25%
tax inclusive*
Growth Bundle
Number of Reports: 8
30%
tax inclusive*
Enterprise Bundle
Number of Reports: 10
35%
tax inclusive*
How To Order

Select License Type
Choose the right license for your needs and access rights.

Click on ‘Buy Now’
Add the report to your cart with one click and proceed to register.

Select Mode of Payment
Choose a payment option for a secure checkout. You will be redirected accordingly.
Strategic Solutions for Informed Decision-Making
Gain insights to stay ahead and seize opportunities.

Get insights & trends for a competitive edge.

Track prices with detailed trend reports.

Analyse trade data for supply chain insights.

Leverage cost reports for smart savings

Enhance supply chain with partnerships.

Connect For More Information
Our expert team of analysts will offer full support and resolve any queries regarding the report, before and after the purchase.
Our expert team of analysts will offer full support and resolve any queries regarding the report, before and after the purchase.
We employ meticulous research methods, blending advanced analytics and expert insights to deliver accurate, actionable industry intelligence, staying ahead of competitors.
Our skilled analysts offer unparalleled competitive advantage with detailed insights on current and emerging markets, ensuring your strategic edge.
We offer an in-depth yet simplified presentation of industry insights and analysis to meet your specific requirements effectively.


