

Consumer Insights
Uncover trends and behaviors shaping consumer choices today
Procurement Insights
Optimize your sourcing strategy with key market data
Industry Stats
Stay ahead with the latest trends and market analysis.
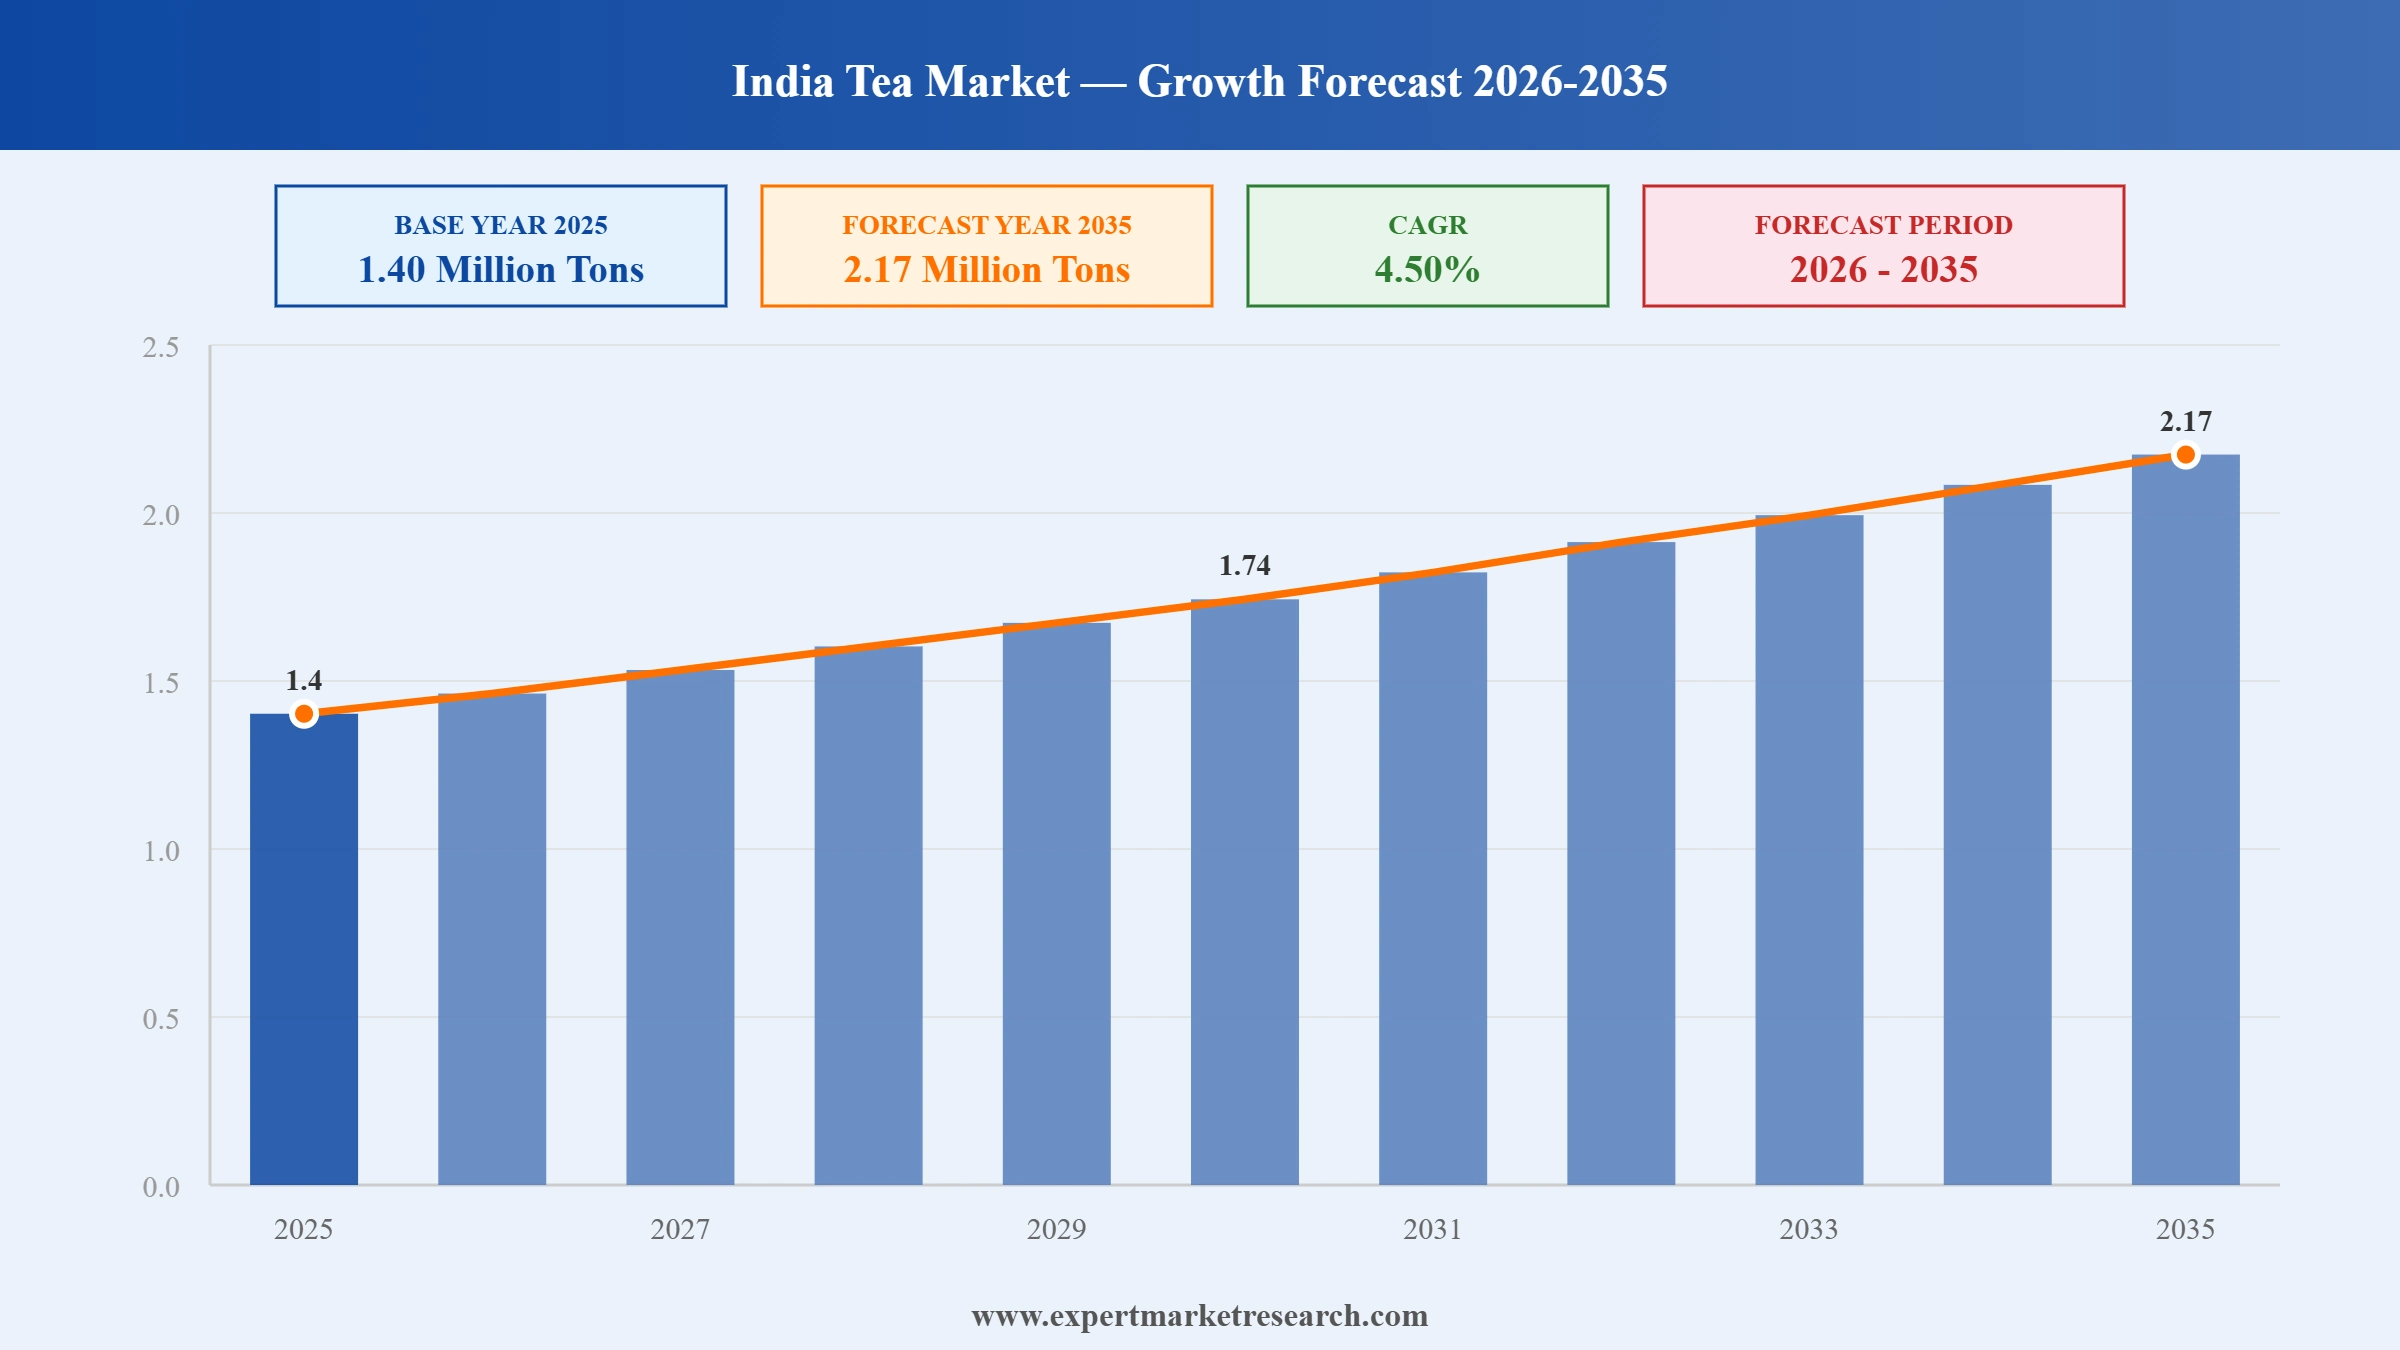
The India tea market attained a volume of 1.40 Million Tons in 2025 and is projected to expand at a CAGR of 4.50% through 2035. The market is further expected to achieve a volume of 2.17 Million Tons by 2035. Premium flavored and wellness-infused tea blends are expanding in modern trade channels, driven by urban demand for functional beverages and rising organized retail penetration across Tier II cities. India is one of the largest tea producing and consuming countries in the world. The Indian tea industry includes major segments such as black tea, green tea, herbal tea, and specialty tea blends. Growing domestic consumption, expanding exports, and increasing demand for premium packaged tea are shaping the growth of the Indian tea market.
In value terms, the market stood at approximately INR 78,000 crore in 2025 and is expected to surpass INR 1,25,000 crore by 2034, supported by premiumization, export diversification, and packaged tea penetration across Tier II and Tier III cities.
India accounts for nearly 22% of global tea production and remains the second largest tea producer globally after China. Around 80% of domestic production is consumed within the country, while nearly 20% is exported.
Policy-level discussions about Production Linked Incentive support for food processing modernization are encouraging mechanized sorting, automated blending, and upgraded packaging lines across Assam and West Bengal. This is improving yield consistency and reducing post-harvest losses, thereby accelerating the India tea market value. Moreover, stronger export shipments to Russia and the UAE are considerably stabilizing the overall orthodox tea consumption. Russia accounted for approximately 17% of total tea exports, followed by the UAE at 11%, Iraq at 8%, and the United States at 6% in 2025. Between FY2023 and FY2025, export revenue grew at nearly 14% CAGR, outpacing domestic volume growth, indicating value expansion rather than pure volume expansion. Exporters are securing repeat contracts, which gives producers better volume visibility and planning confidence.
According to the India tea market analysis, the country exported 280.40 million kg during the January-December period in 2025, up from 256.17 million kg in the same period the previous year. Organized brands are pushing immunity focused and region-specific blends to secure higher realization per kg. For example, in March 2025, Luxmi Tea Estates launched Zero Proof, a 100% organic cold-tea concentrate combining Makaibari estate teas with herbs like turmeric, tulsi, and ginger. On the other hand, in September 2023, Tata Consumer Products expanded its premium portfolio with Tata Tea Gold Care and Chakra Gold variants to strengthen its hold in South and East India. Sharper SKU segmentation and formulation upgrades are now significantly shaping competitive positioning across the market.
At the same time, private labels and D2C specialists are moderately accelerating export-led value capture. Companies like Vahdam India are scaling carbon neutral certified exports while promoting single origin Assam and Darjeeling micro-batches. Export-focused players are investing in vacuum sealed packaging and blockchain enabled traceability to align with the sustainability agenda. In July 2025, Assam’s Woolah launched patented bag-less tea technology globally, eliminating paper tea bags and enhancing flavor purity while reducing paper waste and production costs. This India tea market trend strengthens credibility with institutional buyers and specialty retailers overseas.
Get a sample of the market report in PDF – Request a free sample
According to Expert Market Research, India remains one of the world’s largest tea producers, making India a central pillar of the global tea economy. The country’s diverse climate and geography enable large-scale cultivation across multiple regions, supporting strong growth in tea production India and strengthening the overall tea industry India.
The northeastern state of Assam dominates national output. Known for its rich soil and humid climate, the region contributes nearly half of India’s total tea production. Strong assam tea production volumes make it a key supplier of robust black tea widely consumed across global markets.
Meanwhile, West Bengal particularly the Darjeeling and Dooars regions plays a major role in premium tea cultivation. These high-altitude plantations produce distinctive teas valued for their flavor complexity and export demand.
Southern states such as Tamil Nadu, Kerala, and Karnataka also host extensive tea estates. Their year-round harvesting cycles contribute significantly to national supply stability.
Globally, India competes closely with leading producers like China, Kenya, and Sri Lanka. With strong domestic consumption and expanding exports, India continues to strengthen its position in the international tea trade, reinforcing its long-standing leadership in the global tea market.
The Indian tea export market plays a significant role in the global beverage trade, positioning India among the leading suppliers of black and specialty teas. Strong global demand and established trade relationships continue to drive tea export from India, supporting growers, exporters, and processing units across major tea-producing regions.
A major share of exports is directed to Russia, which has historically remained one of the largest buyers of Indian tea. Russian consumers prefer strong, full-bodied teas commonly sourced from Assam and North India. Another important destination is the United Arab Emirates, which not only imports tea for domestic consumption but also acts as a key re-export hub for the Middle East.
Within the broader global tea trade, India competes with major exporters such as Kenya, Sri Lanka, and China. According to the Tea Board of India, export volumes have shown steady growth due to improved quality standards, certification compliance, and stronger international distribution networks.
As global demand for premium and origin-specific teas increases, the Indian tea export market is expected to expand further, offering new opportunities for exporters and strengthening India’s presence in international tea markets.
India has one of the most diverse tea cultures in the world, supported by varied climates and long-standing cultivation traditions. Understanding the different types of tea in India is important for consumers, businesses, and industry stakeholders, as each variety contributes differently to the evolving tea industry India. Market demand, health awareness, and premiumization trends are shaping growth across segments such as the black tea market India, green tea market India, and the expanding herbal tea market.
Black Tea
Black tea dominates the black tea market India, accounting for the majority of domestic consumption and exports. Major production regions such as Assam and West Bengal produce strong, full-bodied teas widely consumed in traditional Indian chai and global markets.
Green Tea
The green tea market India is growing steadily due to increasing consumer focus on wellness and antioxidants. States like Assam and Tamil Nadu are expanding green tea production to meet rising health-driven demand.
Herbal Tea
The herbal tea market includes caffeine-free infusions made from herbs, spices, and botanicals such as tulsi, ginger, and chamomile. These teas are gaining popularity for their perceived health benefits and natural ingredients.
Oolong Tea
Oolong tea, a partially oxidized variety, represents a niche but premium segment in India. Though produced in smaller quantities, it is gaining attention among specialty tea consumers and international buyers seeking unique flavor profiles.
Climate volatility and export Compliance pressures hinder market growth
Climate change in Assam and West Bengal is severely affecting yield quality and crop maturity. Unpredictable rainfall and higher temperatures continue to degrade leaf quality. Thus, blending accuracy for well-known brands becomes less feasible. Secondly, stricter EU and Middle East export residue standards are adding up to compliance costs, thereby hindering the India tea market growth. To ensure conformity, companies are setting up sophisticated testing laboratories and traceability systems.
Tata Tea Agni launched “Extra Josh,” positioned as India’s first tea with added natural caffeine. Such functional fortification trend in the India tea market creates opportunity for competitors to develop performance-driven mass-market blends with clear benefit communication.
Bebida Hospitality introduced Copenhagen Sparkling Tea into premium HoReCa channels, positioning tea as a non-alcoholic fine-dining beverage alternative. Such developments open up new opportunities for Indian brands to premiumize tea through curated hospitality partnerships and alternative beverage formats.
Hindustan Unilever introduced “Tea Next” to support Assam’s small tea growers through training, quality upgrades, and sustainable sourcing integration. Competitors can leverage similar grower partnerships to secure stable sourcing and enhance sustainability credibility.
Beyond Water launched its first ready-to-drink iced tea in India with a strong health positioning, emphasizing low sugar and functional hydration benefits. Such developments in the India tea market signal opportunity for brands to expand into RTD formats and capture modern retail shelf growth.
Functional teas are rapidly expanding shelf space across organized retail. Brands are introducing turmeric green tea, ashwagandha blends, and probiotic infusions to attract health-conscious urban buyers. Between April and October of FY 2025-26, India’s tea exports touched USD 605.77 million, registering a 15.13% increase, according to the Department of Commerce and Tea Board of India. Companies are responding with smaller batch production and nitrogen flushed packaging to preserve aroma integrity. For example, in August 2024, Tata Consumer Products introduced Tetley Kombucha, a lightly sparkling fermented tea drink with prebiotic fiber in Ginger Lemon and Peach variants, boosting the overall India tea market growth.
The e-auction system across Guwahati and Kolkata is rapidly improving procurement transparency. India produced approximately 1,365 million kg of tea in 2025, with Assam contributing nearly 52% of total output, followed by West Bengal at 24%. For example, CuppaTrade, launched in October 2023, is an AI & Blockchain-powered B2B e-marketplace and ClimateTech platform transforming the way tea and coffee are traded. Digitized platforms have increased interstate buyer participation. Large-scale packers now access real-time batch information, which reduces arbitrage gaps and improves forward contracting discipline. Exporters benefit from traceable bidding records which strengthens compliance documentation. This modernization is moderately reducing volatility risk during uncertain crop cycles, redefining the India tea market dynamics.
Indian tea exports are gradually recovering with stronger shipments to Russia, UAE and Iraq. Companies such as Rossell Tea are focusing on orthodox and specialty grades tailored for Middle Eastern demand. Exporters are upgrading residue testing laboratories to comply with stricter EU norms and sustainability certifications. For example, in 2023, the tea exports to UAE along with United Kingdom and Poland by Andrew Yule and Company, experienced its highest-ever growth trajectory with tea exports up by a phenomenal 431% in one year. Moreover, branded export packs with Arabic labeling are enhancing overseas shelf presence. This diversification trend significantly reduces overdependence on single geographies. Domestic CTC demand in the India tea market remains stable, yet export-led orthodox tea category’s growth is accelerating premium realization.
Mid-sized tea packers in Assam and West Bengal are investing in automated blending drums and AI based moisture detection systems. These upgrades reduce manual variability and improve flavor consistency. For example, Chai Point used AI and robotics to modernize that role, serving different varieties of chai-tea and green tea during Maha Kumbh Mela in 2025. Government-backed modernization schemes are moderately supporting machinery replacement. Automated pouch filling lines and QR coded traceability labels are becoming common among organized suppliers, opening up new India tea market opportunities.
| Segment | Sub Segment |
|---|---|
| Type | Black, Green, Oolong, White, Others |
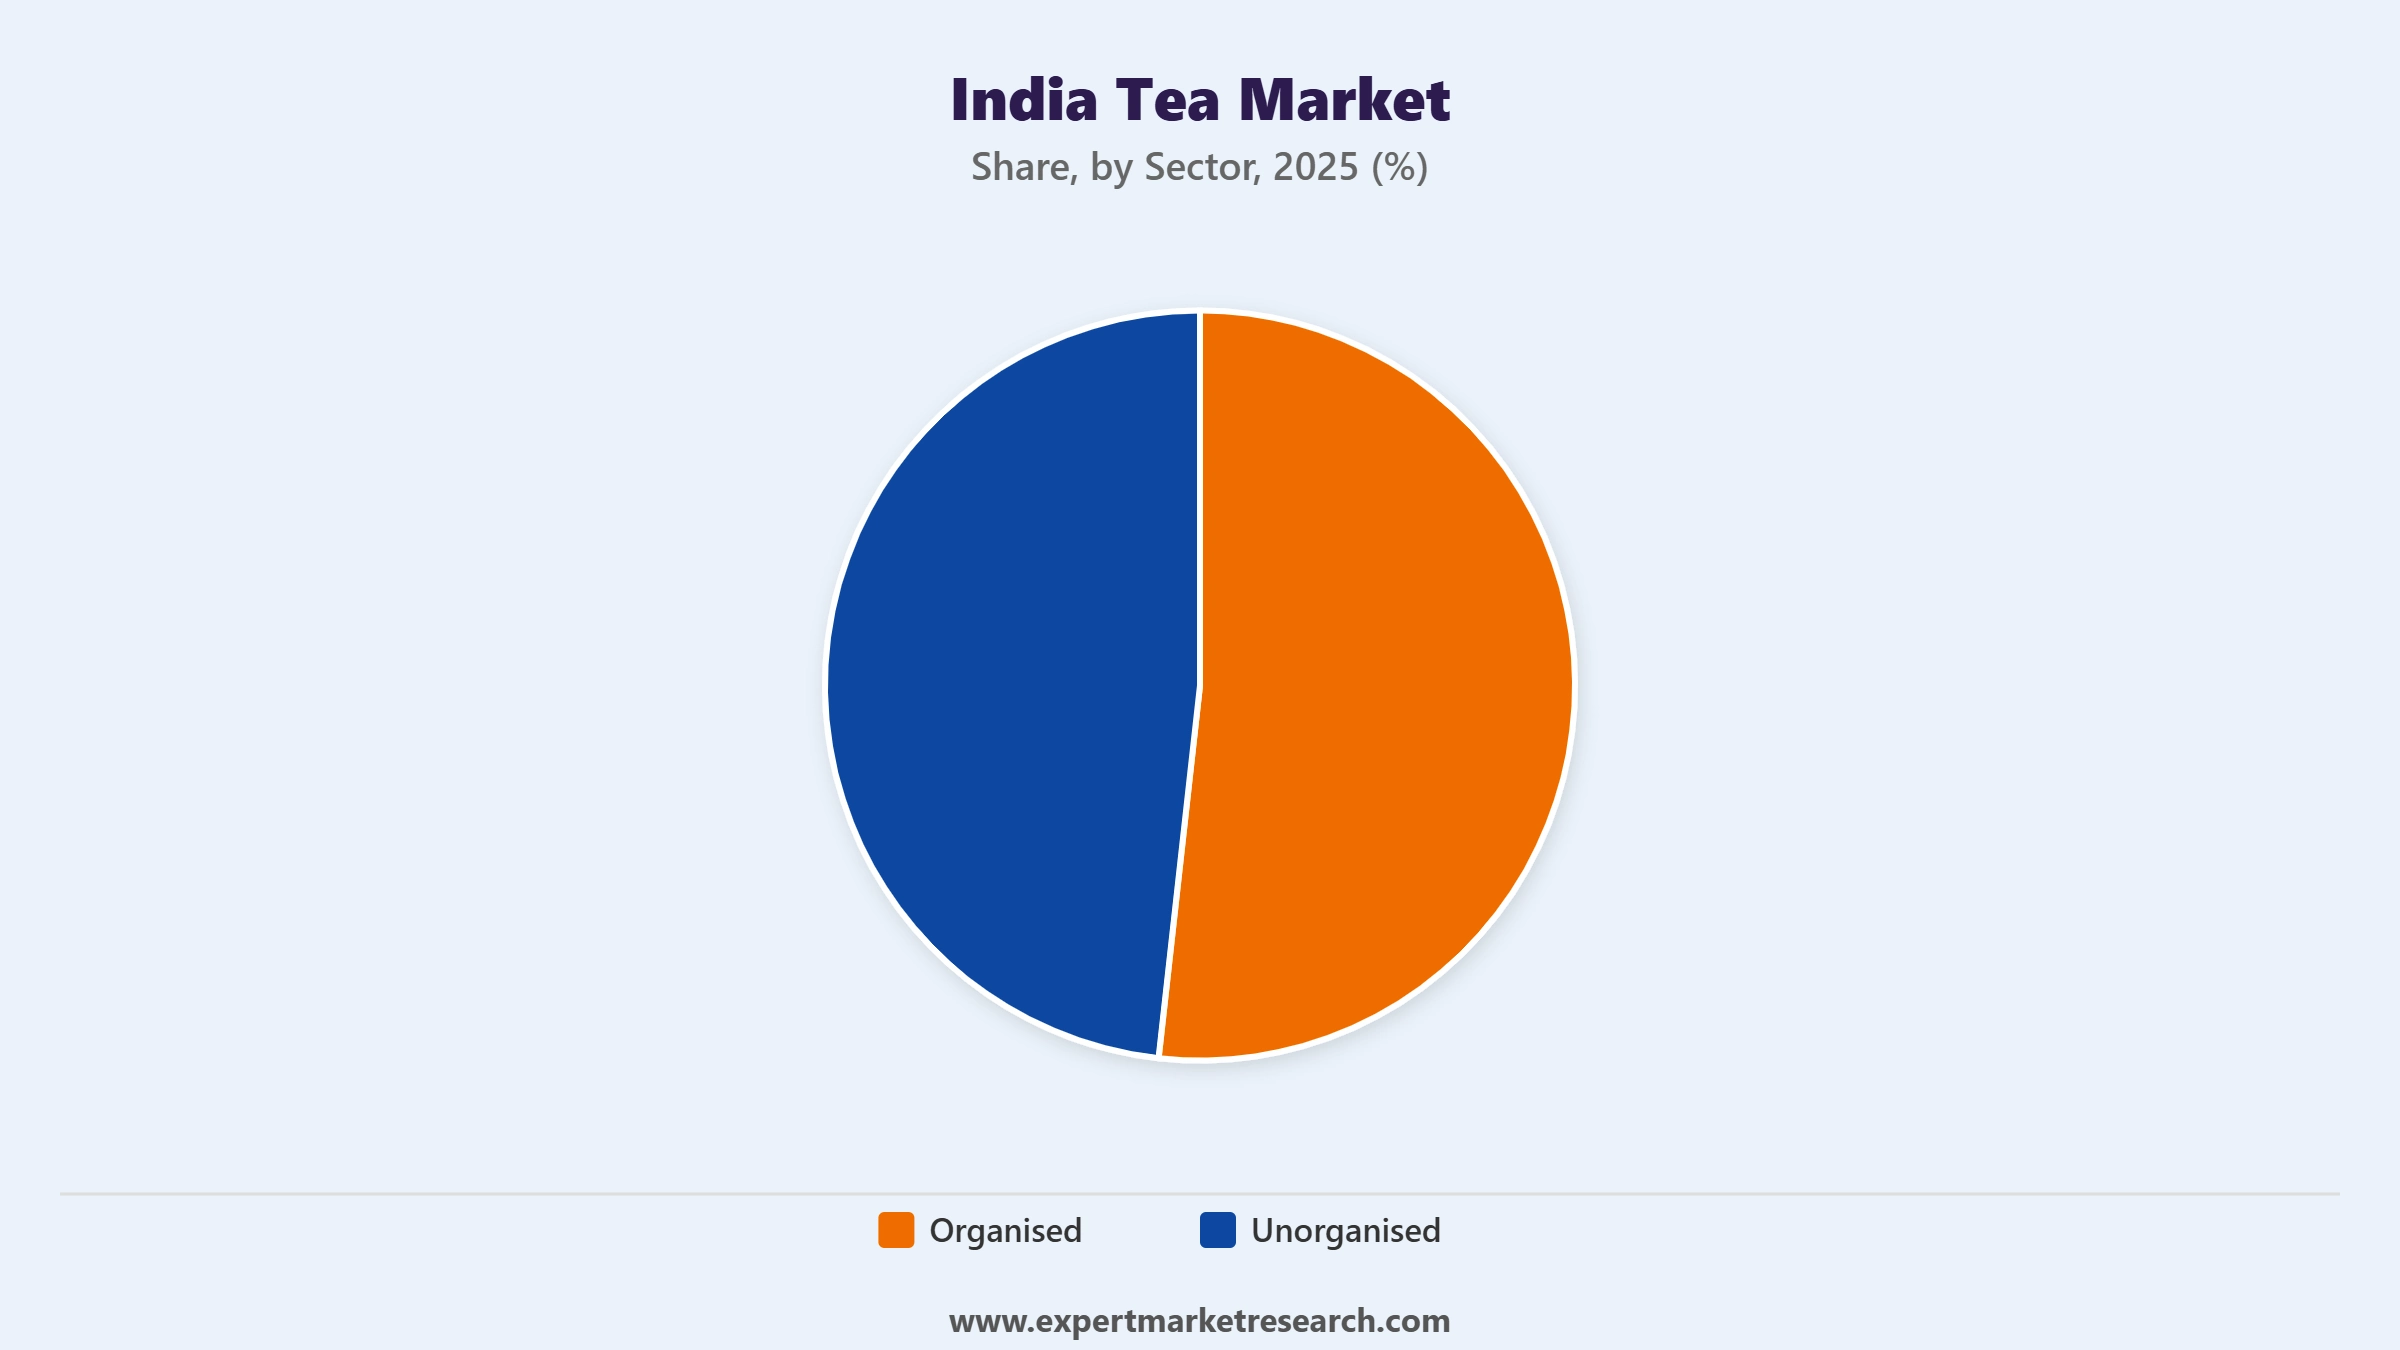
| Sector | Organised, Unorganised |
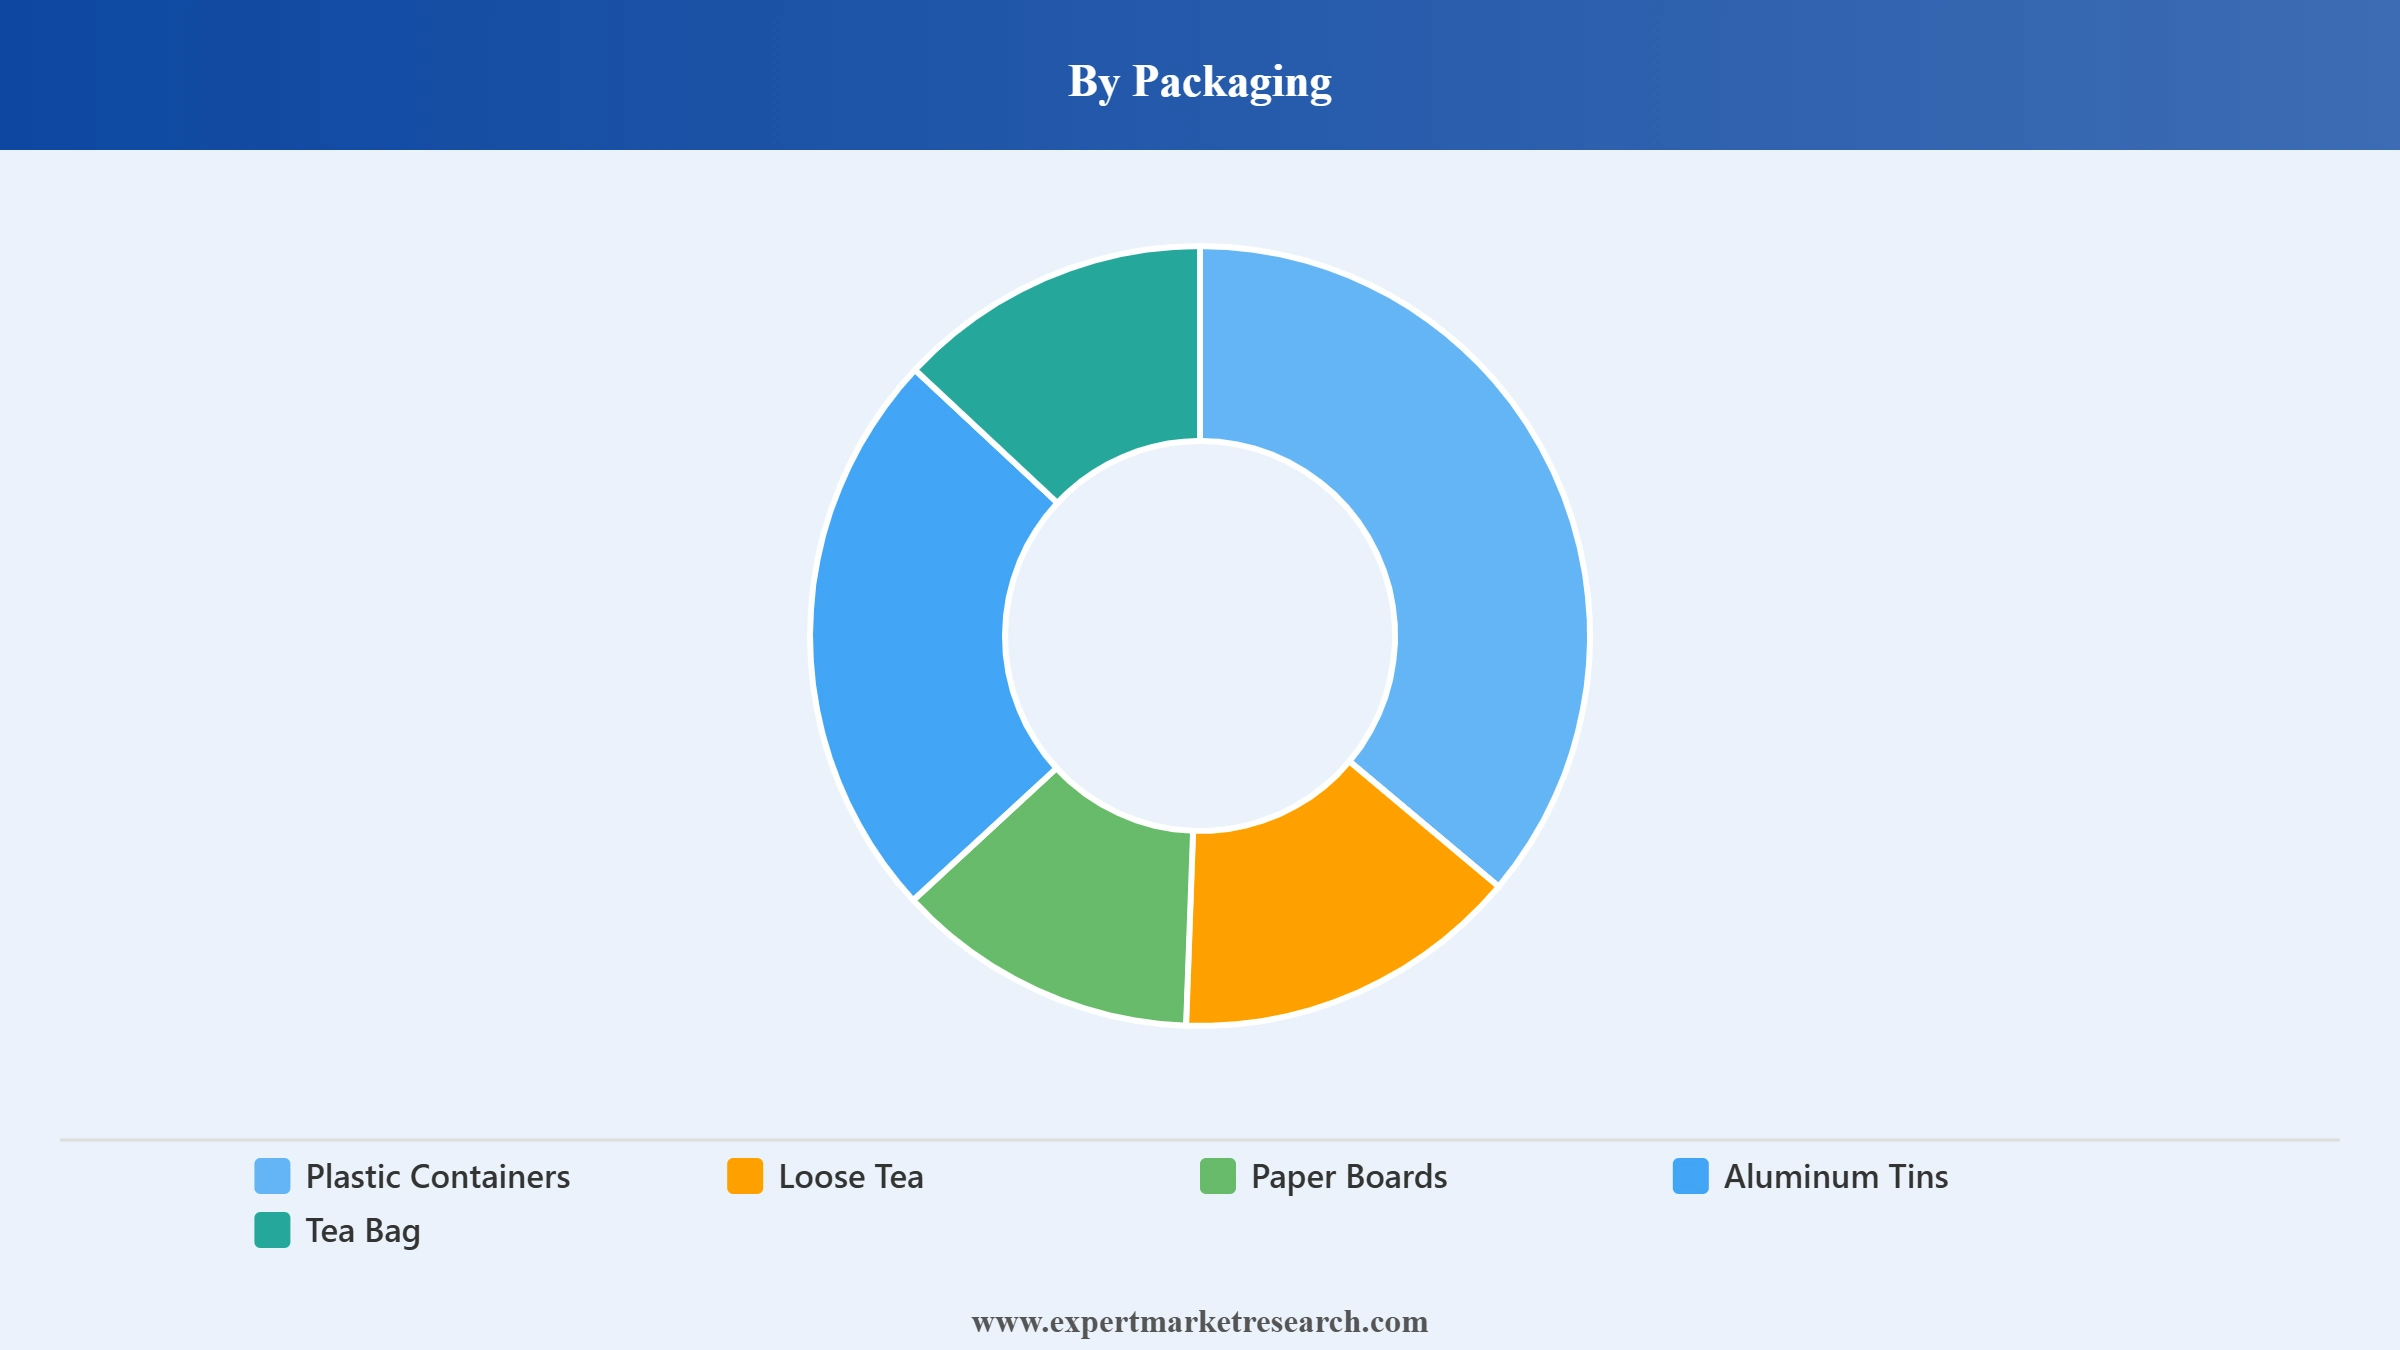
| Packaging | Plastic Containers, Loose Tea, Paper Boards, Aluminium Tins, Tea Bags, Others |
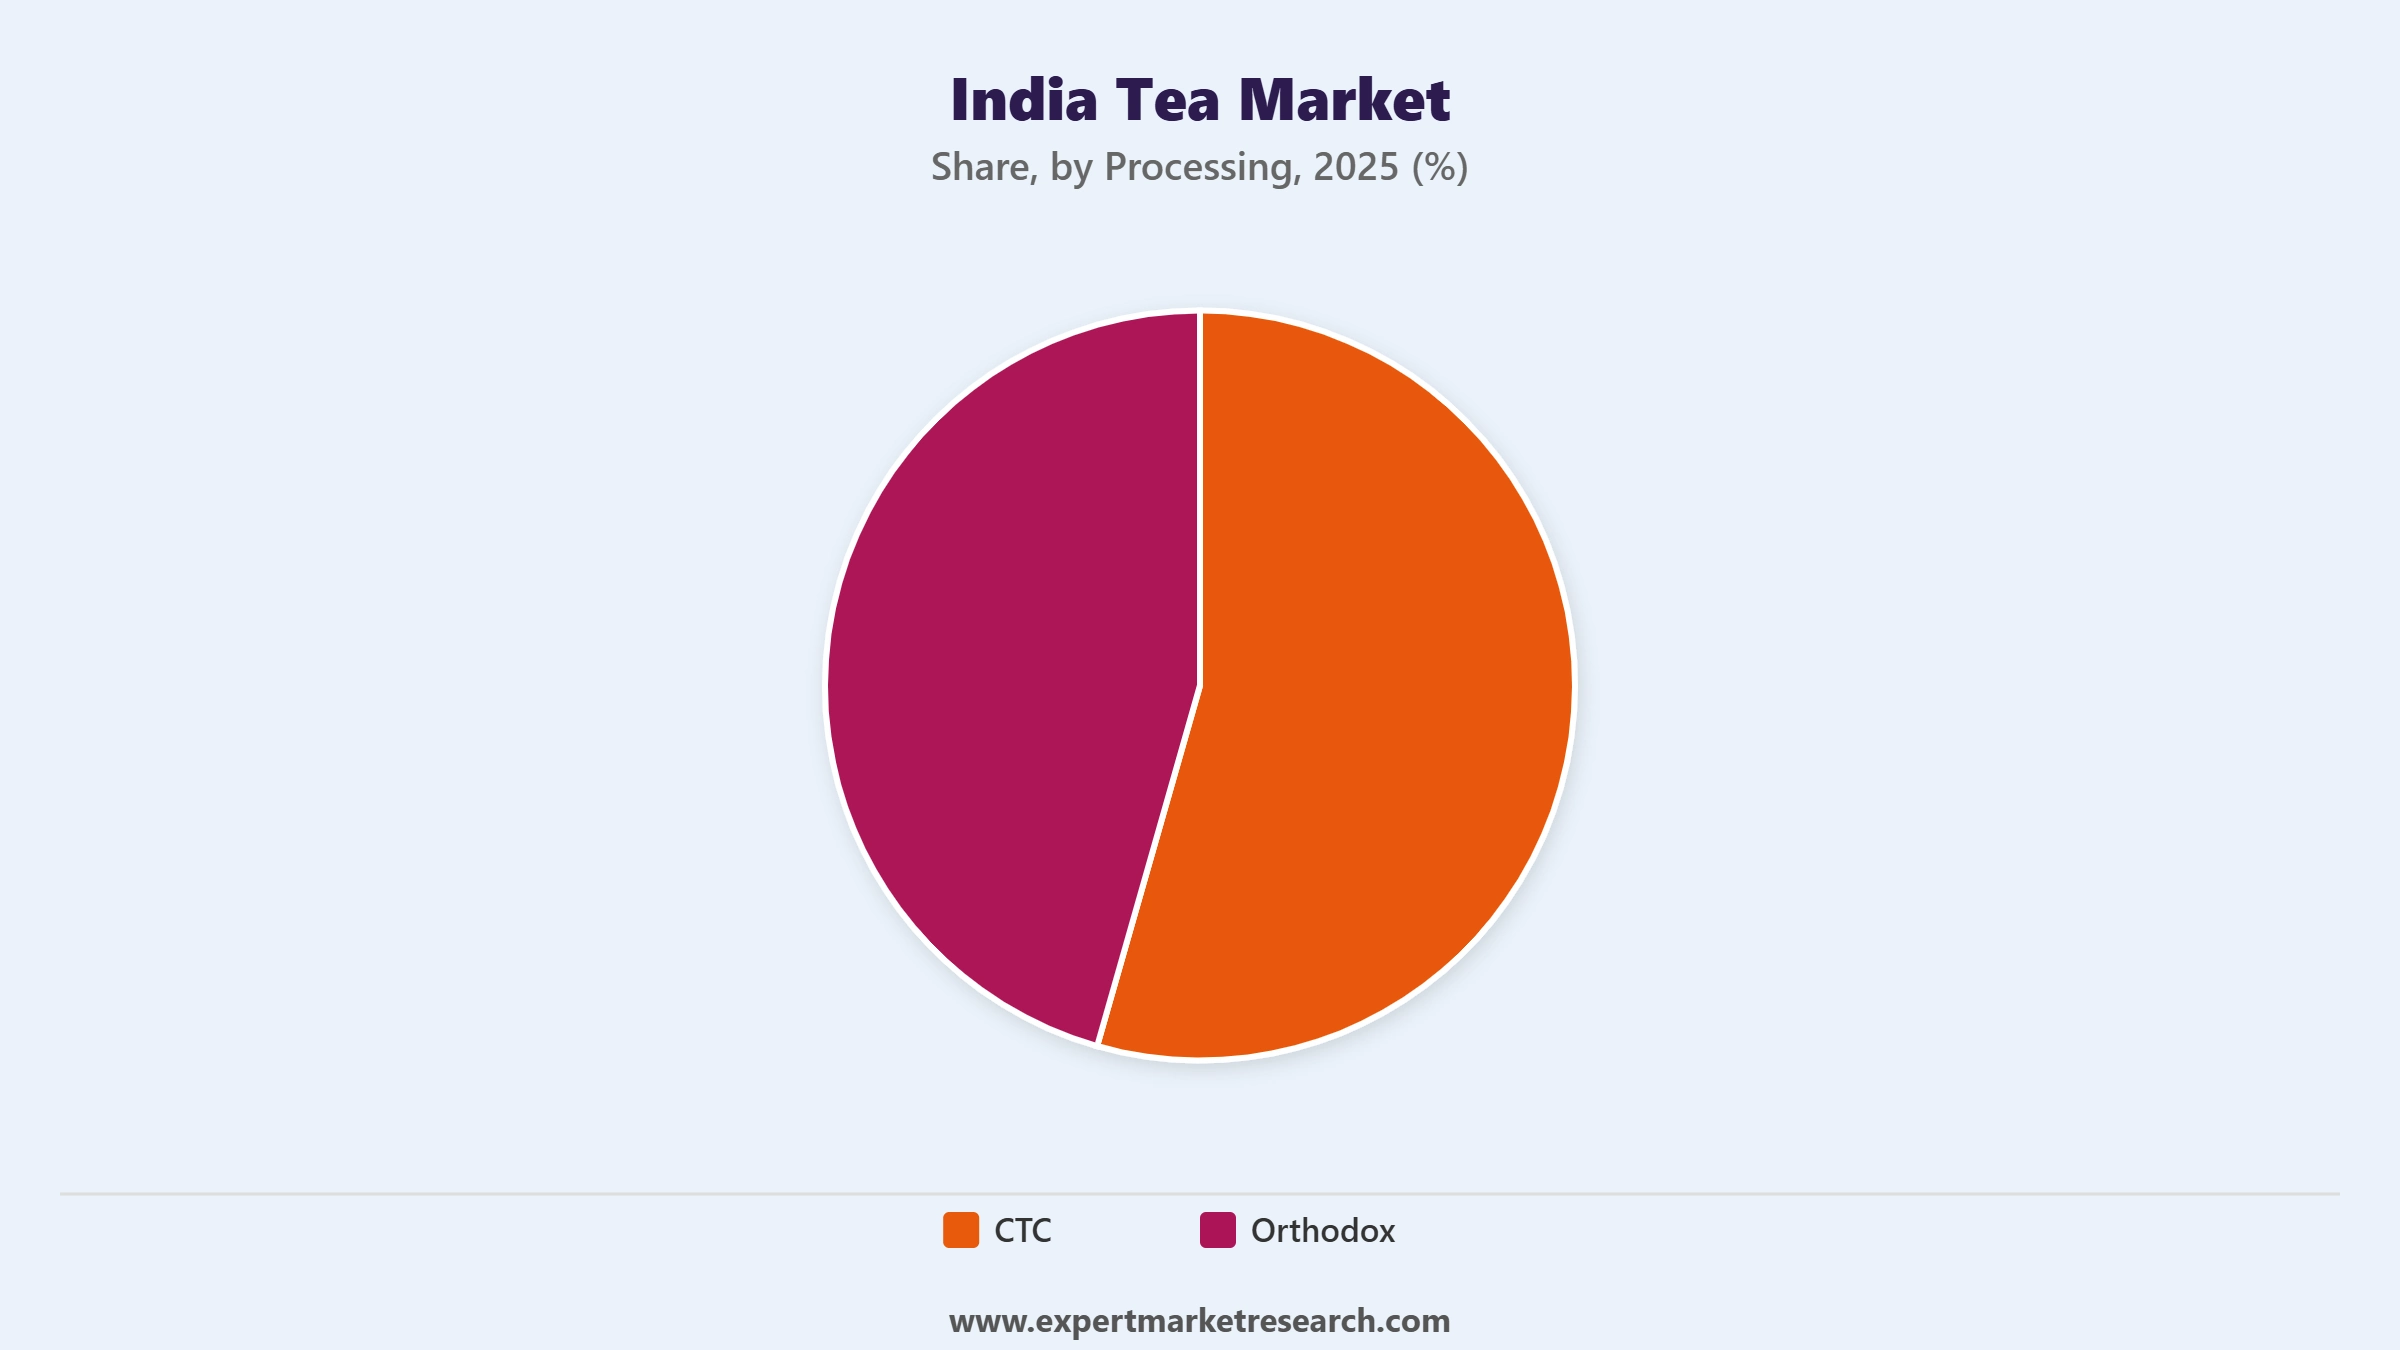
| Processing | CTC, Orthodox (Traditional) |
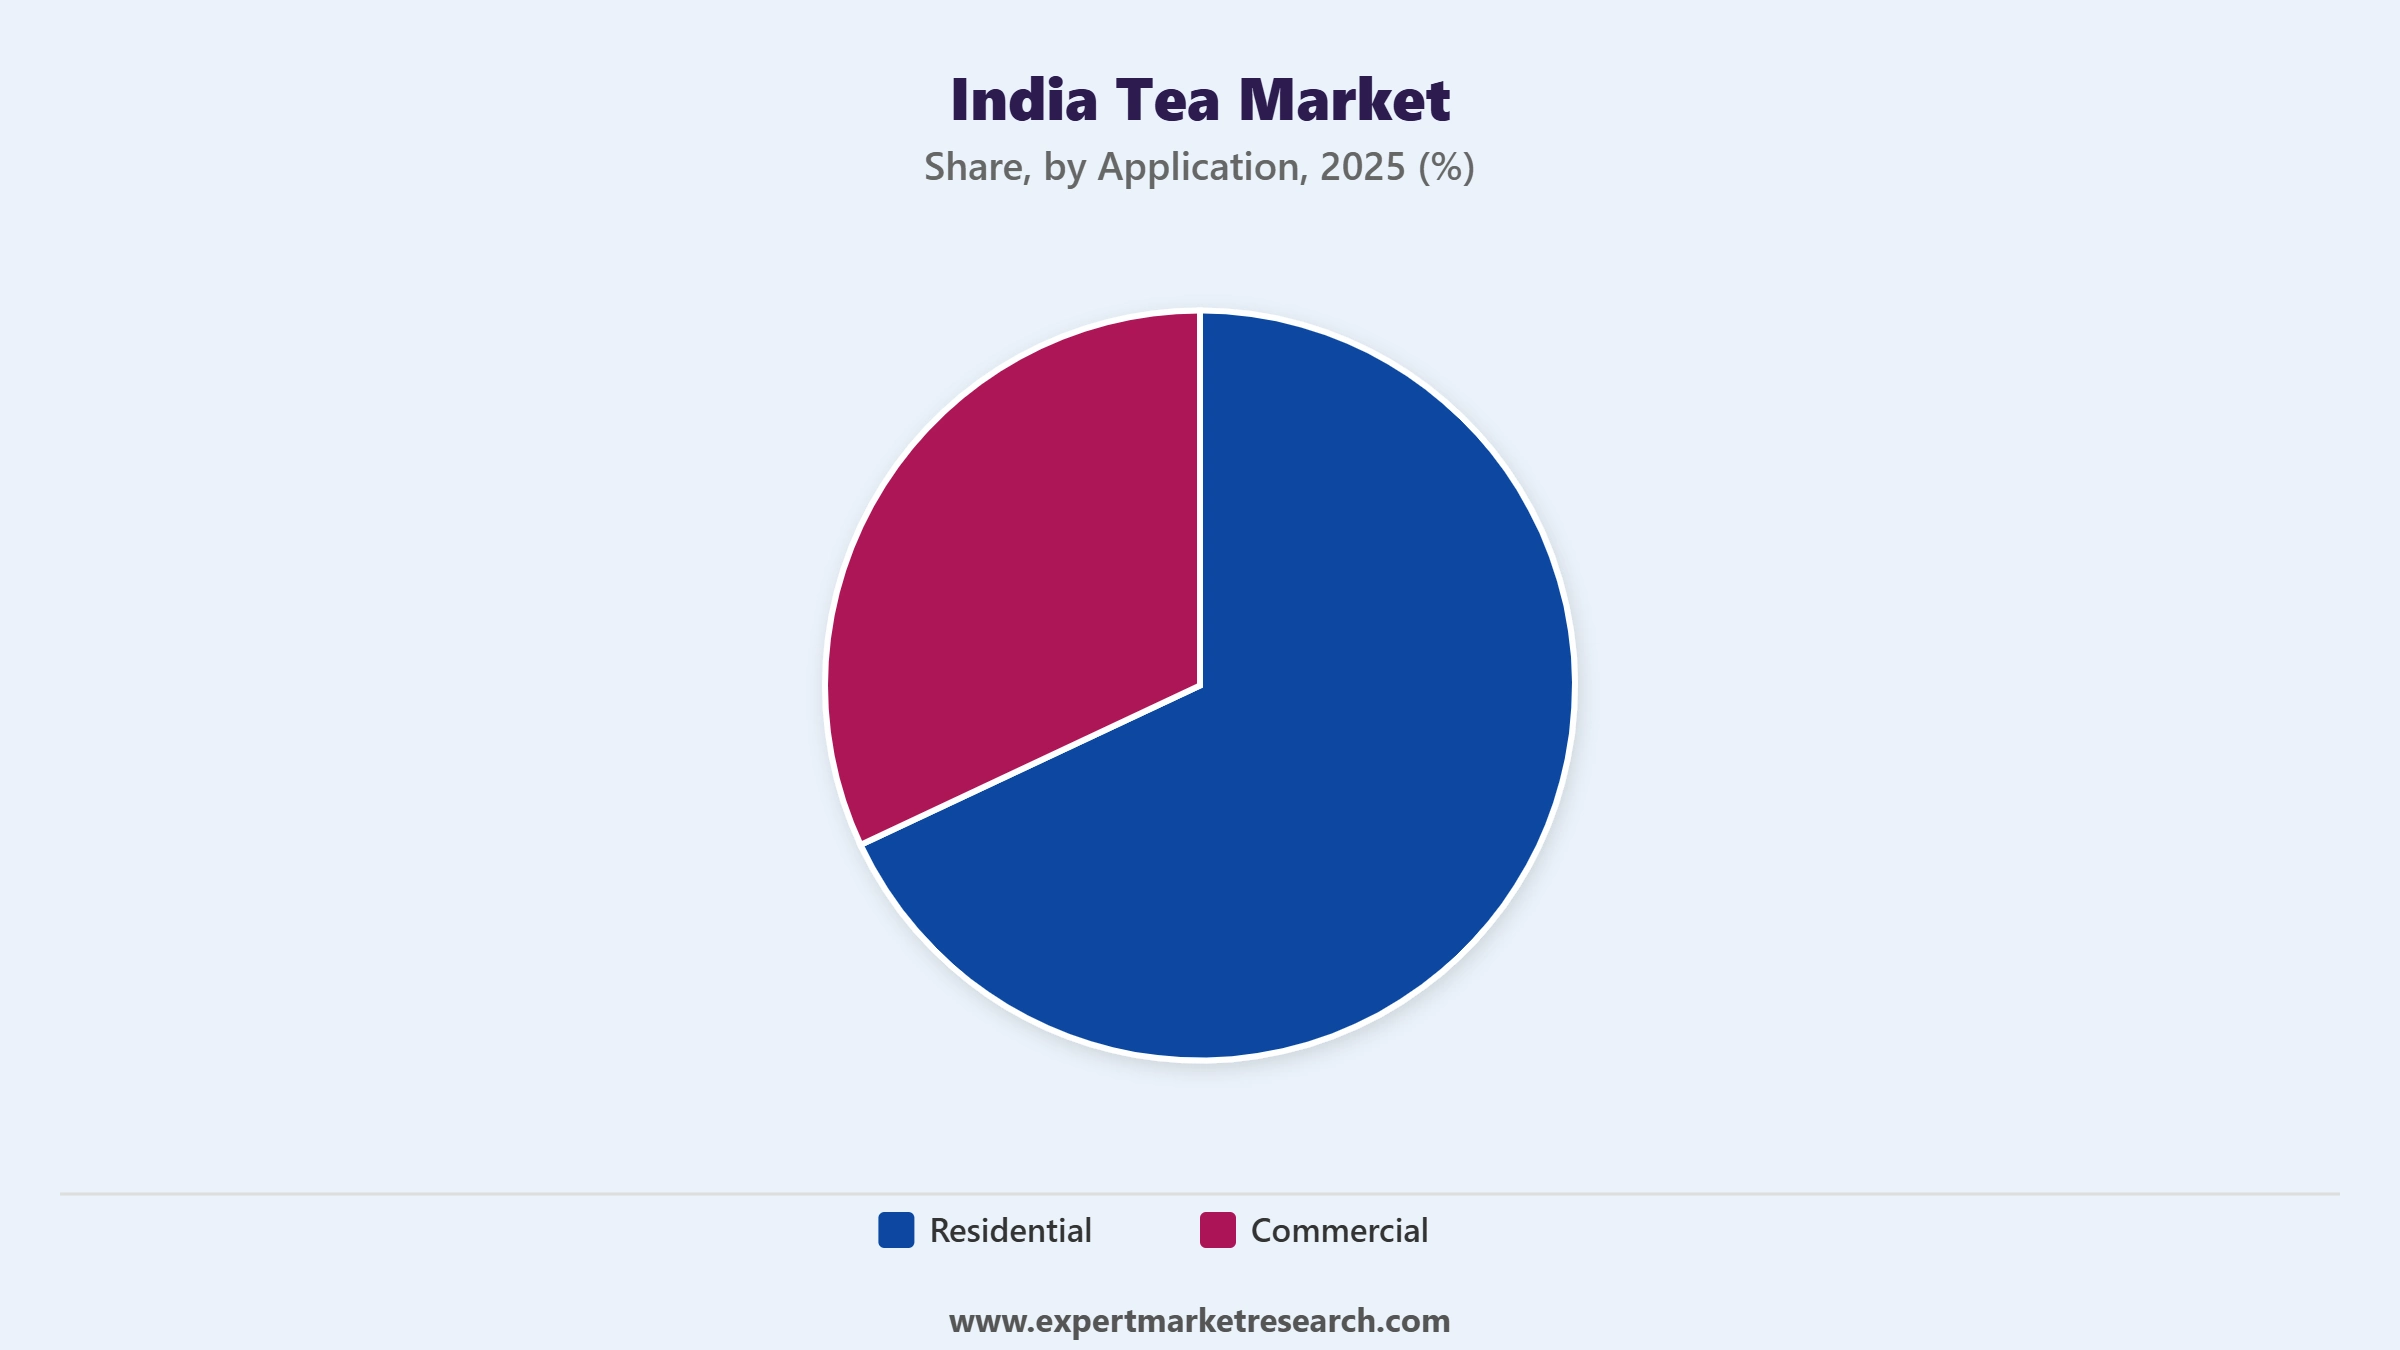
| Application | Residential, Commercial |
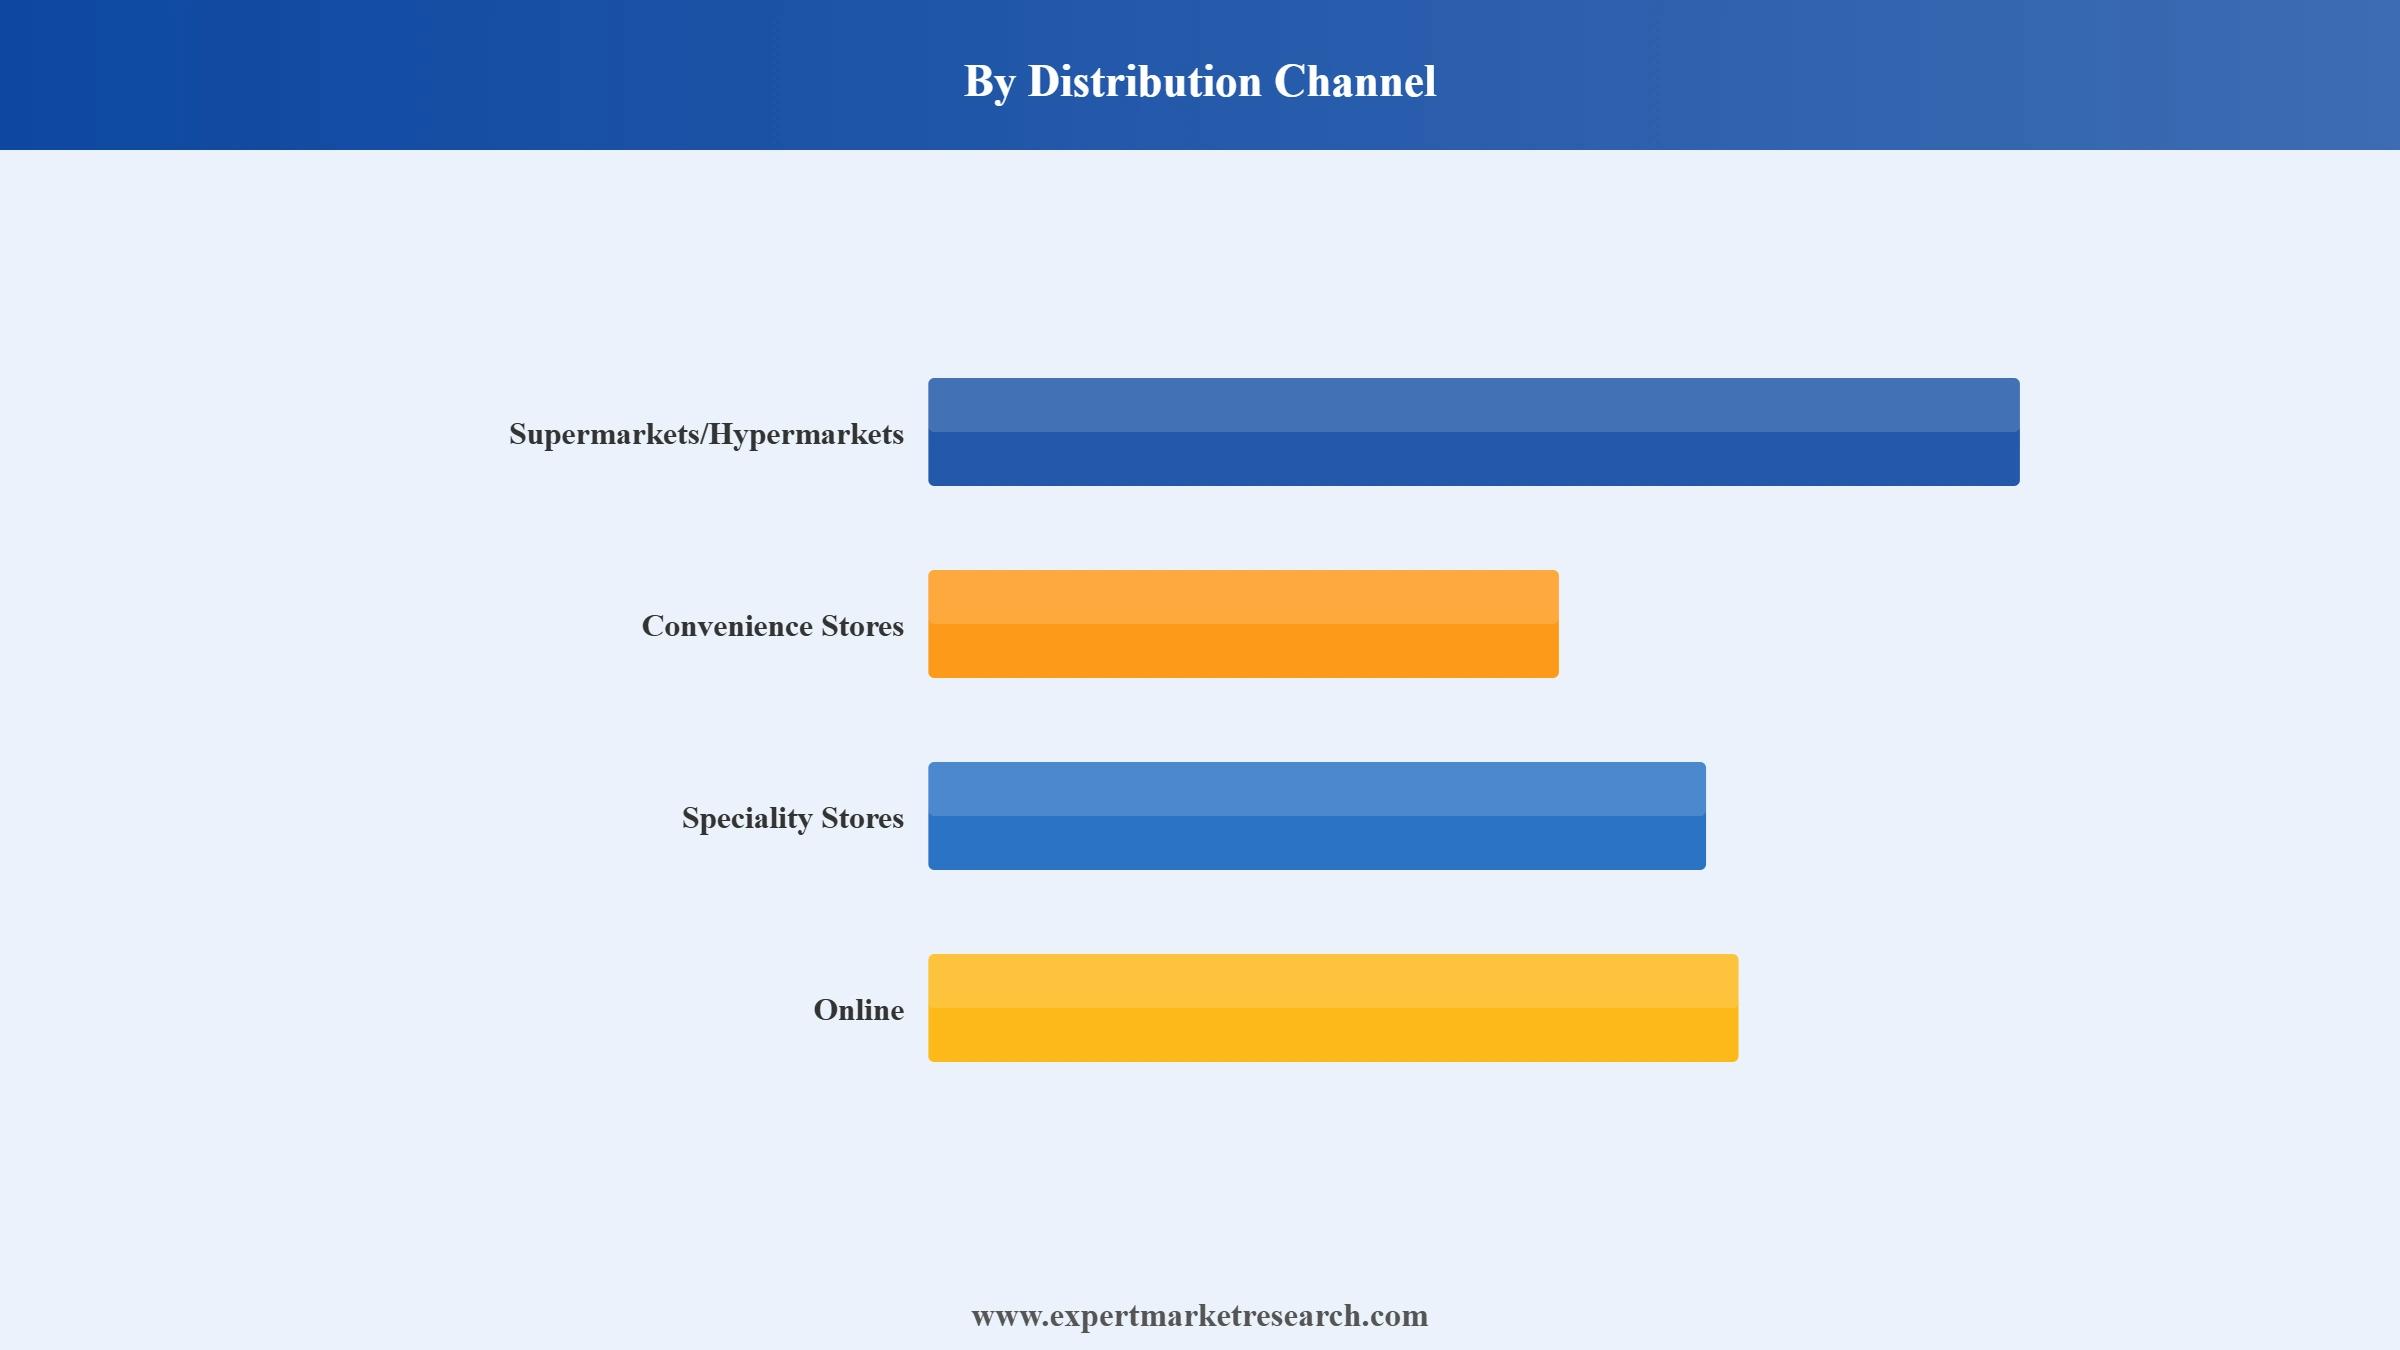
| Distribution Channel | Supermarkets/Hypermarkets, Convenience Stores, Specialty Stores, Online, Others |
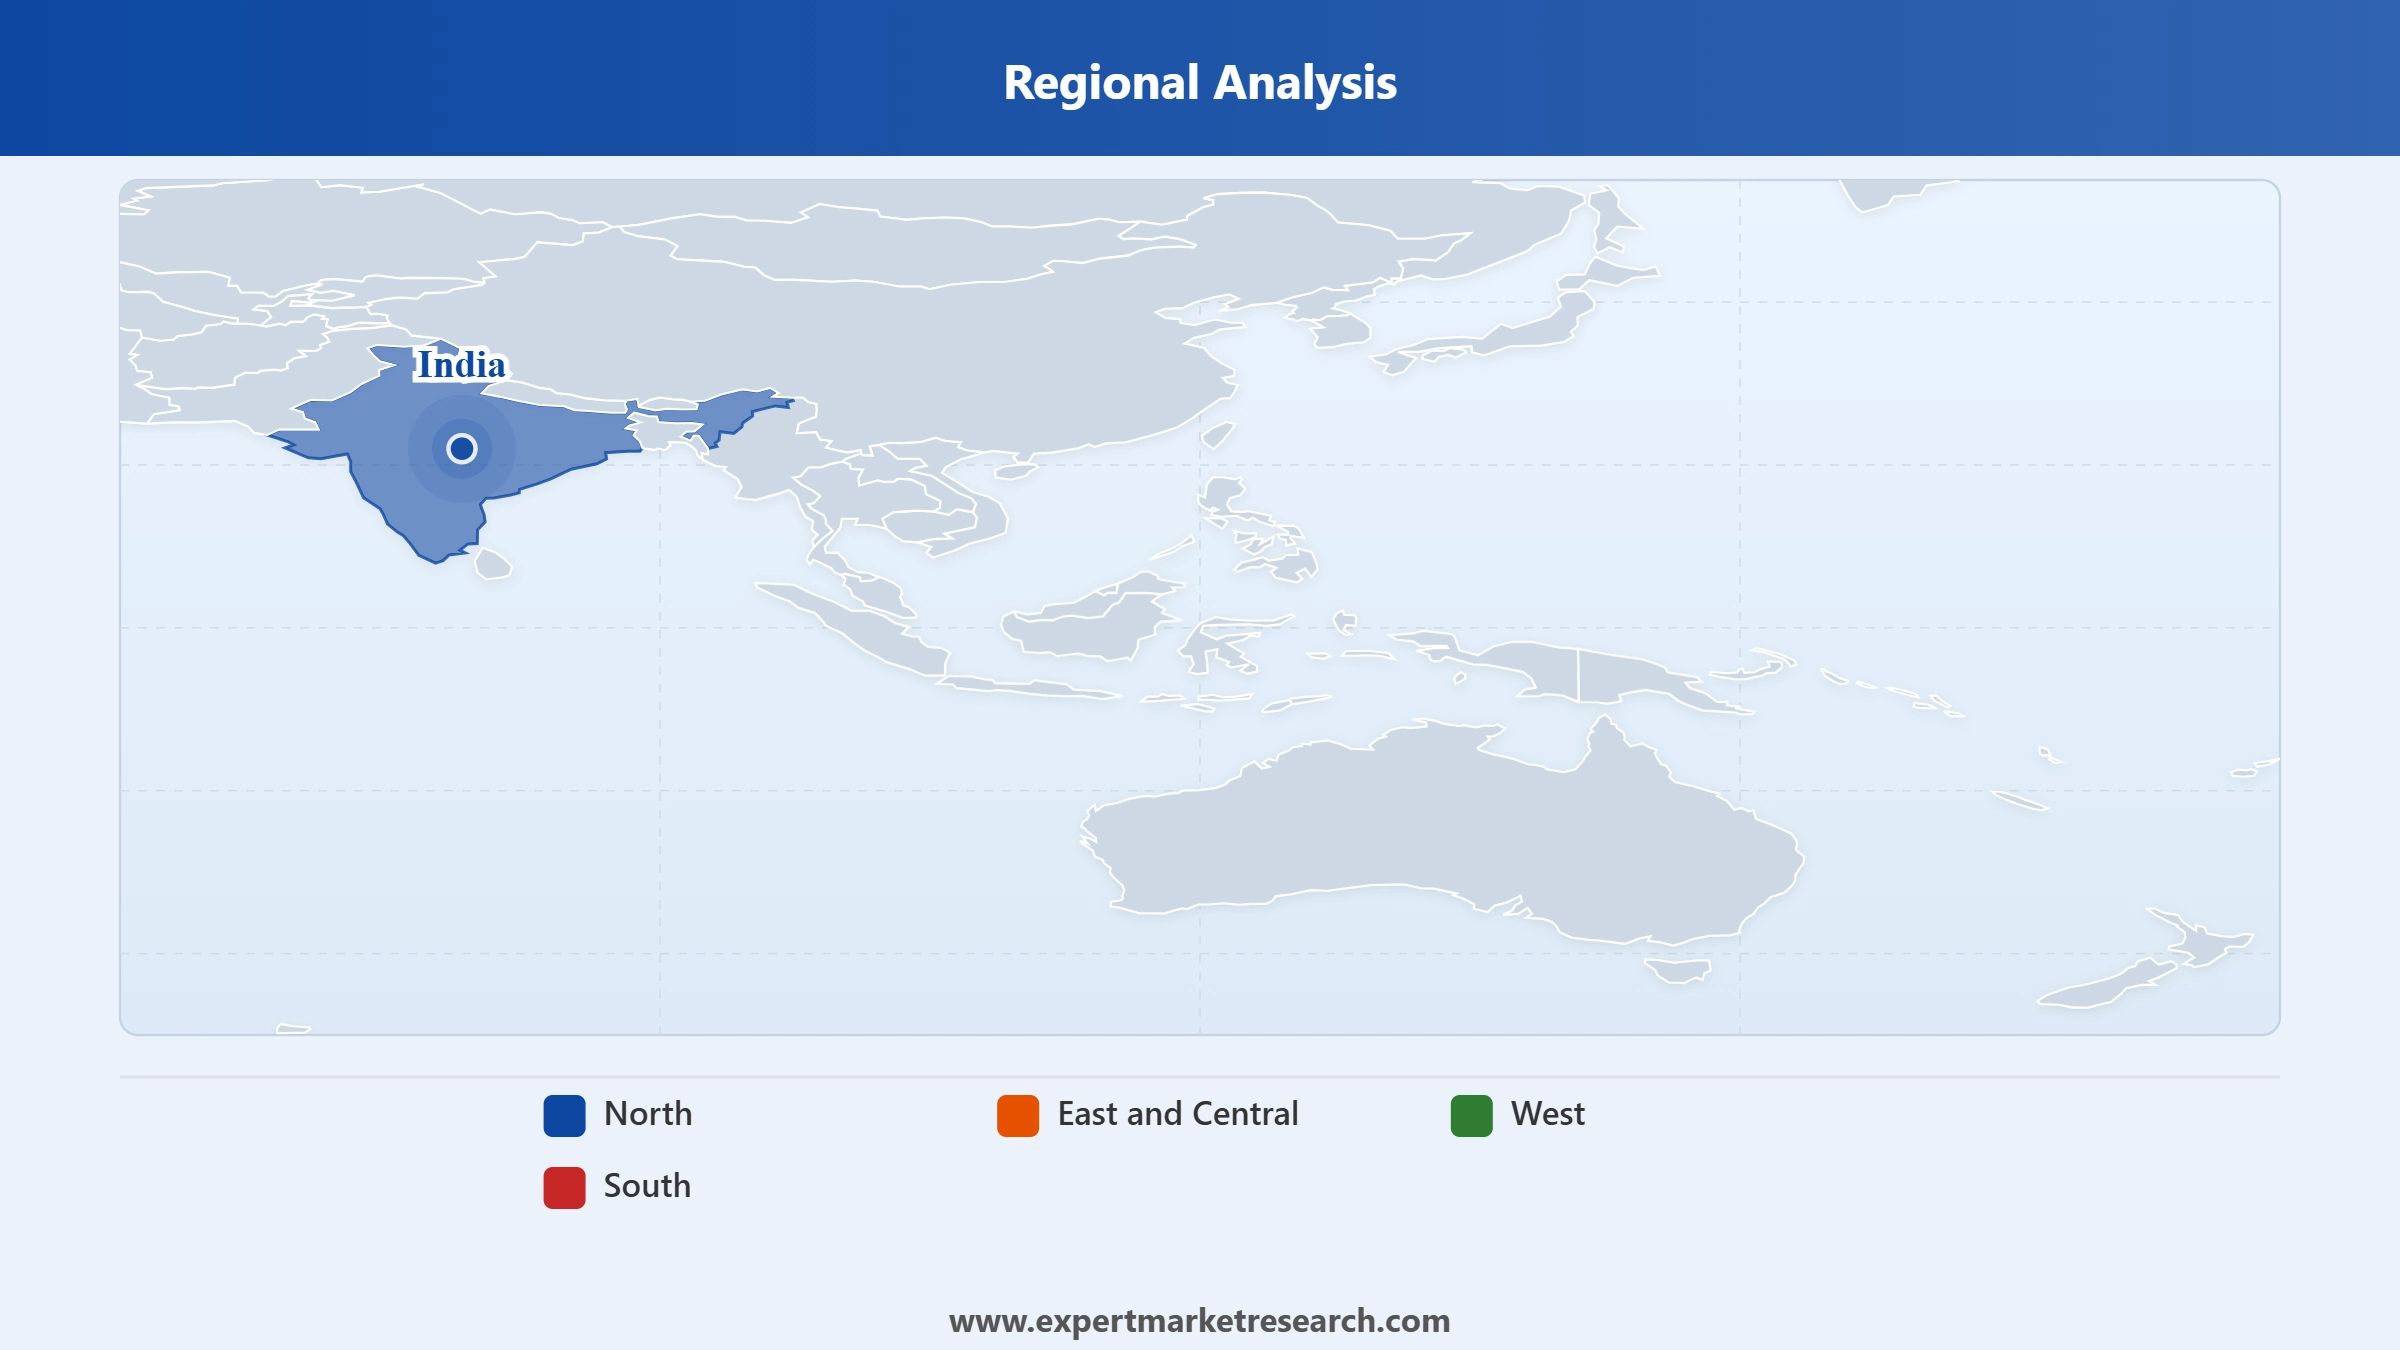
| Region | North Region, East and Central Region, West Region, South Region |
The Expert Market Research report titled “India Tea Market Report and Forecast 2026-2035” offers a detailed analysis of the market based on the following segments:
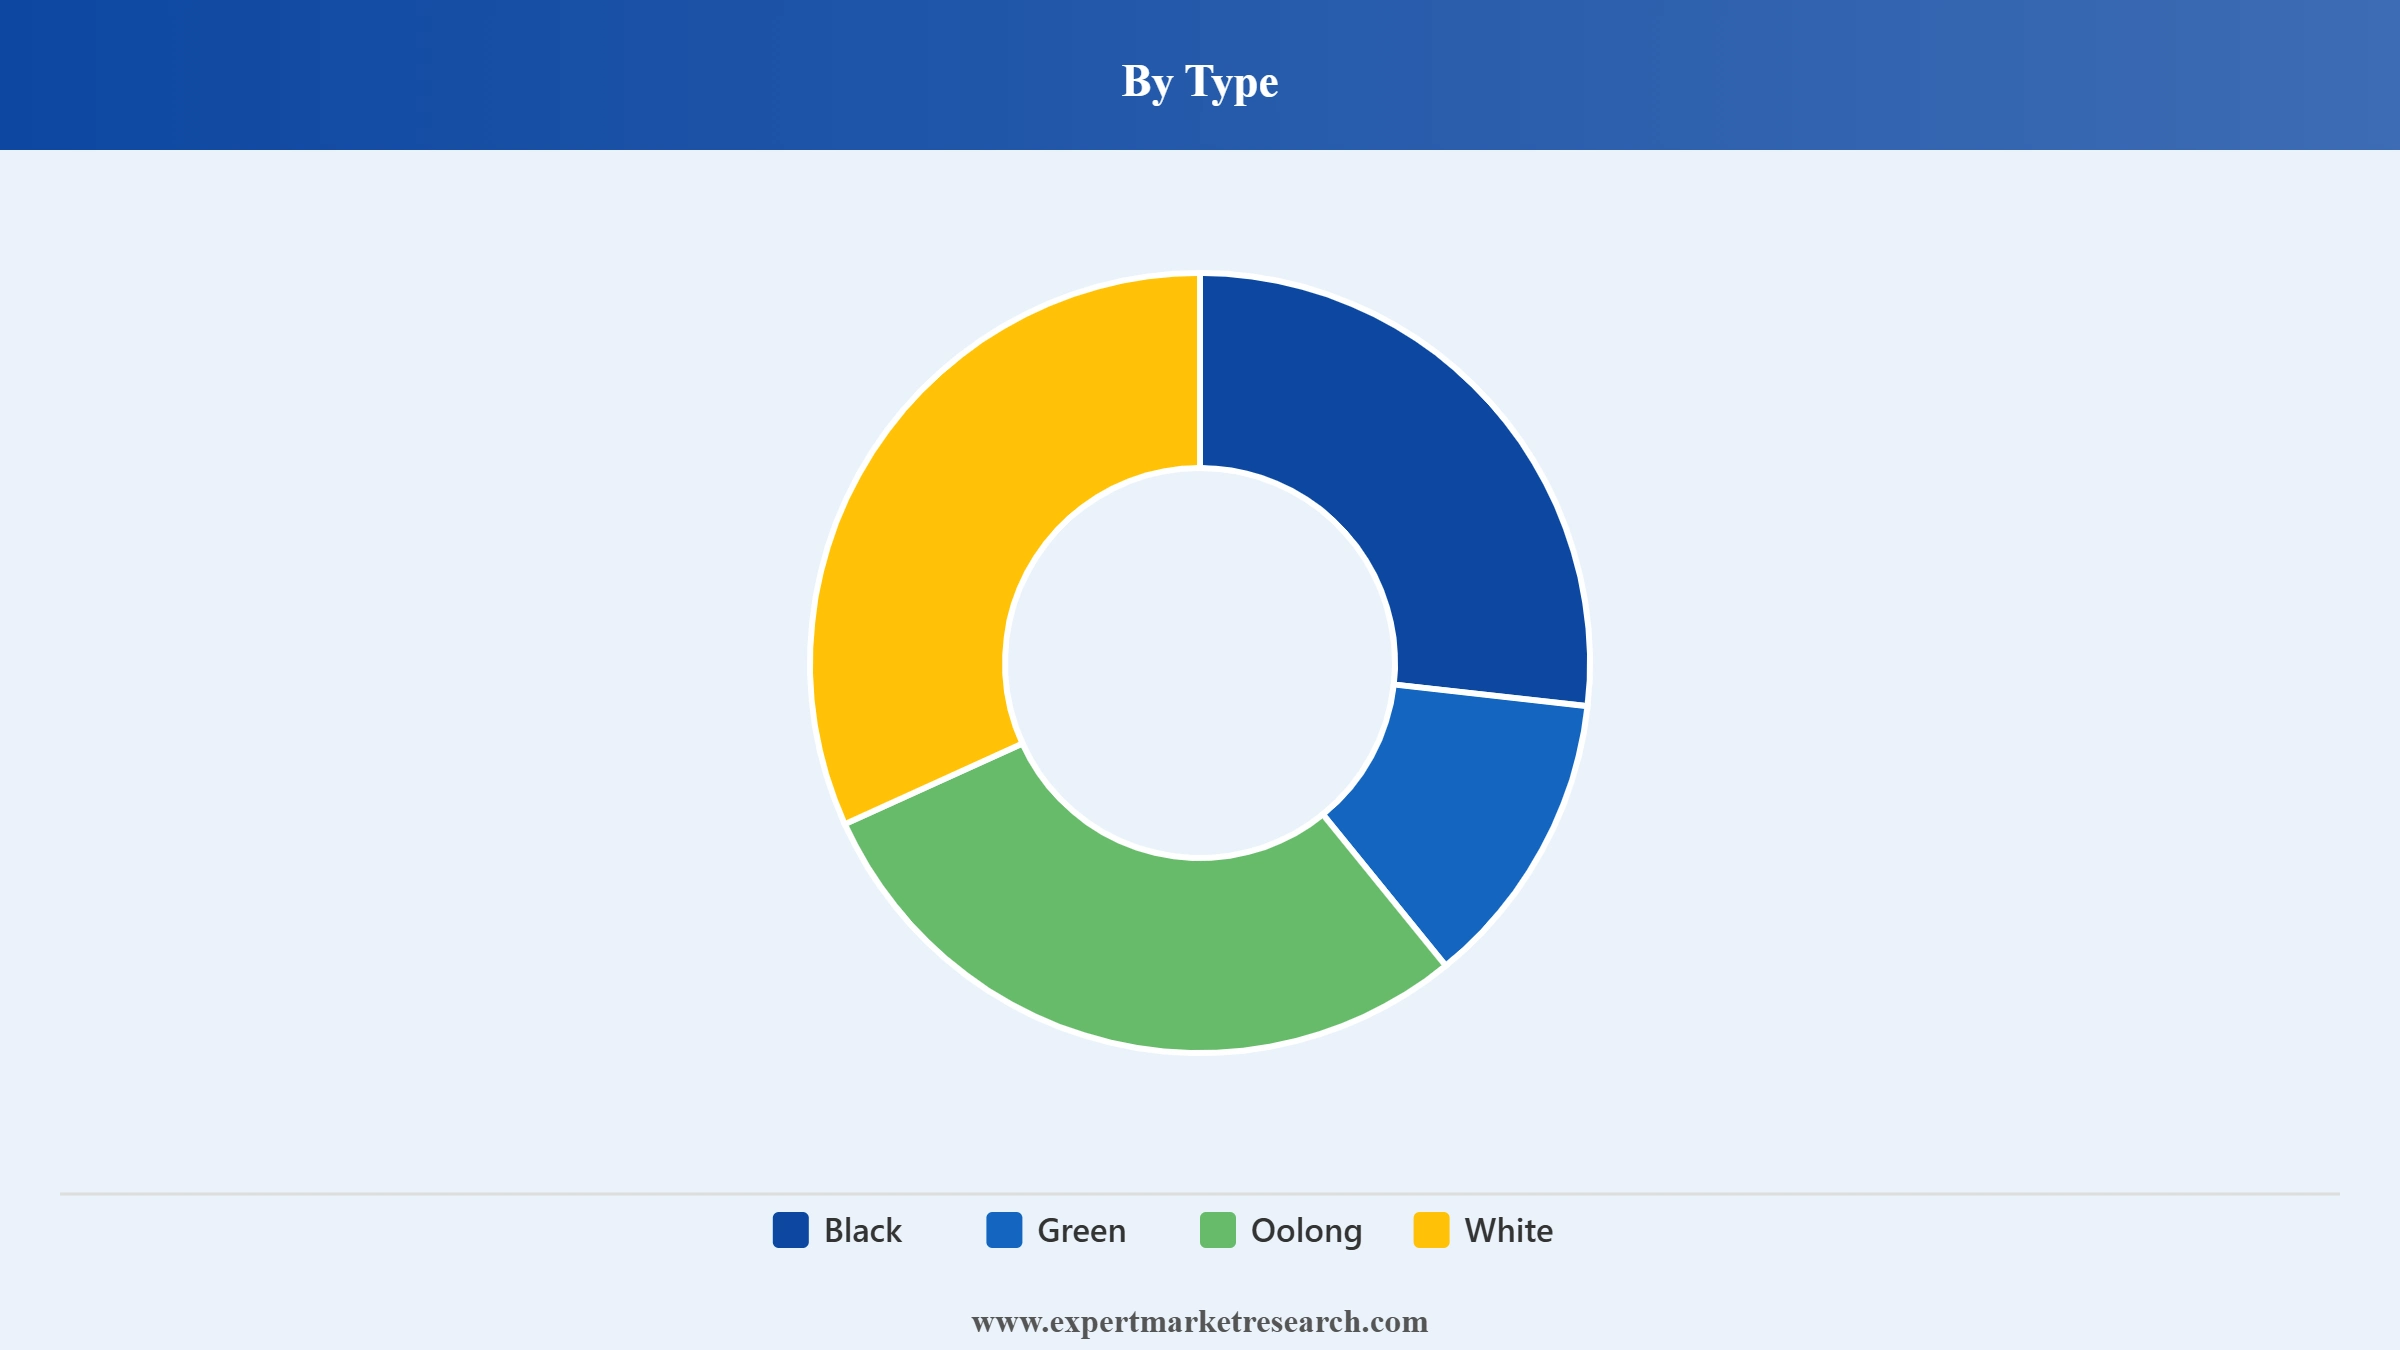
Market Breakup by Type
Key Insight: Black tea leads the India tea demand growth because of habit driven demand and institutional procurement depth. Green tea grows at a much faster pace as brands push functional and flavored formats. In September 2025, the Tea Research Association (TRA) launched a decaffeinated green tea powder, developed from Assam's elite clones, to rival Japanese Matcha. Oolong and white teas remain niche but command premium positioning in specialty stores and export channels. These lighter variants attract affluent urban consumers seeking differentiated taste experiences. Others category including herbal infusions overlaps with wellness beverages and widens consumer entry points.
Market Breakup by Sector
Key Insight: Organized players dominate the India tea market through branding capacity, distribution scale and quality assurance systems. On the other hand, unorganized operators capture greater market shares through cost agility and localized taste calibration. Both segments coexist because consumer bases vary widely across India. Premium urban buyers lean toward branded packs, while rural and semi-urban consumers often prioritize affordability and familiarity.
Market Breakup by Packaging
Key Insight: As per the India tea market report, plastic containers continue to dominate the industry due to durability and cost efficiency. Loose tea remains relevant in traditional retail and wholesale markets where consumers value visible leaf inspection. Paper boards serve mid-range carton packs in supermarkets. Aluminum tins target premium gifting and export markets. Tea bags grow rapidly popular because of convenience and portion control benefits. In June 2023, Gujrat-based premium tea brand, Seven Spring introduced India's first-ever 100% compostable tea bag sachets with zero plastic and aluminum foils.
Market Breakup by Processing
Key Insight: CTC continues to anchor majority of the surging demand in the India tea market due to compatibility with milk tea culture and high output efficiency. Orthodox processing gains momentum as exporters and premium brands seek differentiated leaf character. Both processing styles fulfill different market logic. CTC secures domestic volume stability, meanwhile, orthodox processing enhances global positioning and premium storytelling.
Market Breakup by Application
Key Insight: Residential demand anchors stability through habitual daily consumption, while the commercial demand in the India tea market grows with hospitality and institutional expansion. Households seek affordability and consistent taste. Commercial buyers prioritize standardization and supply reliability. Companies that design differentiated SKUs for both settings are creating diversified revenue streams. The dual channel strategy reduces overdependence on one consumption base.
Market Breakup by Distribution Channel
Key Insight: Supermarkets dominate through scale and visibility, meanwhile convenience stores sustain neighborhood accessibility especially in semi urban zones. Specialty stores cater to premium and loose leaf tea consumers. The online mode of distribution is expanding its share in the India tea market revenue by enabling discovery and subscription commerce. Other channels such as wholesale mandis support bulk trade. A balanced channel strategy improves resilience against localized disruptions. Brands increasingly customize pack sizes and pricing depending on channel economics.
Market Breakup by Region
Key Insight: The northern part of India leads through strong daily consumption habits, while East and Central regions benefit from proximity to production belts and auction centers. Northern states in India, characterized by high consumption in regions like Delhi, Punjab, Uttar Pradesh, and Haryana, consume approximately 391.5 million kgs of tea annually, accounting for about 33% of the total domestic consumption. The India tea markets in the west shows balanced demand across urban and rural clusters, while the southern region grows steadily with premium experimentation and urbanization. Companies that localize blends and marketing strategies across states achieve stronger competitive positioning in the market.
Get a sample of the market report in PDF – Request a free sample
By type, black tea registers the dominant share of the market due to strong daily consumption
Black tea continues to anchor the India tea market growth because it fits mass taste preference and price sensitivity. CTC-based black blends are deeply embedded in household consumption patterns across urban and rural belts. Large-scale branded players focus on regional taste calibration. Companies are investing in leaf blending technology to maintain color and liquor strength consistency. Institutional buyers such as railways and canteens also prefer black CTC for cost control. The scale advantage allows national brands to negotiate bulk procurement contracts. It may look traditional, but formulation tweaks and aroma locking processes are improving margins for branded suppliers. In October 2025, CSIR-NEIST in Jorhat introduced India’s first decaffeinated black tea using local technology, expanding healthier options in the conventional tea segment.
Green tea is expanding its share in the India tea market scope because of growing urban experimentation. Companies are adding tulsi, moringa, ginger extracts and functional botanicals to justify premium pricing. Organized brands are redesigning packaging into pyramid bags and portion-controlled sachets to attract younger buyers. E-commerce channels are also amplifying the discovery of flavored green teas. Hotels and corporate offices are adding green tea dispensers as part of wellness programs. Export-oriented firms are also leveraging Japanese style steaming techniques to diversify offerings.
Read more about this report – Request a free sample copy in PDF
Organized sector continues to account for the dominant share of the market due to brand trust and scale
The organized sector commands stronger shelf visibility and distribution depth across India. National brands invest heavily in advertising, packaging innovation, and supply chain automation. Their advantage lies in consistent quality control and multi-state sourcing networks. Modern retail chains prefer dealing with organized suppliers who can ensure uniform batch specifications. Companies are also introducing regional sub brands to penetrate Tier II markets without diluting flagship labels. In February 2025, TRIFED partnered with Tea Trunk to expand tribal tea products into mainstream retail and provide skill development for tribal producers.
The unorganized segment represents the fastest-growing sector within the India tea market scope, boosted by hyper local blending and aggressive pricing strategies. Small-scale packers often customize flavor intensity to match specific district preferences. In rural markets and small town kirana stores, these players hold strong influence. Some are gradually formalizing operations by adopting basic packaging machinery and GST compliance. This segment expands quickly in price sensitive clusters where national brands cannot adjust fast enough.
Read more about this report – Request a free sample copy in PDF
By packaging, plastic containers capture a substantial market share due to durability and storage ease
Plastic containers remain dominant for bulk household storage and refill packs. Large-scale FMCG companies supply value packs designed for monthly consumption cycles, accelerating the India tea market revenue growth. The material prevents moisture ingress and protects aroma stability. Modern trade outlets prefer stackable plastic jars for shelf efficiency. Institutional buyers such as offices and catering services also procure large plastic units to reduce handling costs. Companies are now shifting toward recyclable grade plastics to address sustainability concerns.
Tea bags are witnessing faster consumption, particularly in urban households and corporate offices. Brands are upgrading to pyramid shaped mesh or cotton bags that allow better infusion. Green and specialty teas rely heavily on this format. Hospitality chains standardize tea bag sourcing to ensure consistent guest experience. Export markets also favor individually wrapped bags for hygiene compliance. Companies are experimenting with biodegradable sachets to align with sustainability goals of the country. In July 2024, Esah Tea, a direct-to-consumer (D2C) tea brand from Assam, launched the world's first microplastic-free cotton tea bags.
Read more about this report – Request a free sample copy in PDF
CTC processing registers the largest share of the market due to mass market compatibility
CTC processing underpins India’s high volume black tea supply. The crush tear curl technique produces granular particles that are ideal for strong liquor and quick brewing. This aligns with milk-based tea consumption habits. Large-scale packers rely on CTC for blending uniformity and color consistency. CTC teas suit auction trade dynamics and institutional procurement. Though perceived as a commodity, the process efficiency ensures steady output. The procedure’s reliability keeps CTC at the center of mainstream packaged tea portfolios. In October 2025, Nagaland’s Atoqa Tea Factory introduced Nagaland Gold CTC Black Tea, highlighting regional high-elevation taste profiles and local estate branding.
Orthodox processing is gaining momentum across the India tea market dynamics due to export diversification and specialty retail growth. The traditional rolling method preserves leaf structure and nuanced aroma. Middle Eastern and European buyers prefer orthodox grades for loose leaf formats. Indian estates are improving withering and fermentation controls to enhance cup profile consistency. Meanwhile, domestic premium brands are launching single estate orthodox lines for urban connoisseurs.
Read more about this report – Request a free sample copy in PDF
Residential applications continue to dominate the market due to habitual daily consumption
Residential consumption drives the majority of tea demand in India. Daily morning and evening rituals sustain steady purchase cycles. Brands focus on affordable refill packs and family sized SKUs to secure loyalty. Regional taste adjustments remain critical. Companies analyze local water hardness and milk ratios while designing blends. Subscription-based home deliveries are growing in numbers, across urban centers. Volume concentration in homes keeps procurement planning predictable for major manufacturers. According to the India tea market analysis, 80% of the country’s production is consumed domestically, with a per capita consumption of 840 gm/year.
The commercial segment is expanding its market share with growth in hospitality, quick service restaurants and corporate campuses. Hotels standardize tea sourcing contracts to ensure flavor uniformity across properties. Offices increasingly install vending machines that use pre-measured tea premixes. Airlines and rail catering units procure bulk CTC blends under annual agreements. Premium cafés experiment with specialty loose leaf assortments to attract niche clientele.
Read more about this report – Request a free sample copy in PDF
By distribution channel, supermarkets anchor majority of the market revenue due to organized retail penetration expansion
Supermarkets and hypermarkets account for significant branded tea sales in urban India. Shelf space visibility influences impulse upgrades from economy to premium packs. Organized retailers prefer dealing with established brands that ensure supply continuity. Promotional bundling and festival discounting result in rapid consumption. Companies negotiate end cap placements to highlight new variants. This channel allows rapid rollout of flavored and specialty teas.
Online channels are also gaining rapid popularity, particularly for premium and specialty teas. Consumers explore single origin and herbal blends through digital marketplaces. Brands leverage targeted advertising and influencer partnerships to build awareness to boost the overall India tea market penetration. Subscription models ensure recurring orders and demand predictability. Smaller-scale D2C companies gain national reach without heavy distributor networks. In March 2025, D2C tea brand Vahdam India raised INR 25 crore in a "strategic" funding round from SIDBI Venture Capital.
Read more about this report – Request a free sample copy in PDF
North dominated clocks in the leading position in the market to high per capita consumption
The northern region leads in terms of accelerating tea consumption in India, powered by strong milk tea culture and winter demand spikes. States like Uttar Pradesh and Punjab exhibit high household penetration. Brands tailor blends with deeper color and briskness to suit local preference. Companies deploy extensive dealer networks to maintain visibility even in smaller towns. Promotional campaigns often roll out first in northern markets due to volume advantage. Seasonal demand peaks during colder months further support sales stability. In January 2026, Haryana-based Marvel Tea introduced upscale packaging for its Elaichi and Yellow Tea variants, enhancing shelf appeal and perceived quality to attract urban retail buyers.
The South India tea market growth is supported by rising urban incomes and experimentation with premium blends. Though the region is traditionally coffee-oriented, certain urban clusters are increasing tea consumption. In 2025, in South India, the tea production grew by 88 per cent to 26.23 m kgs (13.92 m kgs). Companies introduce lighter liquor variants to suit regional palates. Packaged branded tea penetration is improving in Tamil Nadu and Karnataka. Hospitality expansion in metro cities also fuels commercial procurement. Southern markets are becoming attractive for green and specialty tea introductions.
Read more about this report – Request a free sample copy in PDF
The competitive landscape of the market is becoming sharply value-driven rather than purely volume-led. Large-scale organized India tea market players are strengthening backward linkages with estates to secure leaf quality and hedge against climate volatility in Assam and West Bengal. Competition is getting intensified due to premiumization. Companies are rapidly launching immunity blends, region, specific SKUs, and nitrogen, sealed specialty packs to defend margins.
Export-focused India tea companies focus on digital auction platforms to improve price transparency, which is tightening arbitrage opportunities for traders. At the same time, regional blenders are fiercely defending local loyalty through hyper-tailored taste profiles. Competition revolves around supply chain control, formulation precision, export compliance, and brand differentiation. Those players who combine automation, traceability, and premium storytelling are structurally strengthening their competitive edge. Top tea manufacturers in India are using nitrogen-sealed specialty packs and innovative packaging to maintain freshness and expand export opportunities.
Established in 1964 and headquartered in Mumbai, India, Tata Consumer Products leads through strong regional blends and premium variants like Tata Tea Gold Care. The company is investing in automation and digital demand forecasting. It caters to both mass and premium consumers by segmenting SKUs by regional preferences.
Founded in 1931 and headquartered in Mumbai, India, Hindustan Unilever Limited markets Brooke Bond and Taj Mahal tea brands. The company focuses on distribution depth and strong rural penetration. It is enhancing supply chain analytics and pack innovation to maintain consistency. Its scale-driven procurement model ensures cost control while supporting brand visibility across India.
Established in 1892 and headquartered in Ahmedabad, India, Wagh Bakri Tea Group leverages strong western India presence. The group is investing in tea lounges and experiential retail formats. Regional taste precision remains its strength. It is gradually expanding into specialty and green teas while maintaining strong CTC blends.
Founded in 1706 and headquartered in London, United Kingdom, R. Twining and Company Limited serves India’s premium and specialty tea segment. The company focuses on herbal infusions and international blends targeted at urban consumers. It benefits from global sourcing expertise and strong packaging aesthetics.
*Please note that this is only a partial list; the complete list of key players is available in the full report. Additionally, the list of key players can be customized to better suit your needs.*
Other key players in the market include Pataka Group of Companies, Marvel Group, The Bombay Burmah Trading Corporation Ltd., Assam Company India Limited, Ramesh Tea Traders, Amar Tea Pvt. Ltd, Rossell India Ltd., and Goodricke Group Limited, among others.
Unlock the latest insights with our India tea market trends 2026 report. Discover regional growth patterns, consumer preferences, and key industry players. Stay ahead of competition with trusted data and expert analysis. Download your free sample report today and drive informed decisions in the market.
Flavoured Tea Ingredients Market
Elderflower Tea Market
Kombucha Tea Market
Earl Grey Tea Market
Alcoholic Tea Market
Matcha Tea Market
Bubble Tea Market
Tea Market
Upto 15% Off
USD
$2499 $2249
$3999 $3599
$4999 $4249
$5999 $5099


*While we strive to always give you current and accurate information, the numbers depicted on the website are indicative and may differ from the actual numbers in the main report. At Expert Market Research, we aim to bring you the latest insights and trends in the market. Using our analyses and forecasts, stakeholders can understand the market dynamics, navigate challenges, and capitalize on opportunities to make data-driven strategic decisions.*
The market is projected to grow at a CAGR of 4.50% between 2026 and 2035.
Investing in traceable sourcing, expanding specialty portfolios, strengthening export compliance labs, leveraging digital subscriptions, and localizing blends for regional taste clusters are improving competitiveness and margin sustainability.
Almost 80% of the total output in India is consumed domestically. The per capita consumption of the beverage in the country has witnessed a significant increase in the last decade. This is expected to be a key trend guiding the growth of the market.
North, East and Central, West, and South are the leading regions in the market.
Black tea is the dominant type of the product in the market.
The leading tea packaging in the market are loose tea, plastic containers, paper boards, aluminium tins, and tea bags, among others.
The major distribution channels in the market are supermarkets and hypermarkets, speciality stores, convenience stores, and online, among others.
The significant processing types in the market are CTC and orthodox (traditional).
Residential and commercial sectors are the leading applications of the market.
Based on sector, the market is divided into organised and unorganised.
The key players in the India tea market include Tata Consumer Products Limited, Hindustan Unilever Limited, Wagh Bakri Tea Group, R. Twining and Company Limited, Pataka Group of Companies, Marvel Group, The Bombay Burmah Trading Corporation Ltd., Assam Company India Limited, Ramesh Tea Traders, Amar Tea Pvt. Ltd, Rossell India Ltd., and Goodricke Group Limited, among others.
In 2025, the market reached an approximate volume of 1.40 Million Tons.
The market is estimated to witness healthy growth in the forecast period of 2026-2035 to reach a volume of around 2.17 Million Tons by 2035.
The residential segment leads the market, as tea is an integral part of daily life in most Indian households.
Price volatility, climate disruptions in Assam, stricter export residue norms, rising labor costs, and intense regional competition are significantly pressuring margins and procurement stability across organized and unorganized players.
Explore our key highlights of the report and gain a concise overview of key findings, trends, and actionable insights that will empower your strategic decisions.
| REPORT FEATURES | DETAILS |
| Base Year | 2025 |
| Historical Period | 2019-2025 |
| Forecast Period | 2026-2035 |
| Scope of the Report |
Historical and Forecast Trends, Industry Drivers and Constraints, Historical and Forecast Market Analysis by Segment:
|
| Breakup by Type |
|
| Breakup by Sector |
|
| Breakup by Packaging |
|
| Breakup by Processing |
|
| Breakup by Application |
|
| Breakup by Distribution Channel |
|
| Breakup by Region |
|
| Market Dynamics |
|
| Competitive Landscape |
|
| Companies Covered |
|
| Report Price and Purchase Option | Explore our purchase options that are best suited to your resources and industry needs. |
| Delivery Format | Delivered as an attached PDF and Excel through email, with an option of receiving an editable PPT, according to the purchase option. |
Datasheet
One User
USD 2,499
USD 2,249
tax inclusive*
Single User License
One User
USD 3,999
USD 3,599
tax inclusive*
Five User License
Five User
USD 4,999
USD 4,249
tax inclusive*
Corporate License
Unlimited Users
USD 5,999
USD 5,099
tax inclusive*
*Please note that the prices mentioned below are starting prices for each bundle type. Kindly contact our team for further details.*
Flash Bundle
Small Business Bundle
Growth Bundle
Enterprise Bundle
*Please note that the prices mentioned below are starting prices for each bundle type. Kindly contact our team for further details.*
Flash Bundle
Number of Reports: 3
20%
tax inclusive*
Small Business Bundle
Number of Reports: 5
25%
tax inclusive*
Growth Bundle
Number of Reports: 8
30%
tax inclusive*
Enterprise Bundle
Number of Reports: 10
35%
tax inclusive*
How To Order

Select License Type
Choose the right license for your needs and access rights.

Click on ‘Buy Now’
Add the report to your cart with one click and proceed to register.

Select Mode of Payment
Choose a payment option for a secure checkout. You will be redirected accordingly.
Strategic Solutions for Informed Decision-Making
Gain insights to stay ahead and seize opportunities.

Get insights & trends for a competitive edge.

Track prices with detailed trend reports.

Analyse trade data for supply chain insights.

Leverage cost reports for smart savings

Enhance supply chain with partnerships.

Connect For More Information
Our expert team of analysts will offer full support and resolve any queries regarding the report, before and after the purchase.
Our expert team of analysts will offer full support and resolve any queries regarding the report, before and after the purchase.
We employ meticulous research methods, blending advanced analytics and expert insights to deliver accurate, actionable industry intelligence, staying ahead of competitors.
Our skilled analysts offer unparalleled competitive advantage with detailed insights on current and emerging markets, ensuring your strategic edge.
We offer an in-depth yet simplified presentation of industry insights and analysis to meet your specific requirements effectively.


