

Consumer Insights
Uncover trends and behaviors shaping consumer choices today
Procurement Insights
Optimize your sourcing strategy with key market data
Industry Stats
Stay ahead with the latest trends and market analysis.

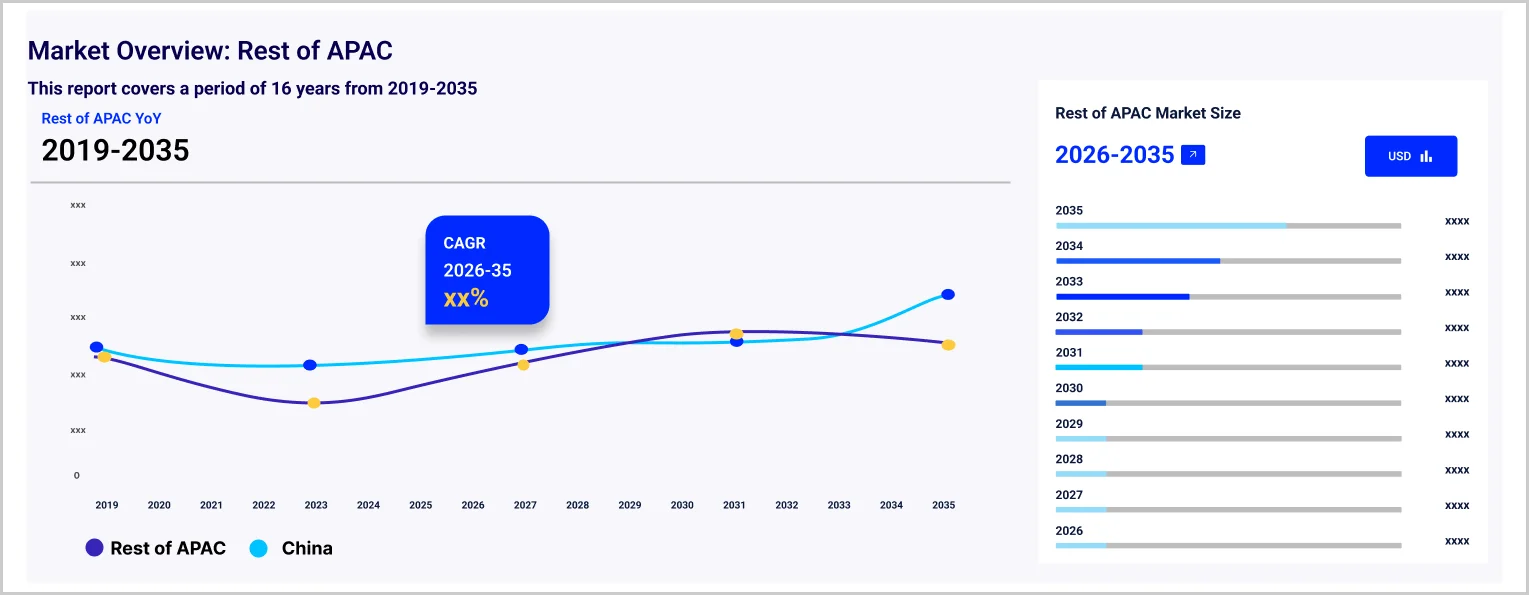
The Asia Pacific phenol market reached a volume of 5.80 Million Tons in 2025 and is projected to expand at a CAGR of 3.90% through 2035. The market is further expected to achieve a volume of 8.50 Million Tons by 2035. Increasing usage of bisphenol-A in electronic items and automotive paint in the Asia Pacific region is encouraging phenol manufacturers to enhance their integrated production facilities and secure long-term benzene sourcing contracts for stability.
Geopolitical Impact of Iran, US, and Israel War on the Asia Pacific Phenol Market
United States: The Asia Pacific Phenol Market, a key segment of the global economy, is experiencing a complex operating environment in Q1 2026 as a direct consequence of the US-Israel-Iran war. 31 force majeure declarations by polymer suppliers, polypropylene and polyethylene price spikes, and chemical manufacturer surcharges of up to 30% are flowing through supply chains. U.S. consumer inflation is projected at 4.2% for 2026, above pre-war forecasts, with fuel costs above USD 4 per gallon compressing household discretionary budgets. Retail supply chains are absorbing the combined impact of 30% higher freight costs, 15-20% packaging material inflation, and rising transport fuel costs, compressing retailer margins. Consumer spending caution is growing as gasoline above USD 4 per gallon and 4.2% projected inflation compress household discretionary budgets.
Iran: Iran's domestic Asia Pacific Phenol sector has been effectively suspended by the conflict. US-Israeli strikes on industrial and civilian infrastructure across Tehran, Mashhad, Isfahan, and other major cities have disrupted all commercial activity. Power outages from attacks on electricity generation facilities have halted manufacturing operations, and the collapse of the commercial banking and logistics system has eliminated any residual trade flows. The broader humanitarian crisis, with over 1,900 casualties and 4,000+ civilian buildings damaged, has redirected the entire Iranian economy toward survival rather than production or consumption.
Israel: Israel's Asia Pacific Phenol sector is experiencing near-term disruption from wartime conditions. Consumer spending on non-essential categories has declined as millions of Israelis regularly shelter from missile and drone alerts. Supply chain logistics are disrupted by regional airspace closures, elevated war-risk insurance premiums, and the suspension of major carrier services through the region. International business partnerships with Israeli companies have been temporarily suspended. Post-conflict reconstruction and recovery demand is expected to provide meaningful demand acceleration across affected market segments once operational conditions normalise.
The strong demand for epoxy resins used in electronics manufacturing, especially in Taiwan and South Korea is driving the Asia Pacific phenol market growth. Moreover, the environmental compliance pressures in China which are compelling the smaller phenol units either to close their manufacturing plants or upgrade their facilities, thus reducing the supply. These two factors are leading to unpredictable supply-demand situations that may make long-term contracts more attractive to prominent B2B buyers.
The Asia Pacific phenol market is witnessing a fundamental change, primarily driven by the capacity expansion efforts of integrated petrochemical companies. For example, in April 2023, INEOS completed USD 330 million Mitsui Phenols Singapore acquisition, expanding Asian presence, boosting production capacity, and strengthening global phenol, acetone supply capabilities. This decision indicates a strong willingness of manufacturers to produce specialty derivatives along with demand rather than the bulk commodity cycles.
In the Asia Pacific region, players are focusing more on downstream integration. Besides ramping up their facilities for phenol production, companies in China and South Korea are also linking downstream integration directly to their BPA, caprolactam, and epoxy resin plants. This trend in the Asia Pacific phenol market leads to less margin fluctuation. Increases in local consumption are leading to less exports, which is why companies in China are changing their export policies. Aligning with this trend, in October 2025, Moeve entered China supplying sustainable NextPhenol BC from biomass waste, reducing carbon footprint, supporting decarbonization, and expanding presence in global chemical markets.
Base Year
Historical Period
Forecast Period
Compound Annual Growth Rate
3.9%
Value in Million Tons
2026-2035
*this image is indicative*
Producers in Asia Pacific are not considering phenol only as a separate product anymore. For instance, Sinopec is developing integrated complexes where phenol serves as the raw material for bisphenol-A and epoxy resin production. Firms are boosting their plant capacity of phenol connected with BPA for the purpose of manufacturing electronics-grade materials. Such integration trend in the Asia Pacific phenol market lowers the impact of phenol price volatility; however, it also demands higher capital investment. Demonstrating this market trend, in February 2025, Westlake Epoxy launched EpoVIVE sustainable epoxy portfolio featuring phenolic resins and curing agents, enhancing performance, reducing emissions, and supporting diverse industrial applications.
Decentralizing the distribution networks is getting more attention across the Asia Pacific phenol market dynamics. Firms are allocating funds for regional storage hubs and terminal facilities with a focus on India and the Southeast Asian countries. Companies like Aditya Birla Chemicals are continuously upgrading their supply chain network of phenolics to serve the Indian laminate and resin industries. This not only decreases the reliance on imported goods but also shortens the delivery time cycle. Besides that, it enables companies to respond more rapidly to changes in industrial demand which has become unpredictable in recent years due to altered export patterns and local manufacturing policies. Aligning with this trend, in November 2024, DCTL signed agreements to acquire and relocate a PC plant from Germany to India.
China’s ramping up of environmental policies is causing the phenol production landscape to change gradually. The Ministry of Ecology and Environment has imposed strict standards on phenol-acetone plants, particularly those located in industrial clusters. This trend has aided companies like China National Petroleum Corporation which have the financial ability to make the necessary changes to their facilities. This has led to a more concentrated Asia Pacific phenol market, although at the same time, there are instances of supply disruptions during the periods when the facilities are inspected, thereby impacting on local product pricing. In line with this trend, in April 2024, KBR secured contract to license phenol technology for SABIC’s China project, supporting 250 KTA plant with improved efficiency, sustainability, and yields.
Production of cars in the Asia Pacific is significantly becoming dependent on phenol derivatives that are used in the manufacture of light composite materials. Phenolic resins, for example, can be found in brake linings, insulation, and structural components. Car manufacturers from Japan, including those Mitsui Chemicals is associated with, are inclining towards producing phenolic compounds of high performance for electric vehicles. For example, in December 2023, Wanhua Chemical resumed phenol and acetone production at Yantai facility after maintenance, restoring 400 KTPA phenol and 250 KTPA acetone capacity. The reason for this change is not only to reduce vehicle weight. It is also related to the heat resistance and safety requirements of the battery systems of EVs, boosting demand in the Asia Pacific phenol market.
Feedstock volatility continues to act as a critical constraint, with fluctuating benzene prices, driven by crude oil instability, significantly reshaping the dynamics of the Asia Pacific phenol market. Some companies are signing long-term benzene procurement agreements and even opting for backward integration where possible. Firms like LG Chem are actively optimizing their feedstock sourcing strategy to stabilize phenol margins. Companies are looking at other feedstock routes, but the commercial viability continues to be limited. For example, in December 2025, Tamilnadu Petroproducts began planned shutdown to complete 21% LAB plant expansion, enhancing production capacity and strengthening supply for detergent raw materials demand in India.
The EMR’s report titled “Asia Pacific Phenol Market Report and Forecast 2026-2035” offers a detailed analysis of the market based on the following segments:
Market Breakup by Product Type
Key Insight: Phenolic resin remains dominant across the Asia Pacific phenol market scope due to its strong association with construction materials and industrial safety applications. Bisphenol A is growing at a higher rate, mainly driven by the electronics and electric mobility sectors. Caprolactam demand is more dependent on nylon production, especially textiles and engineering plastics, hence it tends to vary along with manufacturing cycles. The others category comprises niche derivatives used in coatings and adhesives, usually influenced by the customization trends.
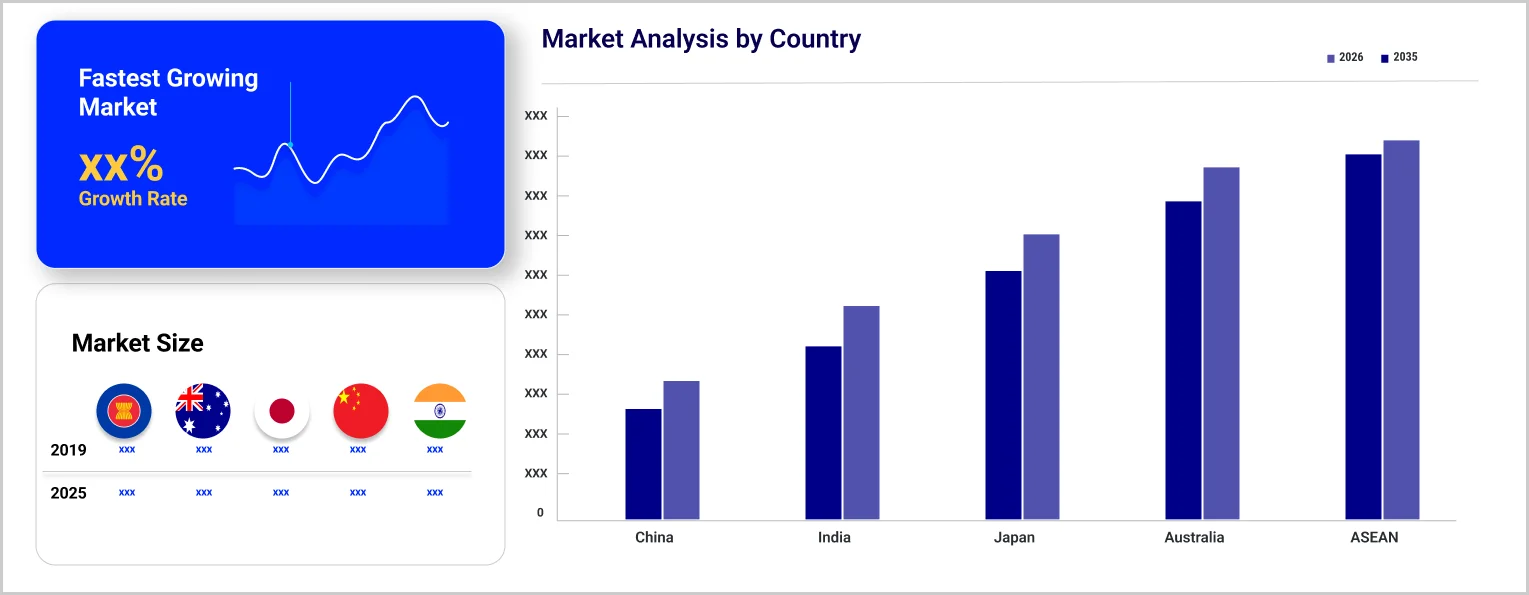
Market Breakup by Country
Key Insight: China leads the overall Asia Pacific phenol market growth as the region has a well-integrated production system and solid domestic demand. Japan is increasingly focusing on the development of advanced materials with differentiated properties, particularly targeting high-performance applications in electronics and specialty chemicals. India is growing at an accelerated pace, owing to the rise in manufacturing as well as support from government policies. ASEAN countries are experiencing a slow and steady growth, largely coming from the construction and packaging industries. However, they continue to rely heavily on imported supply. Australia has a less significant presence, that is mainly linked to industrial as well as mining-related usage.
By product type, phenolic resin dominates the market due to strong industrial laminate demand
Phenolic resin remains the most dominant product type, because it is embedded in several industrial applications, accelerating demand in the Asia Pacific phenol market. For instance, laminates insulation panels, and brake parts all depend on phenolic resin. However, companies are changing phenolic resin formulations. For example, Mitsui Chemicals and other players are developing low-emission phenolic resins for construction boards, particularly as indoor air quality regulations are getting stricter. Demonstrating this shift, in March 2024, DIC established coating resins application laboratory in India, supporting automotive and infrastructure sectors through localized testing, product development, and customer collaboration capabilities.
Bisphenol A is also expanding its share in the Asia Pacific phenol market revenue, primarily through electronics and EV supply chains. Manufacturers in South Korea and Taiwan are ordering higher purity BPA for use in circuit boards and advanced coatings. Companies like Mitsubishi Chemical, for instance, are in the process of adjusting their BPA manufacturing to semiconductor-grade quality standards.
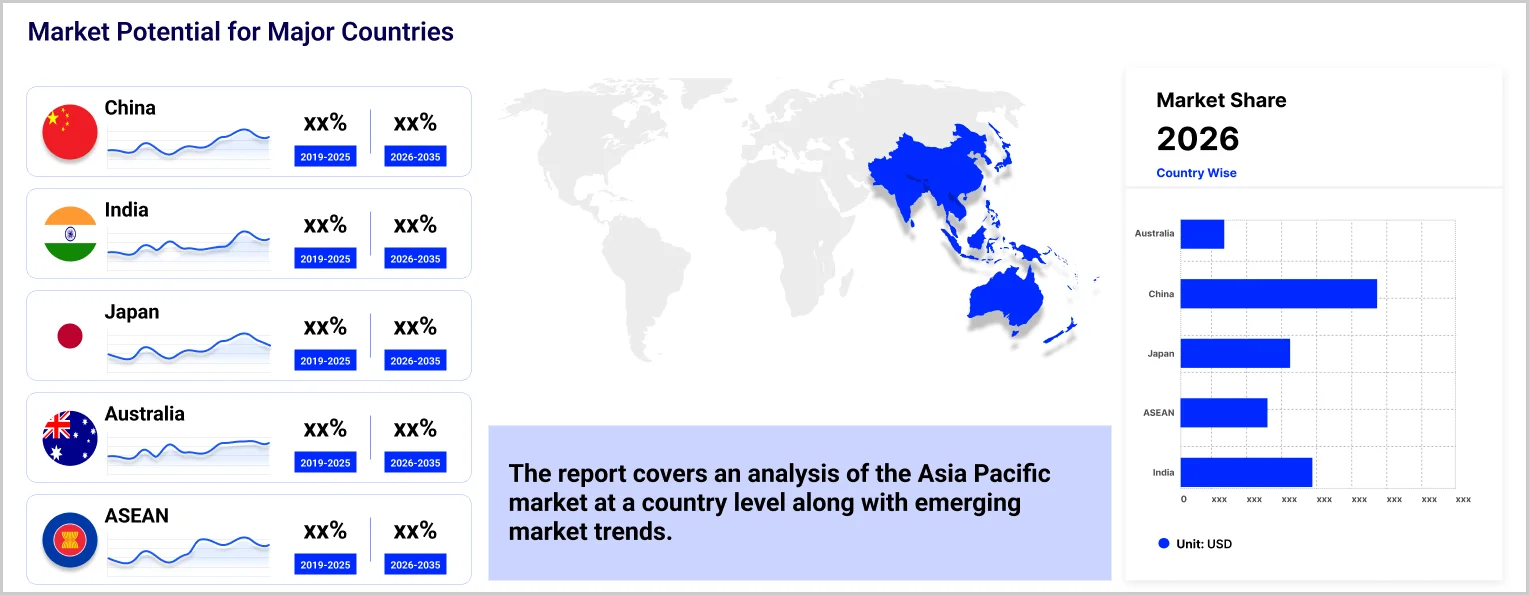
China dominates the market due to large scale integrated phenol production
China secures a leading position in the Asia Pacific phenol industry, driven not only by its large-scale production capacity but also by strong backward integration across the petrochemical value chain. Almost all phenol producers in China are connected directly to downstream production such as BPA and caprolactam. Sinopec and CNPC have augmented such arrangements, leading to controlled supply chains that lower the vulnerability to export fluctuations. Besides, the domestic market remains sufficiently robust to absorb production, particularly driven by strong demand from the electronics and construction sectors, reinforcing overall market stability.
Applications for laminates, auto-parts, and electrical equipment keep on generating stable demand in the Asia Pacific phenol market. Entities such as Aditya Birla Chemicals are increasing phenol and acetone facilities so as to lessen import reliance. Moreover, the Indian market is noticing that the government is advocating the domestic manufacturing through industrial policies, which is, in a way, increasing phenol usage. Besides, infrastructure development contributes to the demand for phenolic resins in insulation and coating applications. In April 2024, Sumitomo Bakelite completed new Nantong plant to double phenolic molding compounds capacity, integrating automation, AI monitoring, energy efficiency, and sustainable production systems.
The competitive dynamics of market are lately more focused on strategies, rather than purely volumes. Currently, combining phenol production with BPA, resins, and caprolactam activities is a major strategy followed by Asia Pacific phenol companies. Some producers position their specialty grades, mainly electronic and EV products, that offer better margins. Others attempt securing feedstock through long-term benzene contracts, which is becoming their priority. A growing number of supply hubs are being developed, primarily targeting India and Southeast Asia, helping reduce delivery timelines and manage demand fluctuations more efficiently.
At the same time, strategic partnerships are gradually reshaping collaboration models, minimizing traditional competitive barriers, and gradually establishing a more stable, resilient supply chain ecosystem. Asia Pacific phenol market players who are able to change production according to downstream demand are the ones expected to capture greater market share over the forecast period.
Mitsui Chemicals was founded in 1997 and is headquartered in Tokyo, Japan. Mitsui specializes in high-performance phenolic resins and BPA derivatives. Mitsui is shifting its focus towards the electronic and mobility industries, especially EV materials. The company is also shifting towards more sustainable chemical processes, although this is a gradual shift.
Established in 2003, JFE Chemical Corporation is based in Tokyo, Japan. The company is part of the integrated steel and chemical production system and provides phenol derivatives, primarily used as industrial and construction materials. The company is focused on the improvement of production efficiency while maintaining the consistent supply of industrial chemicals to its long-term clients.
Established in 2005, Mitsubishi Chemical Group Corporation is based in Tokyo, Japan. The company is focused on the development of advanced materials related to phenol derivatives. The firm is strengthening its BPA production, primarily for the electronics and coating industries.
Established in 2011, PTT Global Chemical Public Company Limited is based in Bangkok, Thailand. The company is focused on the expansion of its phenol and acetone production capacity in the region. They are looking to integrate their production with other chemical plants and to form partnerships in the region to strengthen their supply chain.
*Please note that this is only a partial list; the complete list of key players is available in the full report. Additionally, the list of key players can be customized to better suit your needs.*
Other key players in the market include CEPSA QUÍMICA, S.A., Shell PLC, Solvay SA, Kanto Chemical Co., Inc., Junsei Chemical Co., Ltd., and Kumho P&B Chemicals, Inc., among others.
Unlock the latest insights with our Asia Pacific phenol market trends 2026 report. Discover regional growth patterns, consumer preferences, and key industry players. Stay ahead of competition with trusted data and expert analysis. Download your free sample report today and drive informed decisions in the market.
Upto 15% Off
USD
$3999 $3599
$2499 $2249
$4999 $4249
$5999 $5099


*While we strive to always give you current and accurate information, the numbers depicted on the website are indicative and may differ from the actual numbers in the main report. At Expert Market Research, we aim to bring you the latest insights and trends in the market. Using our analyses and forecasts, stakeholders can understand the market dynamics, navigate challenges, and capitalize on opportunities to make data-driven strategic decisions.*
Get in touch with us for a customized solution tailored to your unique requirements and save upto 35%!
In 2025, the market reached an approximate volume of 5.80 Million Tons.
The market is expected to grow at a CAGR of 3.90% between 2026 and 2035.
The market is estimated to witness a healthy growth in the forecast period of 2026-2035 to reach 8.50 Million Tons by 2035.
Companies are expanding integrated production, securing feedstock contracts, investing in regional storage hubs, focusing on specialty derivatives, and forming partnerships to stabilize supply chains while adapting to demand fluctuations.
Key trends aiding the market expansion include increasing demand for phenol from the electronics industry, presence of many chemical manufacturing facilities, and favourable government policies.
Countries considered in the market are China, Japan, India, ASEAN, and Australia, among others.
Based on product type, the market segmentations include phenolic resin, bisphenol A, and caprolactam, among others.
The key players in the market include Mitsui Chemicals, Inc., JFE Chemical Corporation, Mitsubishi Chemical Group Corporation, PTT Global Chemical Public Company Limited, CEPSA QUÍMICA, S.A., Shell PLC, Solvay SA, Kanto Chemical Co., Inc., Junsei Chemical Co., Ltd., and Kumho P&B Chemicals, Inc., among others.
Volatile benzene prices are impacting margins while environmental compliance costs are rising. Supply chain disruptions and uneven downstream demand are making production planning difficult for regional phenol manufacturers.
Explore our key highlights of the report and gain a concise overview of key findings, trends, and actionable insights that will empower your strategic decisions.
| REPORT FEATURES | DETAILS |
| Base Year | 2025 |
| Historical Period | 2019-2025 |
| Forecast Period | 2026-2035 |
| Scope of the Report |
Historical and Forecast Trends, Industry Drivers and Constraints, Historical and Forecast Market Analysis by Segment:
|
| Breakup by Product Type |
|
| Breakup by Region |
|
| Market Dynamics |
|
| Competitive Landscape |
|
| Companies Covered |
|
Single User License
One User
USD 3,999
USD 3,599
tax inclusive*
Datasheet
One User
USD 2,499
USD 2,249
tax inclusive*
Five User License
Five User
USD 4,999
USD 4,249
tax inclusive*
Corporate License
Unlimited Users
USD 5,999
USD 5,099
tax inclusive*
*Please note that the prices mentioned below are starting prices for each bundle type. Kindly contact our team for further details.*
Flash Bundle
Small Business Bundle
Growth Bundle
Enterprise Bundle
*Please note that the prices mentioned below are starting prices for each bundle type. Kindly contact our team for further details.*
Flash Bundle
Number of Reports: 3
20%
tax inclusive*
Small Business Bundle
Number of Reports: 5
25%
tax inclusive*
Growth Bundle
Number of Reports: 8
30%
tax inclusive*
Enterprise Bundle
Number of Reports: 10
35%
tax inclusive*
How To Order

Select License Type
Choose the right license for your needs and access rights.

Click on ‘Buy Now’
Add the report to your cart with one click and proceed to register.

Select Mode of Payment
Choose a payment option for a secure checkout. You will be redirected accordingly.
Strategic Solutions for Informed Decision-Making
Gain insights to stay ahead and seize opportunities.

Get insights & trends for a competitive edge.

Track prices with detailed trend reports.

Analyse trade data for supply chain insights.

Leverage cost reports for smart savings

Enhance supply chain with partnerships.

Connect For More Information
Our expert team of analysts will offer full support and resolve any queries regarding the report, before and after the purchase.
Our expert team of analysts will offer full support and resolve any queries regarding the report, before and after the purchase.
We employ meticulous research methods, blending advanced analytics and expert insights to deliver accurate, actionable industry intelligence, staying ahead of competitors.
Our skilled analysts offer unparalleled competitive advantage with detailed insights on current and emerging markets, ensuring your strategic edge.
We offer an in-depth yet simplified presentation of industry insights and analysis to meet your specific requirements effectively.


Share