

Consumer Insights
Uncover trends and behaviors shaping consumer choices today
Procurement Insights
Optimize your sourcing strategy with key market data
Industry Stats
Stay ahead with the latest trends and market analysis.
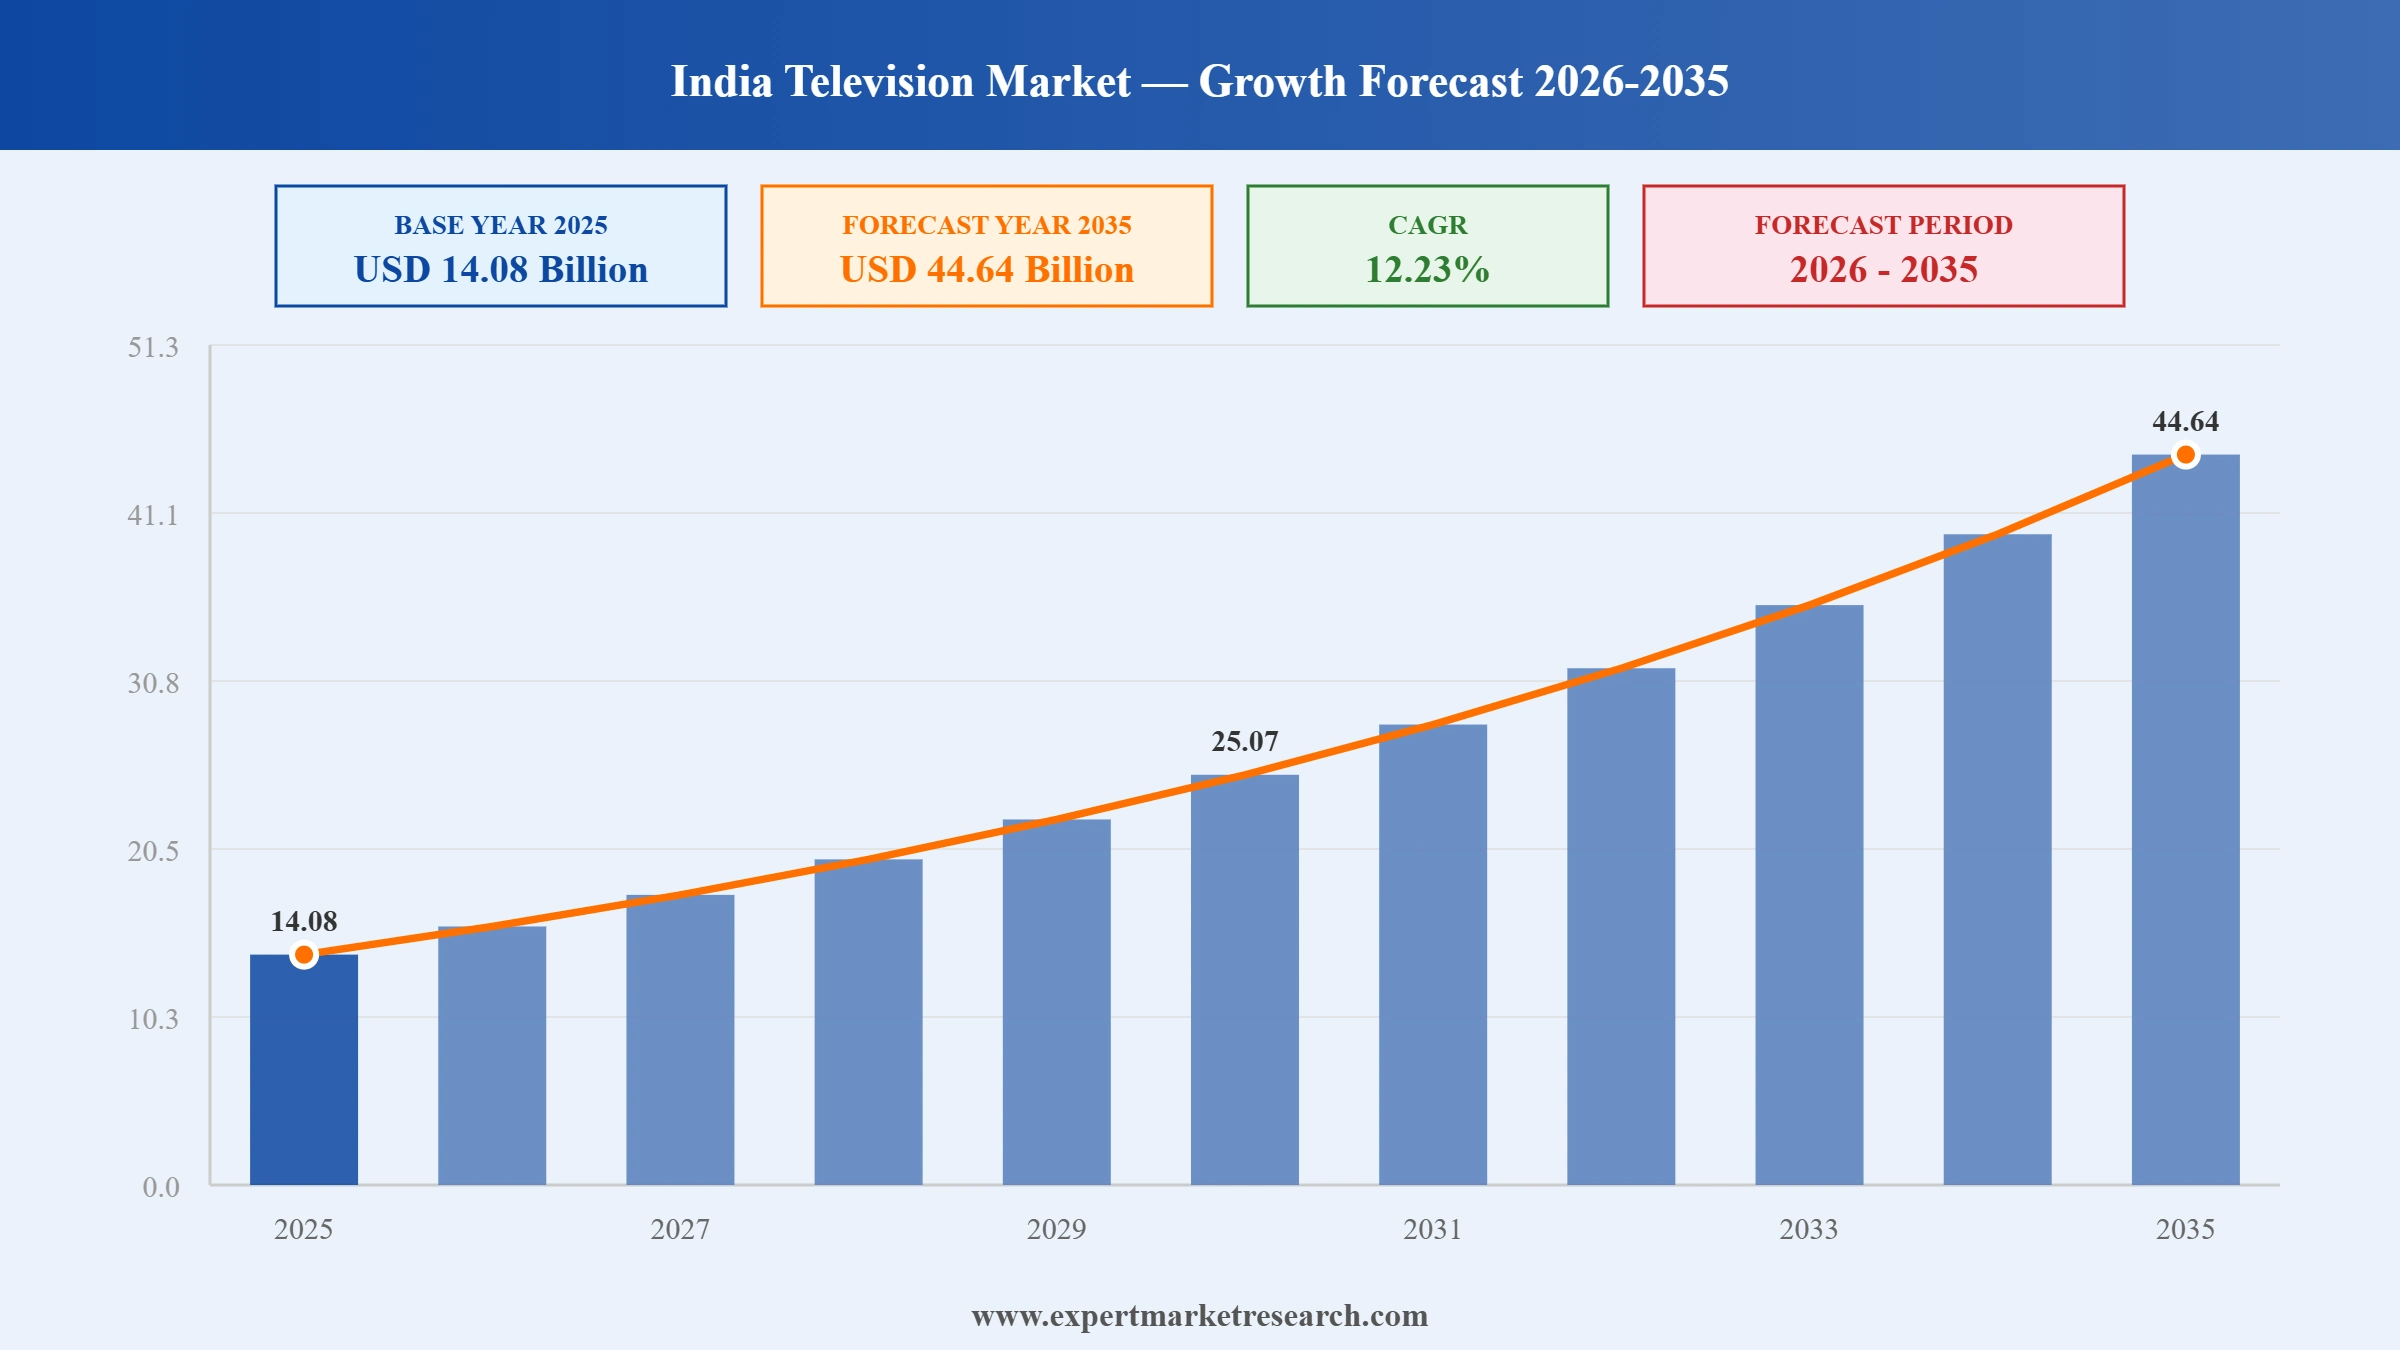
The India television market reached a value of USD 14.08 Billion in 2025 and is projected to expand at a CAGR of around 12.23% during the forecast period of 2026-2035. Samsung and LG launching their 2026 Neo QLED and OLED evo TV ranges in India, Smart TV penetration reaching 35% of Indian TV households, India's OTT viewership on Smart TVs surpassing linear broadcast for the first time, and Xiaomi and Haier expanding affordable Smart TV portfolios are driving India television market growth. The market is expected to reach USD 44.64 Billion by 2035.
Read more about this report - REQUEST FREE SAMPLE COPY IN PDF
The India television market is driven by Samsung and LG premium 2026 TV range launches, Smart TV penetration reaching 35% of Indian TV households, OTT viewership surpassing linear broadcast on Smart TVs, Xiaomi and Haier expanding affordable Smart TV portfolios, and India's urban middle class upgrading from CRT and basic LED TVs to premium QLED and OLED Smart TV models.
Samsung Electronics launched its 2026 Neo QLED TV range in India in January 2026, including the QN90F flagship model with AI-powered picture processing, Dolby Atmos audio, and Multi-View gaming mode for Indian premium consumers. LG Corporation launched its 2026 OLED evo TV range in India simultaneously, including the C6 and G6 OLED series with AI Picture Pro and enhanced brightness for India's bright-room viewing conditions. The competing premium launches reinforced Samsung and LG's dominant position in India's premium Smart TV segment above INR 50,000.
India's Smart TV penetration reached 35% of total TV households in 2025, driven by Samsung, LG, Xiaomi, and Haier affordable Smart TV models and OTT content proliferation on JioCinema, Hotstar, Netflix, and Prime Video. OTT viewership on Smart TVs surpassed linear broadcast for the first time in 2025, marking a structural shift toward streaming-first content discovery.
Xiaomi India expanded its Smart TV X Pro series in 2025 with models below INR 20,000, targeting mass market consumers upgrading from basic LED TVs. Haier India launched its 2025 Smart TV lineup with Google TV OS and 4K resolution at competitive price points, positioning both brands as primary upgrade paths for first-time Smart TV buyers in Tier 2 and Tier 3 Indian cities.
India's television market transitioned in 2025 from LCD and LED TVs toward QLED and OLED Smart TV formats, driven by JioCinema's cricket streaming rights and Hotstar's content library. Samsung and LG commanded premium share while Hisense and Xiaomi expanded mid-market QLED. DTH subscriber bases declined as Smart TV OTT adoption grew.
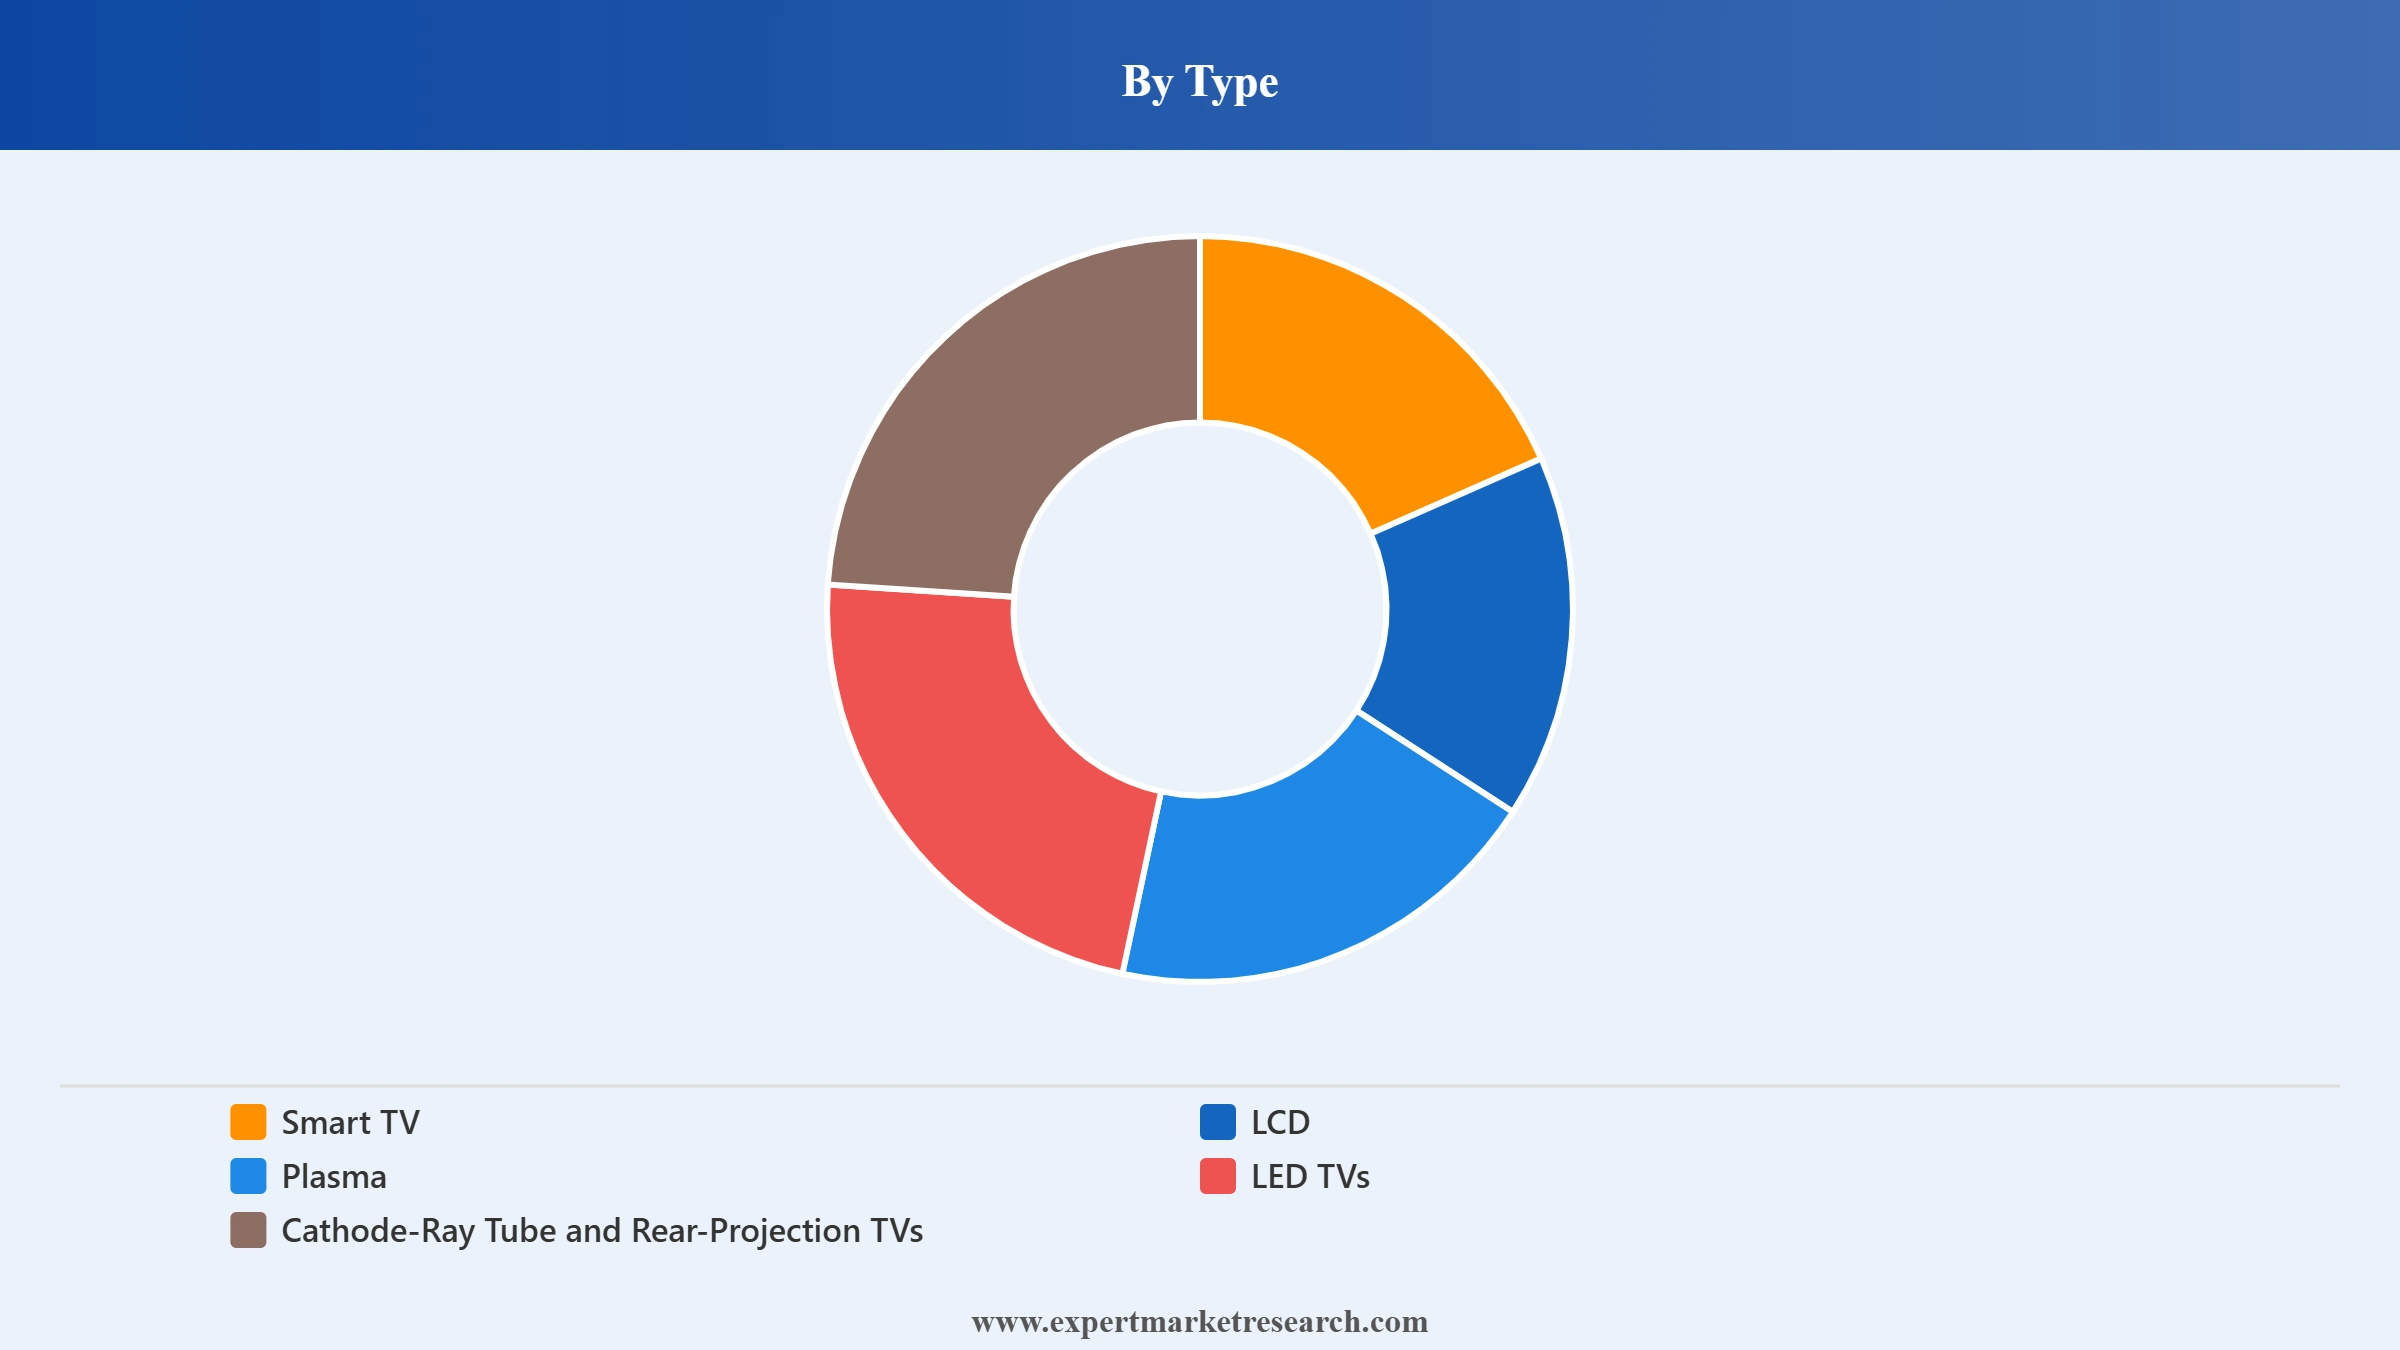
Smart TV is the dominant India television type through OTT platform integration and middle class upgrade demand. LCD, Plasma, and LED TVs remain significant through rural markets and price-sensitive segments. CRT and Rear-Projection TVs are in structural decline through replacement demand with LED and Smart TV upgrade incentives.
LCD, Plasma, and LED TVs are significant India television types through rural and mid-market price sensitivity. Entry-level Smart TVs with LED backlighting are blurring the category boundary as manufacturers embed basic Smart OS into affordable LED TV formats. CRT TVs are in near-total decline except for replacement and legacy household demand.
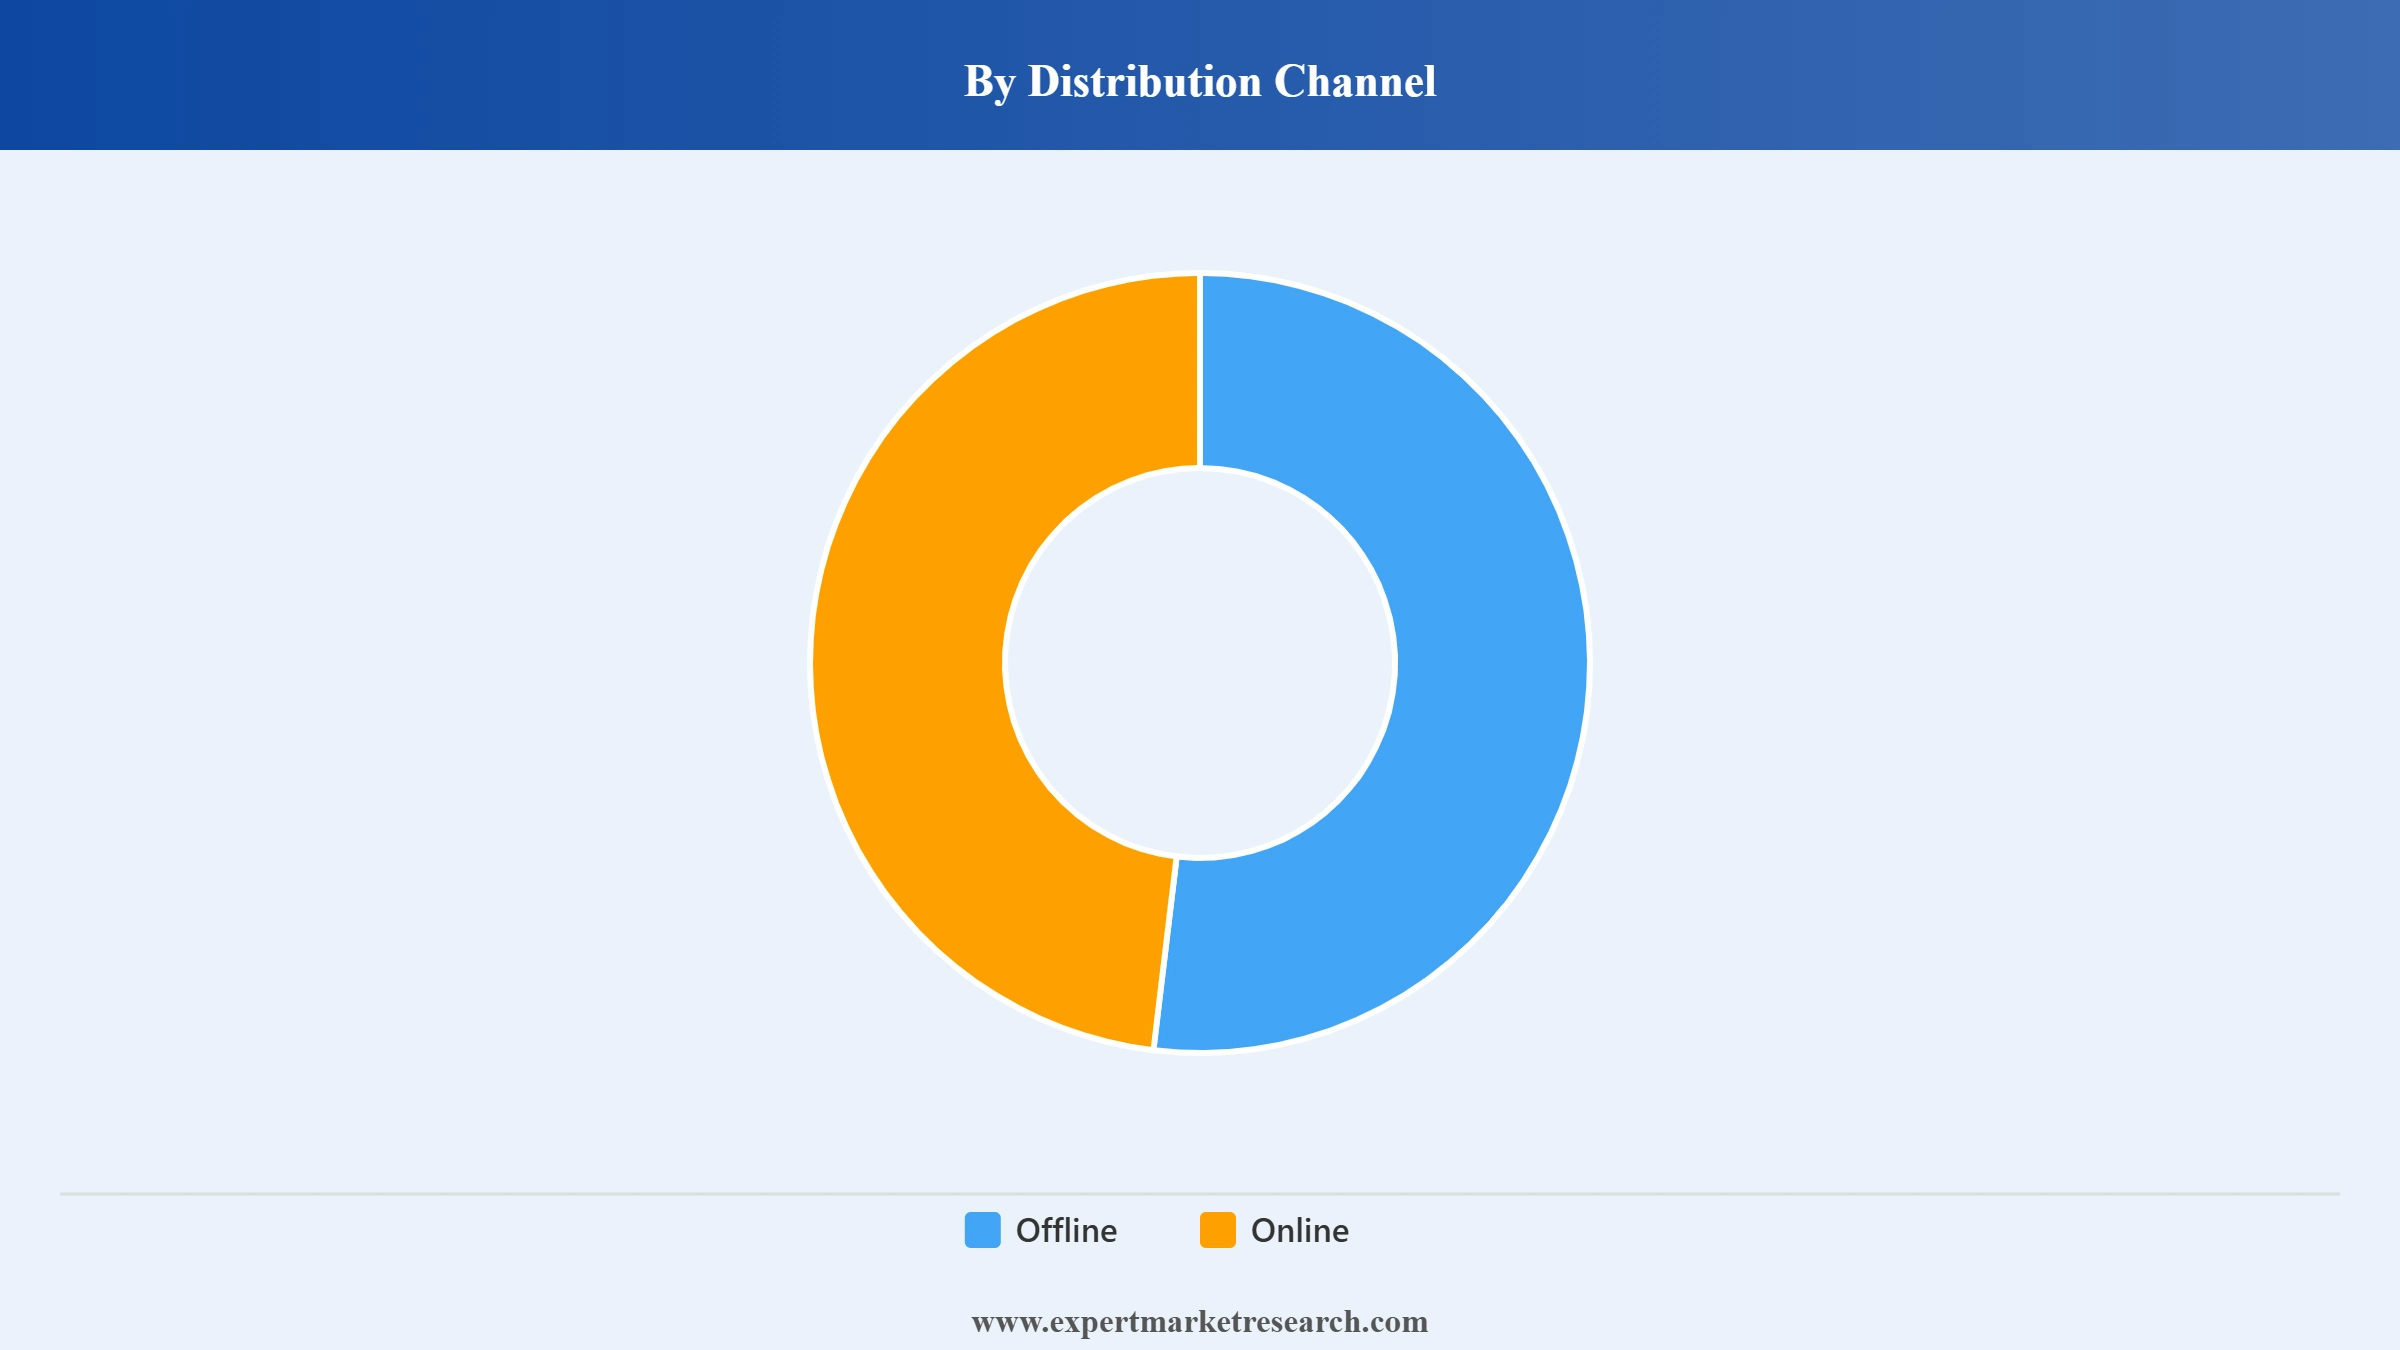
Offline is the dominant India television distribution channel through Samsung SmartPlus, LG Brand Shops, Croma, Reliance Digital, and regional electronics retailer physical store networks across India's 638,000 villages and 100 Tier 1 and Tier 2 cities. Online is fastest-growing through Flipkart, Amazon India, and brand direct e-commerce site sales driven by Diwali and festival sale events.
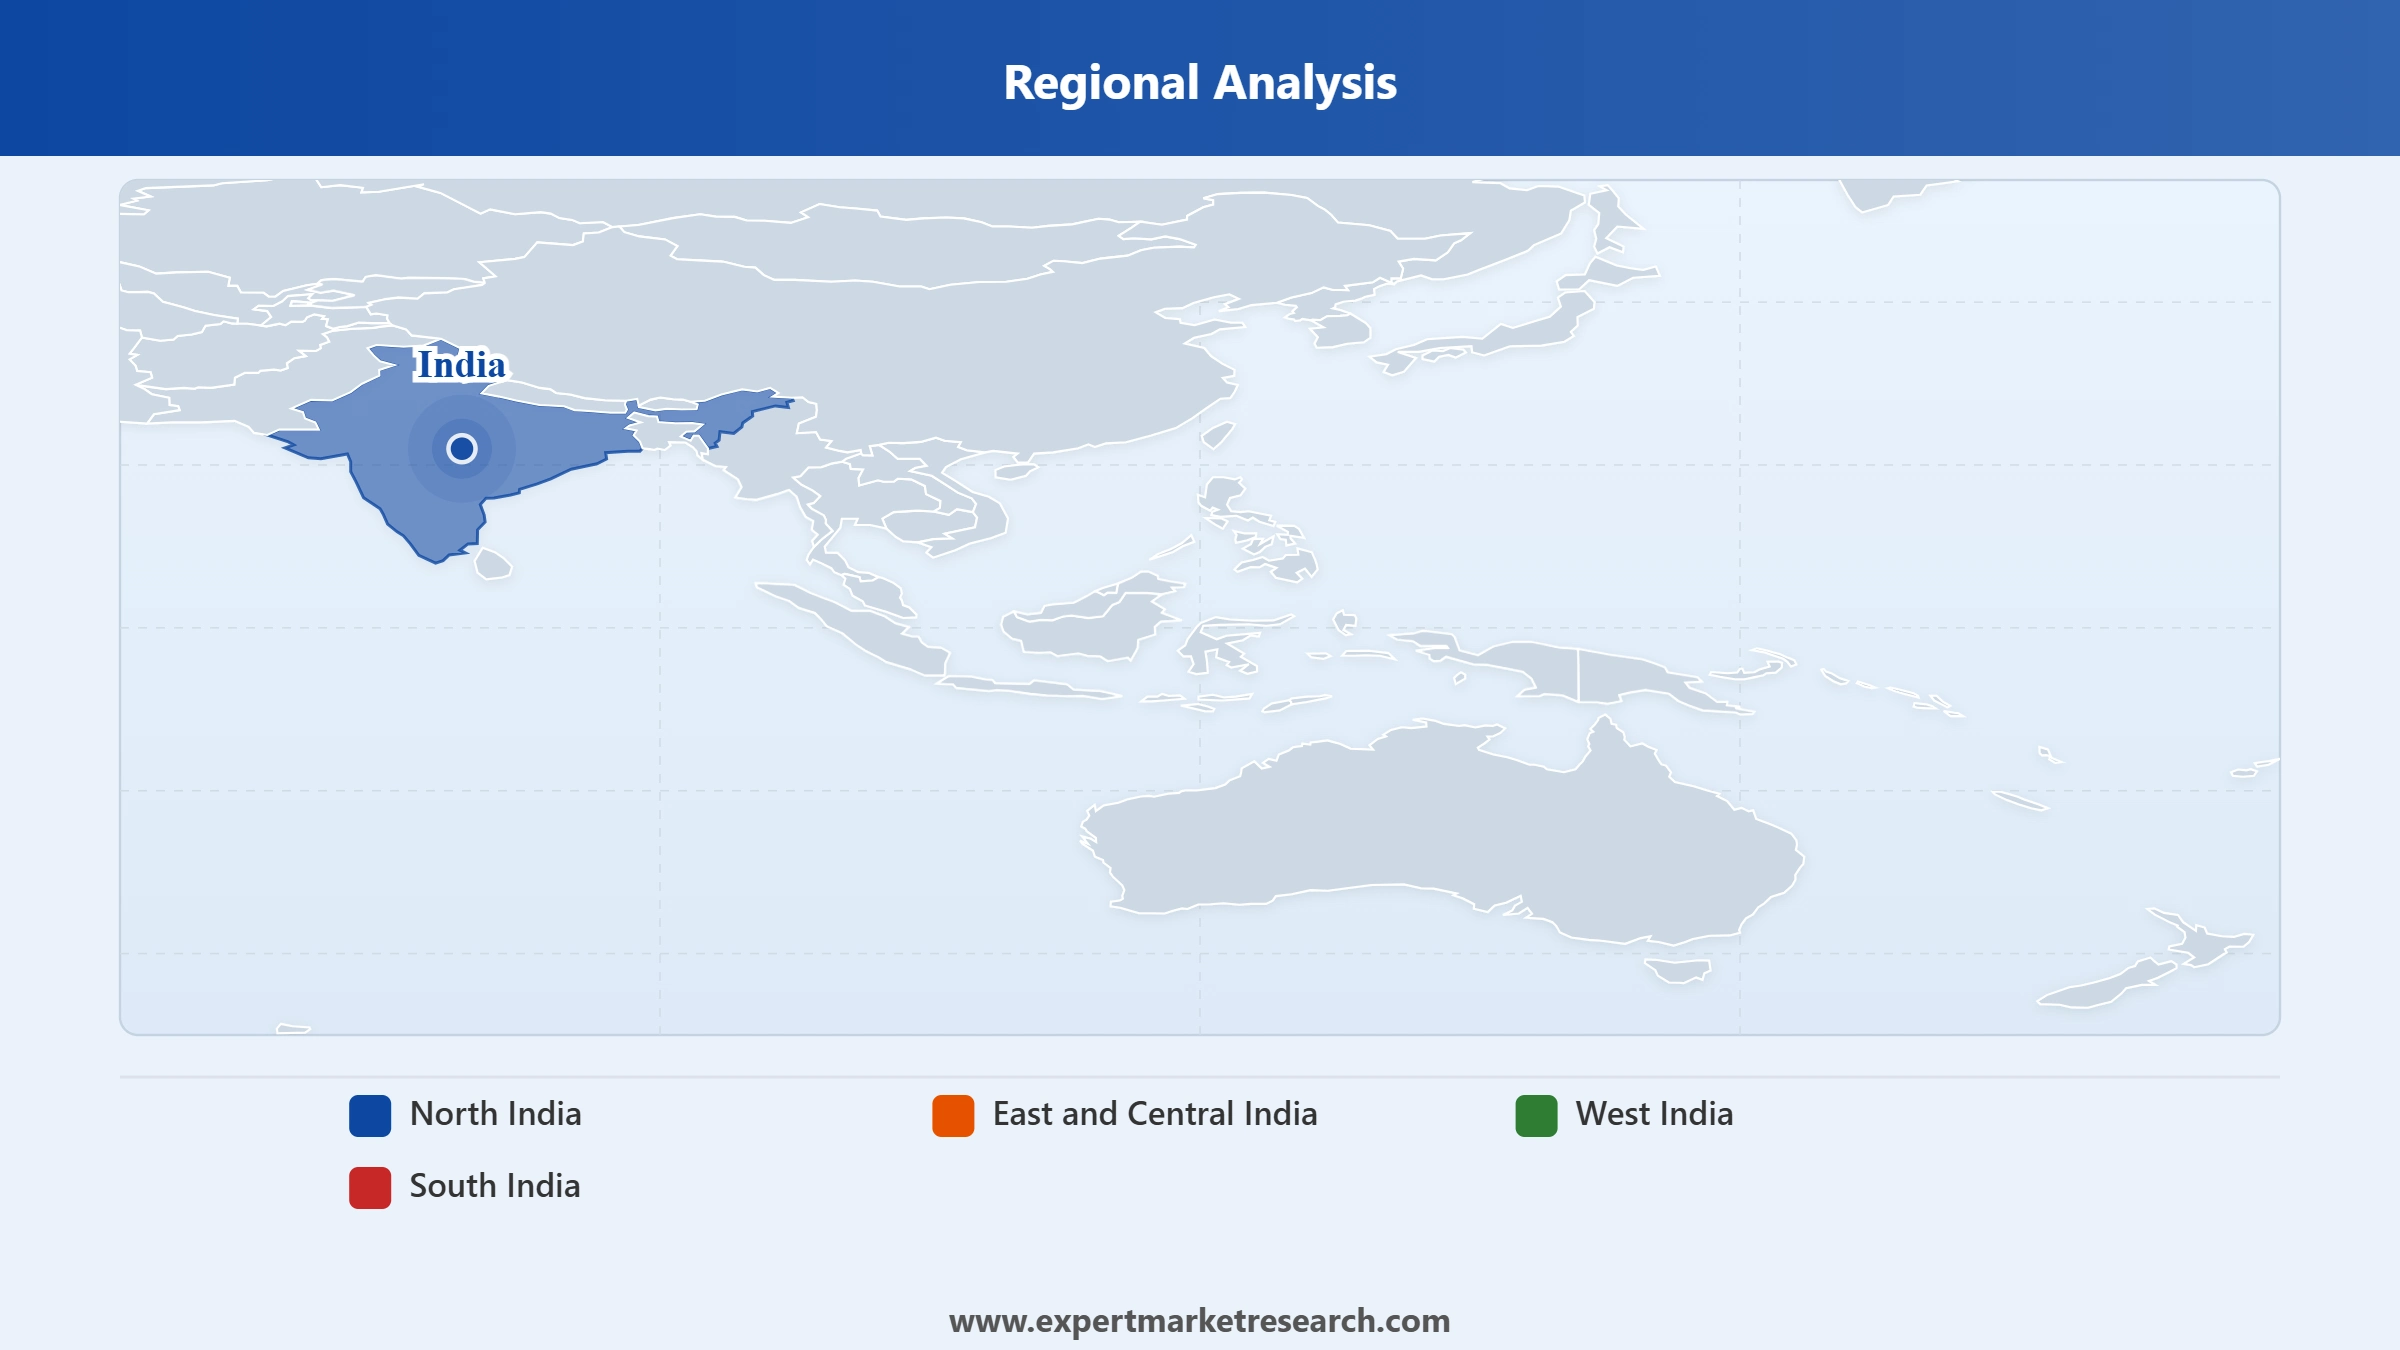
South India is the dominant India television region through Tamil Nadu, Karnataka, Andhra Pradesh, Telangana, and Kerala's high household television penetration, strong regional consumer electronics retail, and premium Smart TV adoption in Bengaluru, Chennai, and Hyderabad. North India is significant through Delhi NCR, UP, and Rajasthan market size. West India is significant through Maharashtra and Gujarat urban retail.
East and Central India is a growing India television market region through aspiration-led Smart TV upgrade demand in Bihar, Jharkhand, Odisha, West Bengal, and Madhya Pradesh Tier 2 and Tier 3 cities. Xiaomi and Haier affordable Smart TV ranges are driving first-time Smart TV adoption in East and Central India's price-sensitive markets. North India's Delhi NCR, Punjab, and Rajasthan remain high-value consumer electronics markets for Samsung, LG, and Sony premium TVs.
The Expert Market Research's report titled “India Television Market Report and Forecast 2026-2035” offers a detailed analysis of the market based on the following segments:
Market Breakup by Type
Key Insight: Smart TV is the dominant India television type through OTT integration. LCD, Plasma, and LED TVs are significant through mid-market demand. CRT and Rear-Projection TVs are in decline.
Market Breakup by Distribution Channel
Key Insight: Offline is the dominant India television channel through physical retail coverage. Online is fastest-growing through Amazon India, Flipkart, and festival sale events.
Market Breakup by Region
Key Insight: South India is the dominant India television region through high penetration and premium adoption. North India and West India are significant. East and Central India are growing.
Read more about this report - REQUEST FREE SAMPLE COPY IN PDF
By Type, Smart TV is the dominant type in the India television market
Smart TV commands the largest India television type share through OTT platform integration making Smart TVs the primary streaming device for JioCinema, Hotstar, Netflix, and Prime Video, and Samsung and LG's dominant Smart TV market position. LCD, Plasma, and LED TVs retain a significant share through rural markets and price-sensitive segments. CRT and Rear-Projection TVs are in structural decline through replacement demand with LED and Smart TV upgrade incentives across India's expanding middle class.
Read more about this report - REQUEST FREE SAMPLE COPY IN PDF
By Distribution Channel, Offline is dominant while Online is fastest-growing
Offline commands the largest India television distribution channel share through Samsung SmartPlus, LG Brand Shops, Croma, Reliance Digital, and regional electronics retailer physical store networks across India's Tier 1 and Tier 2 cities. Online is the fastest-growing distribution channel through Flipkart, Amazon India, and brand direct e-commerce sales driven by peak Diwali, Big Billion Day, and Great Indian Festival sale events generating high television volumes at competitive price points.
Read more about this report - REQUEST FREE SAMPLE COPY IN PDF
South India is the dominant India television market region, driven by Tamil Nadu, Karnataka, Andhra Pradesh, Telangana, and Kerala's high household television penetration. Strong consumer electronics retail in Bengaluru, Chennai, and Hyderabad, and premium Smart TV adoption.
North India is a significant India television region through Delhi NCR's premium TV retail density and large UP and Rajasthan population-driven volume demand. West India is significant through Maharashtra and Gujarat urban retail markets. East and Central India are growing through Tier 2 and Tier 3 city aspirational Smart TV upgrade demand.
Read more about this report - REQUEST FREE SAMPLE COPY IN PDF
The India television market is highly competitive, with South Korean consumer electronics giants, Japanese electronics multinationals, and Chinese appliance brands competing alongside domestic Indian brands through premium Smart TV innovation, affordable Smart TV positioning, and broad offline and online retail distribution.
Samsung Electronics Co. Ltd. is the dominant India television market leader through its QLED and Neo QLED Smart TV portfolio. Samsung launched its 2026 Neo QLED QN90F in India in January 2026 and commands the largest India Smart TV market share.
LG Corp. has a significant India television market presence through its OLED evo Smart TV portfolio. LG launched its 2026 OLED evo C6 and G6 range in India in January 2026, commanding the premium segment with AI Picture Pro.
Panasonic Holdings Corp. has a significant India television market presence through its 4K Smart OLED and LED TV range, serving the mid-to-premium segment with strong brand heritage in South India.
Sony Group Corp. has a significant India television market presence through its BRAVIA XR OLED and LED Smart TV range. Sony commands strong brand equity in South India and urban metro markets for premium home cinema applications.
Other key players include Toshiba Corporation, Hisense International Co. Ltd., Haier Smart Home Co. Ltd., Micromax Informatics Ltd., Sansui Electric Co. Ltd., and Vizio Holding Corp., among others.
*Please note that this is only a partial list; the complete list of key players is available in the full report. Additionally, the list of key players can be customized to better suit your needs.*
Our full report for 2026-2035 provides comprehensive market sizing, segmentation analysis across television type, distribution channel, and regional dimensions, and competitive benchmarking for the India television market. Coverage spans historical data from 2019 through 2035, equipping television manufacturers, electronics retailers, and consumer electronics investors with targeted intelligence on Smart TV growth and OTT integration trends. Reach out to our team to access the complete report or request a customised version.
Ultra HD Television (UHD TV) Market
North America Television Market
United States Television Market
Europe Television Market
Social Television Market
Television Market
Upto 15% Off
USD
$2499 $2249
$3999 $3599
$4999 $4249
$5999 $5099


*While we strive to always give you current and accurate information, the numbers depicted on the website are indicative and may differ from the actual numbers in the main report. At Expert Market Research, we aim to bring you the latest insights and trends in the market. Using our analyses and forecasts, stakeholders can understand the market dynamics, navigate challenges, and capitalize on opportunities to make data-driven strategic decisions.*
The market is projected to grow at a CAGR of 12.23% between 2026 and 2035.
Key strategies driving the market include product innovation, expansion of smart TV portfolios, multi-channel distribution, and strategic partnerships to enhance reach, brand presence, and consumer adoption.
The key trends aiding the market include the rapid growth of e-commerce, the rising launch of affordable smart TVs, and growth of the OLED technology.
Regions considered in the market are North India, East and Central India, West India, and South India.
Based on type, market segmentations include smart TV, LCD, plasma, and LED TVs, and cathode-Ray tube (CRT) and rear-projection TVs.
Different distribution channels are offline and online.
Smart TVs depict the highest growth potential in the Indian market.
The key players in the market include Samsung Electronics Co., Ltd., LG Corp., Panasonic Holdings Corp., Sony Group Corp., Toshiba Corporation, Hisense International Co., Ltd., Haier Smart Home Co. Ltd., Micromax Informatics Ltd., Sansui Electric Co., Ltd., Vizio Holding Corp., and other prominent manufacturers.
In 2025, the India television market reached an approximate value of USD 14.08 Billion.
Major challenges include intense competition, rapid technology changes, price sensitivity, and distribution and regulatory hurdles across urban and rural markets.
Explore our key highlights of the report and gain a concise overview of key findings, trends, and actionable insights that will empower your strategic decisions.
| REPORT FEATURES | DETAILS |
| Base Year | 2025 |
| Historical Period | 2019-2025 |
| Forecast Period | 2026-2035 |
| Scope of the Report |
Historical and Forecast Trends, Industry Drivers and Constraints, Historical and Forecast Market Analysis by Segment:
|
| Breakup by Type |
|
| Breakup by Distribution Channel |
|
| Breakup by Region |
|
| Market Dynamics |
|
| Competitive Landscape |
|
| Companies Covered |
|
Datasheet
One User
USD 2,499
USD 2,249
tax inclusive*
Single User License
One User
USD 3,999
USD 3,599
tax inclusive*
Five User License
Five User
USD 4,999
USD 4,249
tax inclusive*
Corporate License
Unlimited Users
USD 5,999
USD 5,099
tax inclusive*
*Please note that the prices mentioned below are starting prices for each bundle type. Kindly contact our team for further details.*
Flash Bundle
Small Business Bundle
Growth Bundle
Enterprise Bundle
*Please note that the prices mentioned below are starting prices for each bundle type. Kindly contact our team for further details.*
Flash Bundle
Number of Reports: 3
20%
tax inclusive*
Small Business Bundle
Number of Reports: 5
25%
tax inclusive*
Growth Bundle
Number of Reports: 8
30%
tax inclusive*
Enterprise Bundle
Number of Reports: 10
35%
tax inclusive*
How To Order

Select License Type
Choose the right license for your needs and access rights.

Click on ‘Buy Now’
Add the report to your cart with one click and proceed to register.

Select Mode of Payment
Choose a payment option for a secure checkout. You will be redirected accordingly.
Strategic Solutions for Informed Decision-Making
Gain insights to stay ahead and seize opportunities.

Get insights & trends for a competitive edge.

Track prices with detailed trend reports.

Analyse trade data for supply chain insights.

Leverage cost reports for smart savings

Enhance supply chain with partnerships.

Connect For More Information
Our expert team of analysts will offer full support and resolve any queries regarding the report, before and after the purchase.
Our expert team of analysts will offer full support and resolve any queries regarding the report, before and after the purchase.
We employ meticulous research methods, blending advanced analytics and expert insights to deliver accurate, actionable industry intelligence, staying ahead of competitors.
Our skilled analysts offer unparalleled competitive advantage with detailed insights on current and emerging markets, ensuring your strategic edge.
We offer an in-depth yet simplified presentation of industry insights and analysis to meet your specific requirements effectively.


