

Consumer Insights
Uncover trends and behaviors shaping consumer choices today
Procurement Insights
Optimize your sourcing strategy with key market data
Industry Stats
Stay ahead with the latest trends and market analysis.
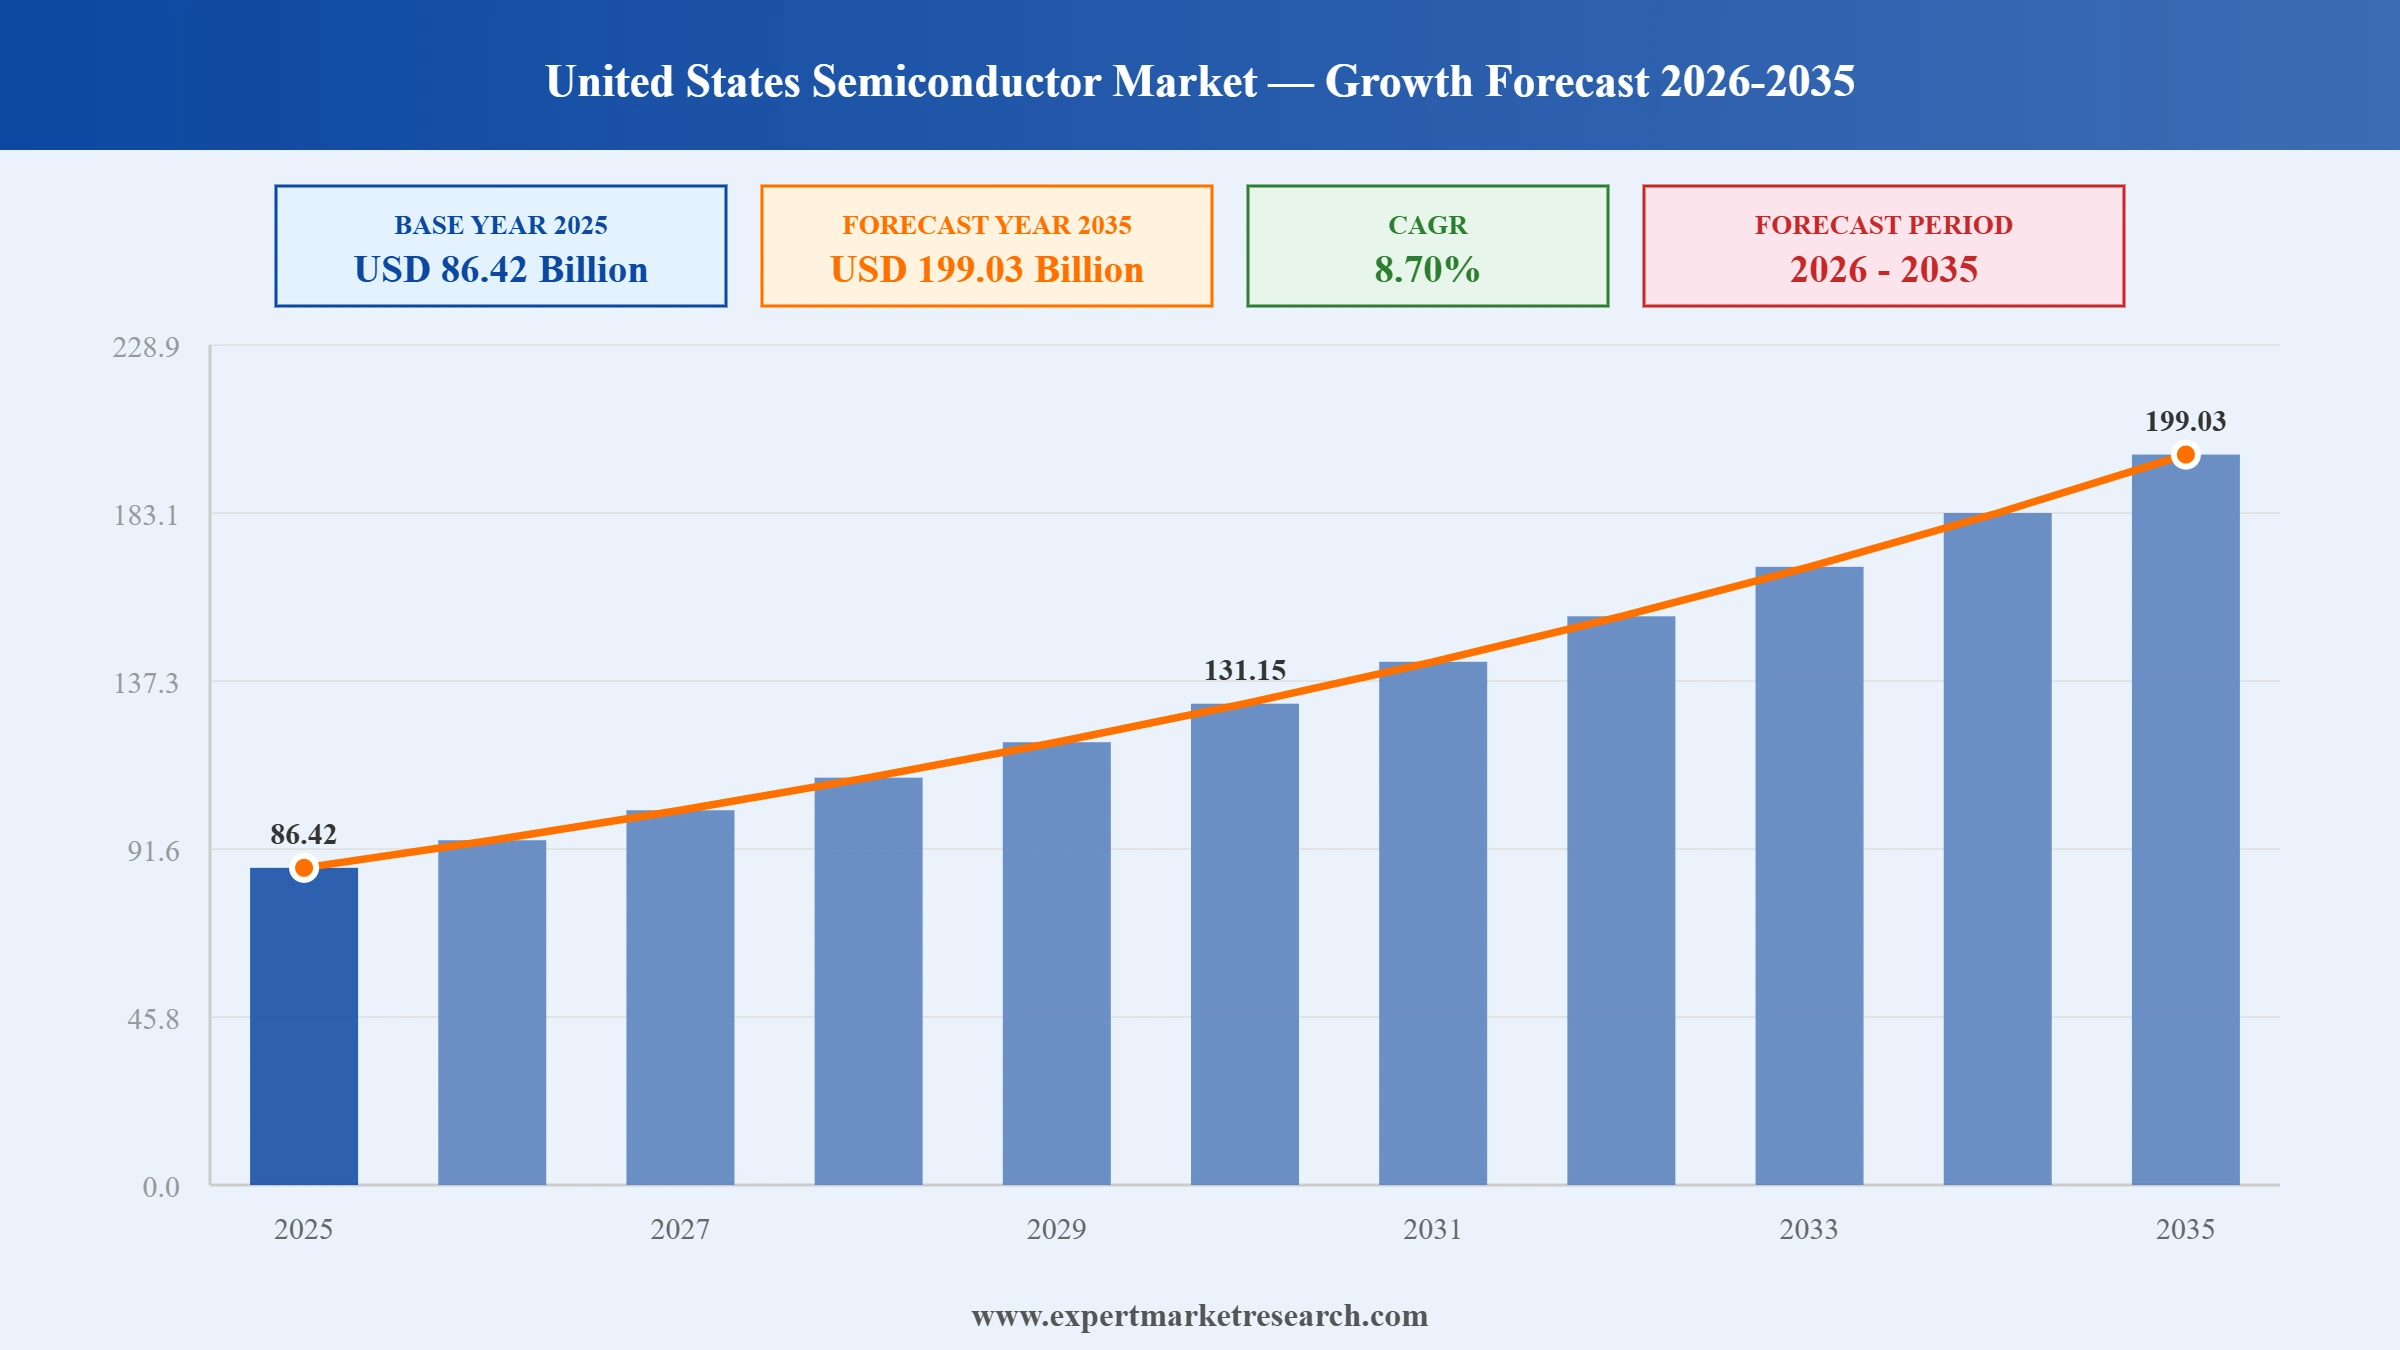
The United States semiconductor market reached a value of USD 86.42 Billion at 2025 and is projected to expand at a CAGR of around 8.70% during the forecast period of 2026-2035. With the CHIPS and Science Act catalysing a domestic manufacturing renaissance, exponential demand for AI-accelerator chips and high-bandwidth memory, growing semiconductor content per electric vehicle, and sustained hyperscale cloud infrastructure investment, the market is expected to reach USD 199.03 Billion by 2035.
Read more about this report - REQUEST FREE SAMPLE COPY IN PDF
The United States semiconductor market is undergoing its most significant structural transformation in decades, driven by the CHIPS and Science Act, AI-driven demand acceleration, and geopolitical supply chain resilience imperatives. Domestic wafer fabrication capacity is expanding rapidly through both US company investments and foreign direct investment by TSMC and Samsung, while AI chip demand continues to exceed supply across advanced GPU and memory categories. The resulting investment cycle is reshaping the US semiconductor landscape for the entire forecast period.
TSMC announced April 2026 expansion of advanced packaging facilities in Arizona, with NVIDIA booking over half of CoWoS capacity for 2026 and 2027. The co-location of packaging capacity alongside fabrication in Arizona significantly reduces turnaround time for US customers, marking a structural shift in US semiconductor supply chain resilience.
Intel launched its 18A process node with the Panther Lake CPU from Fab 52 in Chandler, Arizona in January 2026. The US government invested USD 8.9 billion in Intel and took a 10% stake, demonstrating strong national industrial policy support for Intel's foundry services ambition within the United States semiconductor market.
TSMC issued capacity constraint warnings to NVIDIA and Broadcom in January 2026 as AI chip demand surged, creating supply bottlenecks for advanced GPU and ASIC production. The constraints reinforced the critical importance of domestic US semiconductor manufacturing capacity expansion through CHIPS Act-funded programmes.
TSMC confirmed in November 2025 that its second Arizona fabrication plant, designed for 3nm process technology, is scheduled to come online in 2026-2027 as part of its USD 65 billion US investment commitment. The accelerated timeline, advanced from original 2030 projections, reflects the strategic urgency of domestic advanced node manufacturing in the United States semiconductor market.
AI-driven demand is transforming the United States semiconductor market structure. NVIDIA's data centre revenue reached USD 51.2 billion in Q3 2025 alone, far exceeding gaming and other segments. HBM was sold out through late 2025, with memory manufacturers Micron and SK Hynix both operating at full capacity through the forecast period.
The CHIPS and Science Act's USD 39 billion incentive pool has initiated 18 new fab construction projects across the United States, the largest domestic wafer capacity buildout on record. This investment is reversing a long-running decline in US wafer output in the United States semiconductor market.
Automotive semiconductor content per vehicle is rising sharply toward USD 1,500 by 2030, driven by electric vehicle power management chips and advanced driver assistance systems. NXP Semiconductors, Texas Instruments, and Infineon are among the key players benefiting from this structural demand trend in the United States semiconductor market.
IDM companies held 60.5% share of the United States semiconductor market in 2024, while fabless vendors are expanding at a 7.11% CAGR. Intel's foundry revival strategy and TSMC's US capacity expansion are rebalancing the manufacturing model landscape, with new foundry relationships emerging through packaging agreements involving NVIDIA and Amazon.
The US government's semiconductor trade policy, including export controls on advanced chips to China and domestic manufacturing mandates under the CHIPS Act, is fundamentally reshaping the United States semiconductor market supply chain. TSMC received USD 6.565 billion in CHIPS Act grants, Samsung received USD 4.7 billion, and Intel received USD 8.9 billion under this national resilience strategy.
United States Semiconductor Market Report and Forecast 2026-2035 offers a detailed analysis of the market based on the following segments:
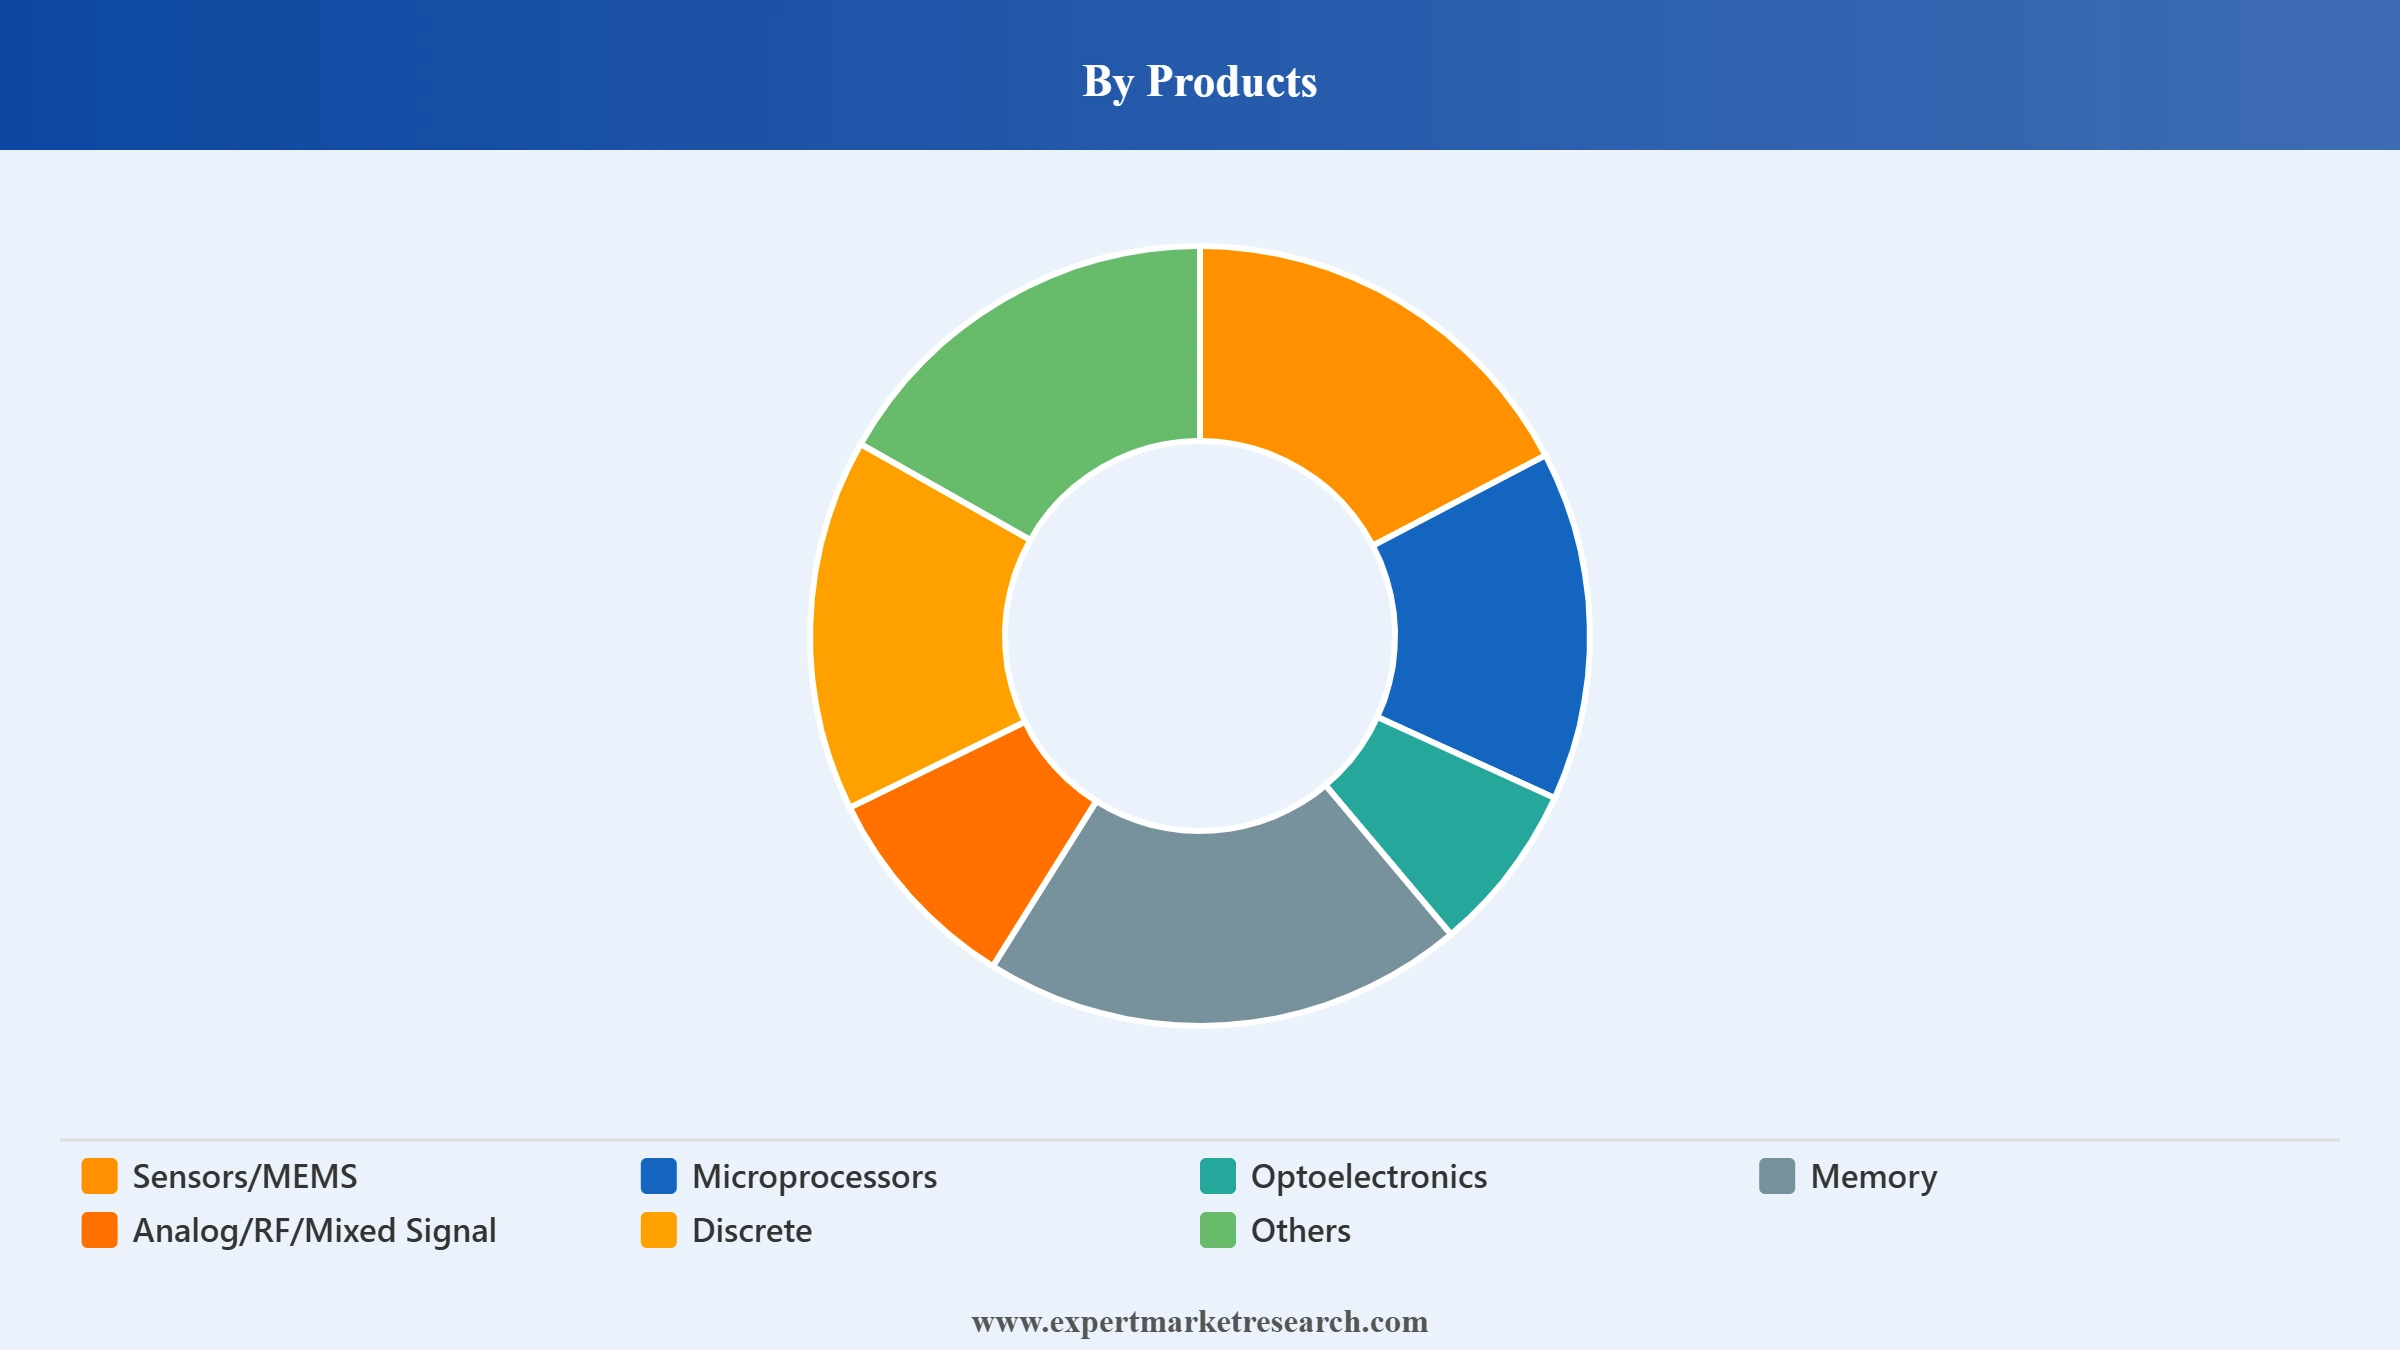
Market Breakup by Products
Key Insight: Memory semiconductors represent one of the largest and fastest-growing product categories in the United States semiconductor market, driven by the explosive growth of AI data centre infrastructure requiring high-bandwidth memory and DRAM for GPU clusters. Microprocessors remain the broadest-value product category, spanning data centre CPUs, consumer PCs, and embedded processors. Sensors/MEMS are experiencing strong growth from automotive and IoT applications. Analog/RF/Mixed Signal devices maintain steady demand across industrial, telecommunications, and automotive sectors.
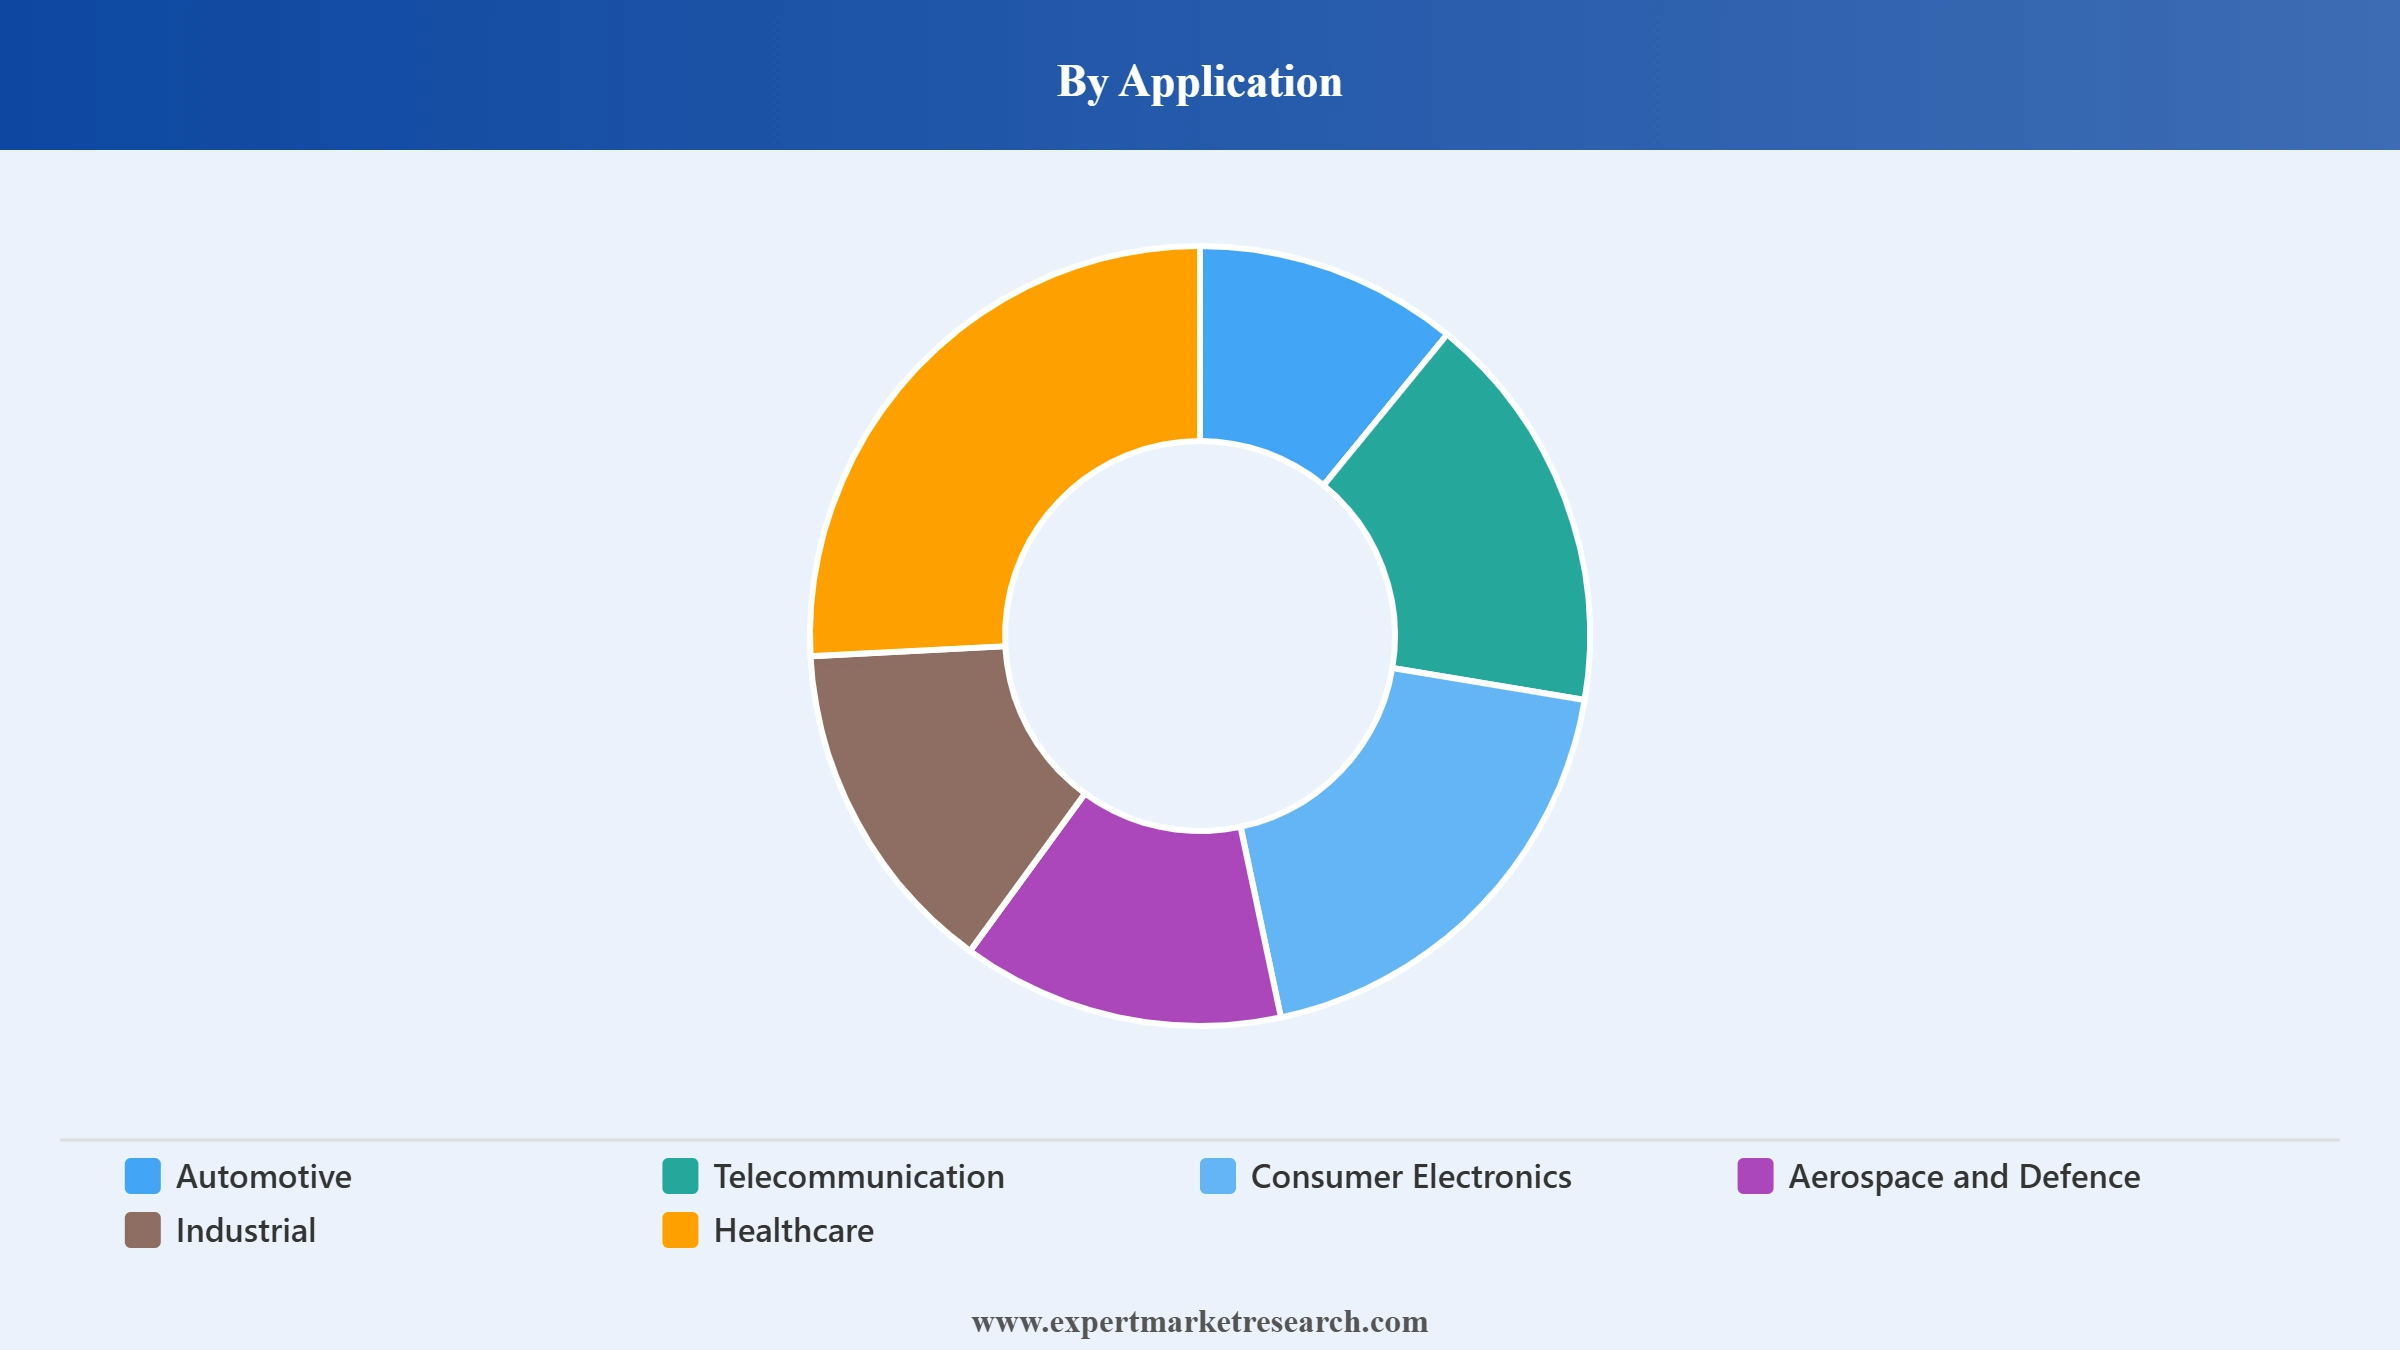
Market Breakup by Application
Key Insight: Consumer electronics represents the largest application segment in the United States semiconductor market by volume, sustaining high chipset demand across smartphones, PCs, tablets, and gaming devices. Automotive is the fastest-growing application segment, with semiconductor content per vehicle rising sharply as EV adoption accelerates and ADAS systems become standard. Aerospace and defence applications are growing steadily, supported by US Department of Defense procurement programmes and the strategic importance of domestic semiconductor supply for military platforms.
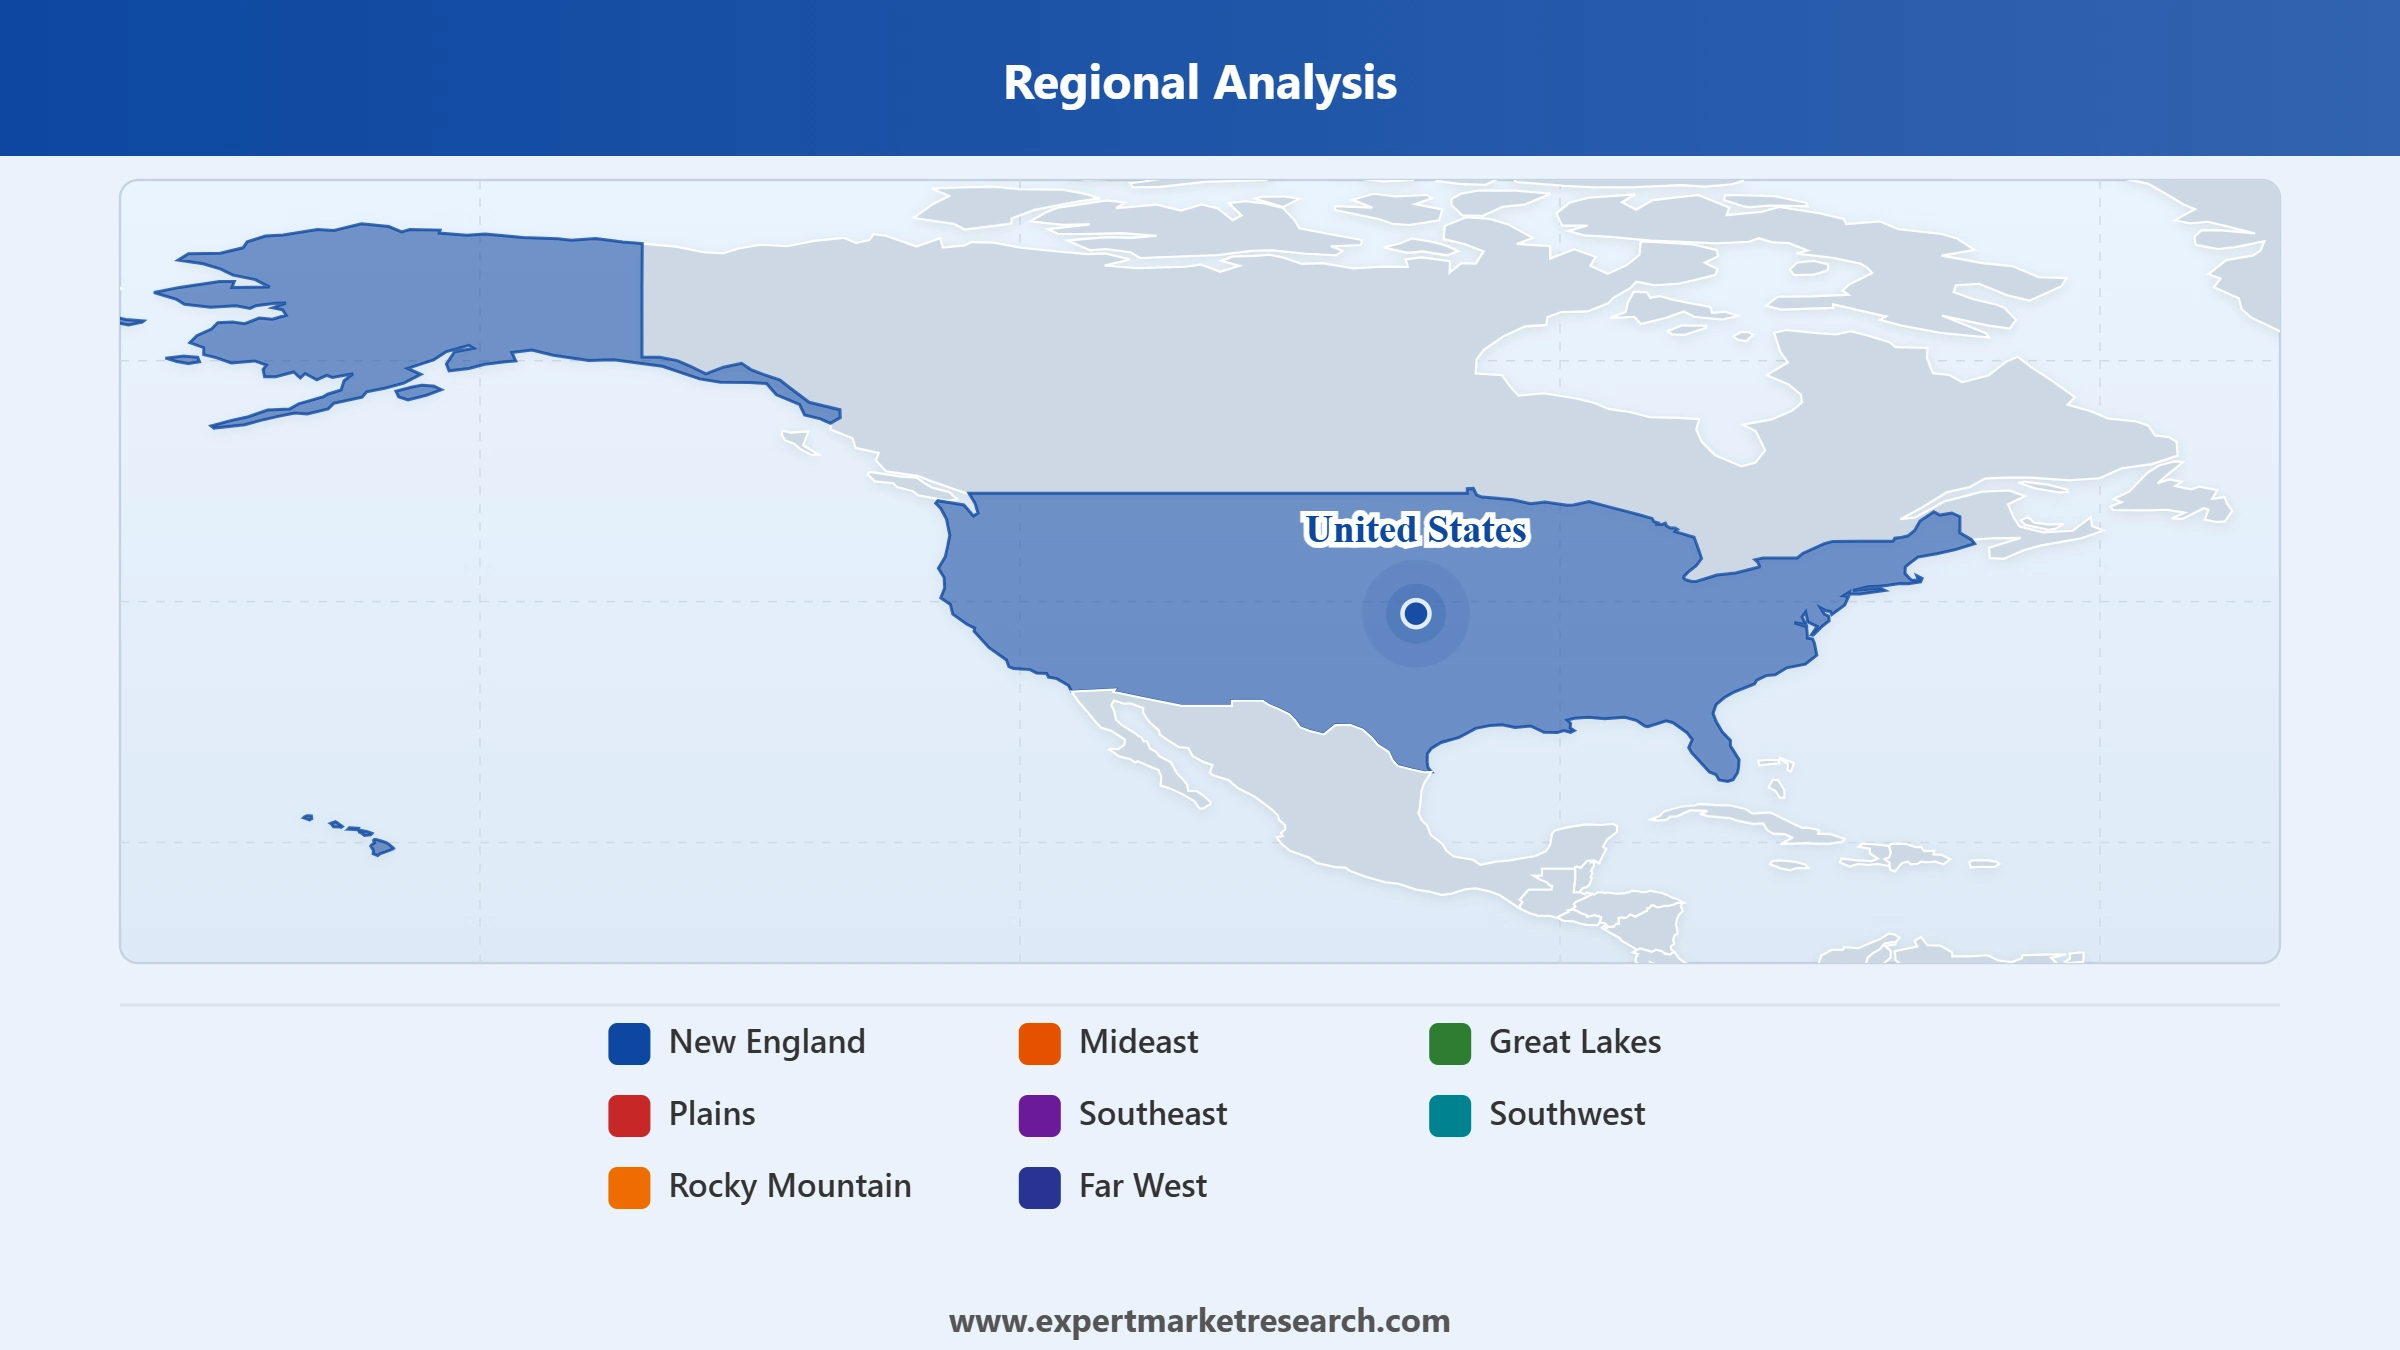
Market Breakup by Region
Key Insight: The Far West region, encompassing California's Silicon Valley ecosystem, is the dominant semiconductor design and fabless industry hub in the United States. Intel, NVIDIA, AMD, Qualcomm, and Broadcom are all headquartered or have major operations in the Far West, making it the largest regional contributor to US semiconductor design revenue. The Southwest is emerging as the fastest-growing manufacturing region, driven by TSMC's USD 65 billion Arizona investment and Intel's Fab 52 and other Chandler facilities, fundamentally reshaping US domestic wafer production geography.


Read more about this report - REQUEST FREE SAMPLE COPY IN PDF
By Products, memory semiconductors dominate due to AI-driven demand for high-bandwidth memory and cloud infrastructure
Memory semiconductors command one of the largest revenue shares in the United States semiconductor market, driven by the exceptional capital intensity of AI training workloads that require massive HBM and DRAM volumes per compute cluster. NVIDIA's AI GPUs integrate multiple HBM stacks per processor, creating a structural multiplier effect on memory demand for every AI chip shipped. Micron Technology is the primary US-headquartered memory manufacturer and has benefited enormously from this structural demand shift, while Samsung's US operations also contribute significant memory capacity to the American market.
Read more about this report - REQUEST FREE SAMPLE COPY IN PDF
Microprocessors represent the broadest-application and longest-established product category, sustaining strong demand across server, PC, mobile, and embedded compute markets. Intel, AMD, and NVIDIA (for AI compute) are the principal competitors in the US microprocessor segment. AI acceleration cards and CPUs designed for data centre workloads are the fastest-growing sub-segment, with Intel's 18A process launch and AMD's Ryzen AI product family both targeting the rapidly expanding on-device AI compute category.
By Application, automotive applications are the fastest-growing segment due to EV adoption and rising semiconductor content per vehicle
Automotive applications are the fastest-growing segment within the United States semiconductor market, driven by the automotive industry's transition toward electrification and intelligent transport systems. The semiconductor content per electric vehicle is converging toward USD 1,500 by 2030, significantly exceeding content in conventional internal combustion vehicles. Power management ICs, ADAS processors, lidar and radar sensors, and in-vehicle communication chips are all growing simultaneously, making automotive the most structurally compelling long-term semiconductor demand driver across the forecast period.
Read more about this report - REQUEST FREE SAMPLE COPY IN PDF
Consumer electronics is the largest application segment by volume, sustaining consistent semiconductor demand across smartphones, personal computers, gaming consoles, and smart home devices. AI integration into consumer devices is accelerating semiconductor content growth within this segment, with on-device neural processing units becoming standard across premium smartphones and laptops. Aerospace and defence applications maintain steady importance in the United States semiconductor market, supported by ongoing US Department of Defense modernisation programmes and the bipartisan political emphasis on domestic military semiconductor supply chain security.
The Far West leads United States semiconductor market activity due to unmatched concentration of design talent and fabless industry infrastructure
The Far West region's dominance in the United States semiconductor market reflects decades of accumulated ecosystem advantages. Silicon Valley hosts the headquarters and primary engineering centres of the world's most valuable semiconductor companies, supported by Stanford University, UC Berkeley, and the venture capital ecosystem that has funded generations of chip startups. The region's fabless-first model generates the highest design revenue per square mile of any semiconductor cluster globally, with company valuations from NVIDIA and Broadcom alone exceeding the market capitalisation of entire national semiconductor industries.
Read more about this report - REQUEST FREE SAMPLE COPY IN PDF
The Southwest is the fastest-growing semiconductor manufacturing region in the United States, propelled by TSMC's three-fab Arizona campus and Intel's Chandler megasite. TSMC's second Arizona fab, producing 3nm node chips for clients including Apple and NVIDIA, is scheduled for 2026-2027 startup, with the third fab at 2nm advancing its completion to 2029. The US government's USD 6.565 billion CHIPS Act award to TSMC and USD 4.7 billion to Samsung's Texas expansion confirm federal commitment to growing the Southwest and South's manufacturing contribution to the United States semiconductor market.
The United States semiconductor market is dominated by a core group of companies with distinct competitive models. IDMs like Intel and Samsung compete in both design and manufacturing, while fabless giants NVIDIA, Qualcomm, Broadcom, and AMD focus exclusively on chip design, outsourcing production to TSMC and Samsung. Texas Instruments and Broadcom maintain strong analog and mixed-signal franchises. Micron Technology is the primary US-headquartered memory manufacturer. The competitive landscape is being reshaped by TSMC and Intel's foundry services expansion and by AI chip demand creating extraordinary growth opportunities for GPU and memory producers.
International competition from Taiwan and South Korea remains intense, with TSMC and Samsung maintaining leading-edge manufacturing advantages. However, the CHIPS Act and geopolitical supply chain concerns are creating unprecedented incentives for companies to build or expand US manufacturing. The competitive dynamics for AI accelerator chips are particularly intense, with NVIDIA maintaining near-dominance in GPU accelerators while AMD and Intel work to close the performance and ecosystem gap.
Intel Corporation was founded in 1968 and is headquartered in Santa Clara, California. The company is a leading global semiconductor manufacturer and the largest US-headquartered chip maker by revenue, with products spanning data centre CPUs, client computing processors, network chips, and emerging AI accelerators. Intel's Fab 52 in Chandler, Arizona, which launched 18A process production in January 2026, is the most advanced semiconductor facility on US soil. The US government invested USD 8.9 billion in Intel under CHIPS Act grants, reflecting the company's strategic national importance.
NVIDIA Corporation was founded in 1993 and is headquartered in Santa Clara, California. The company is the world's dominant AI chip company, with data centre GPU revenue reaching USD 51.2 billion in Q3 2025, far exceeding all other product lines. NVIDIA's H200 and Blackwell architecture GPUs are the primary compute platforms for AI training globally, and its CUDA software ecosystem creates a powerful competitive moat. NVIDIA is among the largest customers of TSMC's most advanced process nodes and has made a USD 5 billion investment in Intel for packaging services as part of its US supply chain diversification strategy.
Qualcomm Technologies was founded in 1985 and is headquartered in San Diego, California. The company is the world's leading mobile semiconductor provider, with its Snapdragon platform powering the majority of premium Android smartphones globally. Qualcomm is also expanding aggressively into automotive (Snapdragon Ride), AI PC processors (Snapdragon X2 series), and extended reality chips. At CES 2026, Qualcomm unveiled its Snapdragon X2 series built on TSMC's N3P node, demonstrating the company's continued investment in leading-edge process technology for its next-generation mobile and compute platforms.
Broadcom Inc. was founded in 1991 and is headquartered in Palo Alto, California. The company is a leading designer of complex digital and analog semiconductor solutions used in networking, broadband access, wireless communications, and storage. Broadcom has become a major beneficiary of AI infrastructure spending through its custom AI ASIC programme, designing Tensor Processing Units for Google and custom accelerators for other hyperscale clients. TSMC warned Broadcom alongside NVIDIA of capacity constraints in January 2026 as AI chip demand surged, reflecting Broadcom's growing scale as an AI accelerator producer.
Other key players in the market are Samsung Corporation, Texas Instruments Incorporated, Micron Technology, Inc., NXP Semiconductors, Infineon Technologies AG, Advanced Micro Devices, Inc., and others.
*Please note that this is only a partial list; the complete list of key players is available in the full report. Additionally, the list of key players can be customized to better suit your needs.*
Discover the latest insights on the United States semiconductor market 2026 with our comprehensive report. Stay ahead with valuable data on AI chip demand trends, CHIPS Act investment developments, and the competitive strategies of leading semiconductor companies. Whether you're a chip designer, equipment supplier, or technology investor, this report gives you the clarity you need. Download your free sample now and discover key opportunities in the United States thriving semiconductor industry.
United Kingdom Semiconductor Market
Upto 15% Off
USD
$2499 $2249
$3999 $3599
$4999 $4249
$5999 $5099


*While we strive to always give you current and accurate information, the numbers depicted on the website are indicative and may differ from the actual numbers in the main report. At Expert Market Research, we aim to bring you the latest insights and trends in the market. Using our analyses and forecasts, stakeholders can understand the market dynamics, navigate challenges, and capitalize on opportunities to make data-driven strategic decisions.*
The market was valued at USD 86.42 Billion in 2025.
The market is projected to grow at a CAGR of 8.70% between 2026 and 2035.
The revenue generated from the market is expected to reach USD 199.03 Billion in 2035.
The United States semiconductor market growth is driven by factors such as environmental considerations, the needs of defence and aerospace industries, advancements in technology, and the increasing demand for consumer electronics.
The market is categorised according to its products, which include sensors/MEMS, microprocessors, optoelectronics, memory, analog/RF/mixed-signal, discrete and others.
The market key players are Intel Corporation, Samsung Corporation, NVIDIA Corporation, Texas Instruments Incorporated, Broadcom Inc., Micron Technology, Inc., Qualcomm Technologies, Inc., NXP Semiconductors, Infineon Technologies AG, and Advanced Micro Devices, Inc. among others.
Based on the application, the market is divided into automotive, telecommunication, consumer electronics, aerospace, and defence, industrial, and healthcare.
The major market areas include New England, Mideast, Great Lakes, Plains, Southeast, Southwest, Rocky Mountain, and Far West.
Explore our key highlights of the report and gain a concise overview of key findings, trends, and actionable insights that will empower your strategic decisions.
| REPORT FEATURES | DETAILS |
| Base Year | 2025 |
| Historical Period | 2019-2025 |
| Forecast Period | 2026-2035 |
| Scope of the Report |
Historical and Forecast Trends, Industry Drivers and Constraints, Historical and Forecast Market Analysis by Segment:
|
| Breakup by Products |
|
| Breakup by Application |
|
| Breakup by Region |
|
| Market Dynamics |
|
| Competitive Landscape |
|
| Companies Covered |
|
Datasheet
One User
USD 2,499
USD 2,249
tax inclusive*
Single User License
One User
USD 3,999
USD 3,599
tax inclusive*
Five User License
Five User
USD 4,999
USD 4,249
tax inclusive*
Corporate License
Unlimited Users
USD 5,999
USD 5,099
tax inclusive*
*Please note that the prices mentioned below are starting prices for each bundle type. Kindly contact our team for further details.*
Flash Bundle
Small Business Bundle
Growth Bundle
Enterprise Bundle
*Please note that the prices mentioned below are starting prices for each bundle type. Kindly contact our team for further details.*
Flash Bundle
Number of Reports: 3
20%
tax inclusive*
Small Business Bundle
Number of Reports: 5
25%
tax inclusive*
Growth Bundle
Number of Reports: 8
30%
tax inclusive*
Enterprise Bundle
Number of Reports: 10
35%
tax inclusive*
How To Order

Select License Type
Choose the right license for your needs and access rights.

Click on ‘Buy Now’
Add the report to your cart with one click and proceed to register.

Select Mode of Payment
Choose a payment option for a secure checkout. You will be redirected accordingly.
Strategic Solutions for Informed Decision-Making
Gain insights to stay ahead and seize opportunities.

Get insights & trends for a competitive edge.

Track prices with detailed trend reports.

Analyse trade data for supply chain insights.

Leverage cost reports for smart savings

Enhance supply chain with partnerships.

Connect For More Information
Our expert team of analysts will offer full support and resolve any queries regarding the report, before and after the purchase.
Our expert team of analysts will offer full support and resolve any queries regarding the report, before and after the purchase.
We employ meticulous research methods, blending advanced analytics and expert insights to deliver accurate, actionable industry intelligence, staying ahead of competitors.
Our skilled analysts offer unparalleled competitive advantage with detailed insights on current and emerging markets, ensuring your strategic edge.
We offer an in-depth yet simplified presentation of industry insights and analysis to meet your specific requirements effectively.


