

Consumer Insights
Uncover trends and behaviors shaping consumer choices today
Procurement Insights
Optimize your sourcing strategy with key market data
Industry Stats
Stay ahead with the latest trends and market analysis.
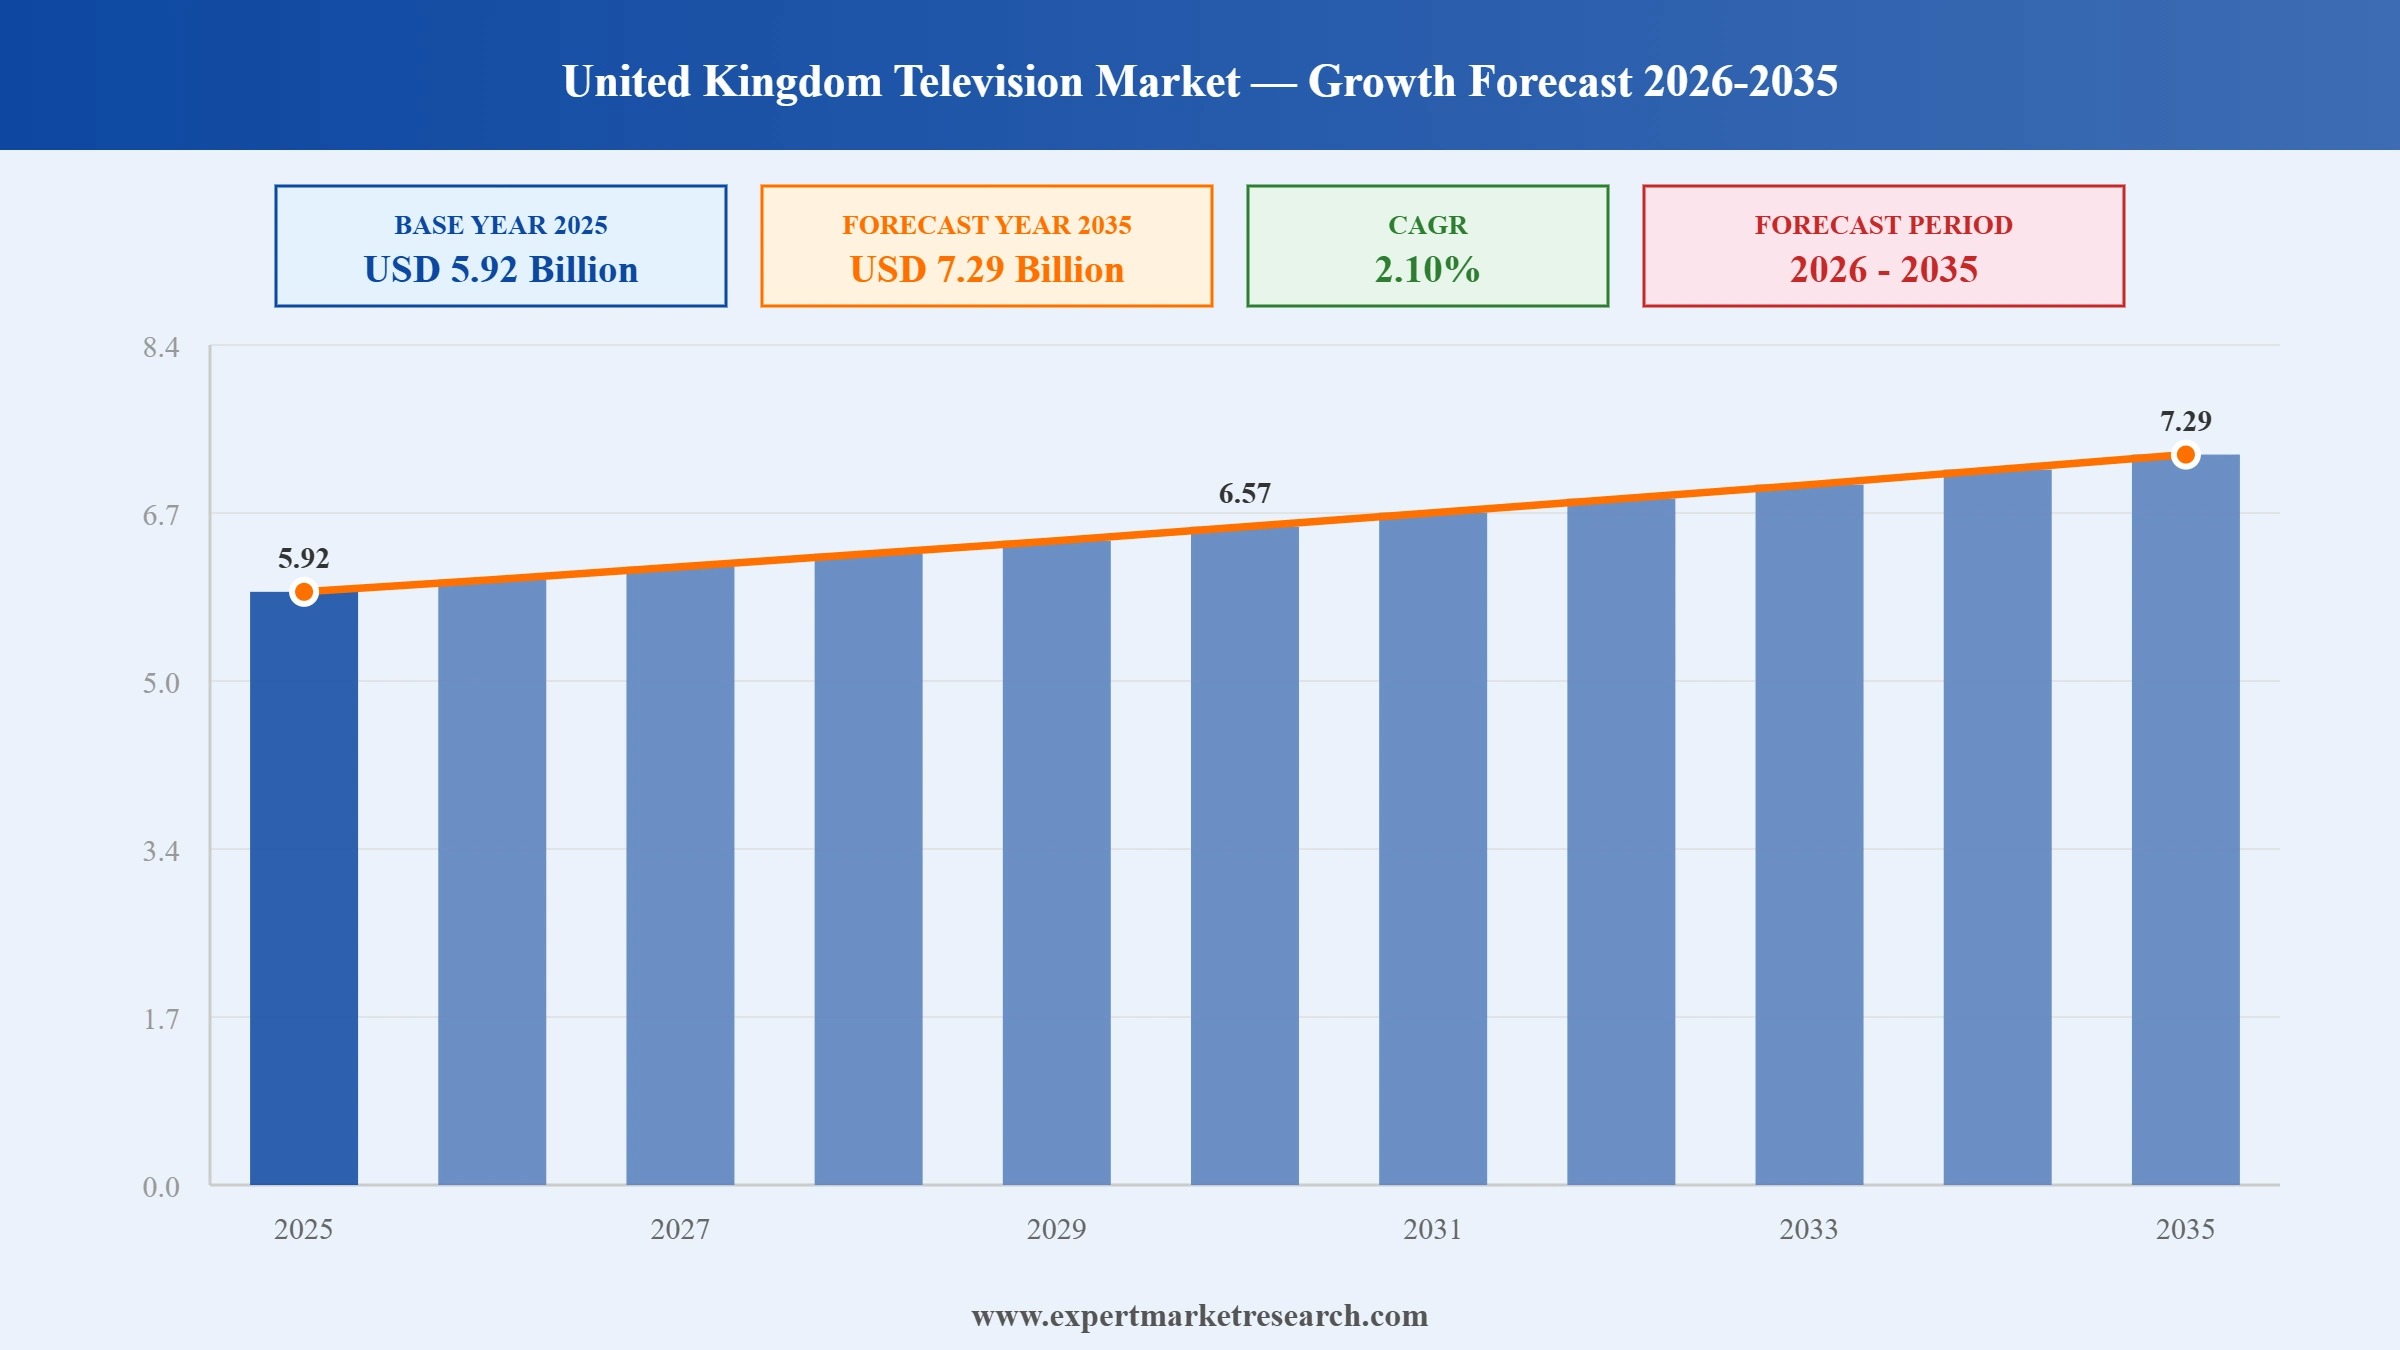
The United Kingdom television market reached a value of USD 5.92 Billion in 2025 and is projected to expand at a CAGR of around 2.10% during the forecast period of 2026-2035. Rapid Smart TV adoption driven by UK consumers' high digital connectivity and streaming service usage, the strong UK public service broadcasting ecosystem including the BBC and Channel 4, the growing integration of connected TV platforms, Freely's expansion of free-to-air broadband TV access, and the growing demand for large-screen OLED and QLED displays are driving United Kingdom television market growth. The market is expected to reach USD 7.29 Billion by 2035.
Read more about this report - REQUEST FREE SAMPLE COPY IN PDF
The United Kingdom television market is driven by strong Smart TV adoption, the UK's advanced digital infrastructure, the popularity of public service broadcasters (BBC, ITV, Channel 4, Channel 5) alongside streaming services, the growing integration of connected TV and hybrid broadcast broadband TV platforms, and the rapid upgrade cycle driven by OLED, QLED, and Mini-LED display innovations from Samsung, LG, Sony, and Hisense.
Sky and Warner Bros. Discovery reached a deal to bring HBO Max to the UK through Sky Media from January 2026, making it available alongside Netflix, Disney+, and Apple TV through Sky's pay-TV interface. The growing integration of streaming services with UK Smart TV platforms is a key driver of Smart TV adoption and upgrade demand.
The ECB and BBC extended their broadcasting partnership in May 2025, securing England Men's and Women's cricket highlights and live Hundred broadcasts through 2028 on free-to-air BBC television and Smart TVs with BBC iPlayer access.
Samsung announced 19 consecutive years as the global television market leader in March 2025 with approximately 17% global unit share. Smart TVs accounted for approximately 83% of global television sales in 2025. Samsung's 2025 UK lineup includes the QN90F Mini-LED, QN990F Neo QLED 8K, and S95F OLED series.
Freely, the UK's first free broadband TV service developed by Everyone TV, launched in April 2024, bringing BBC, ITV, Channel 4, and Channel 5 to internet-enabled Smart TVs without a subscription. Built into compatible Smart TVs from Samsung, LG, and Panasonic, Freely is driving Smart TV adoption across the UK.
Smart TV is the dominant and fastest-growing United Kingdom television market type, with over 70% of UK consumers watching on internet-enabled sets and Smart TVs representing approximately 83% of UK television sales in 2025. Samsung, LG, Sony, and Panasonic lead Smart TV innovation with OLED and QLED technologies. LCD/Plasma/LED TVs remain a significant segment through replacement demand.
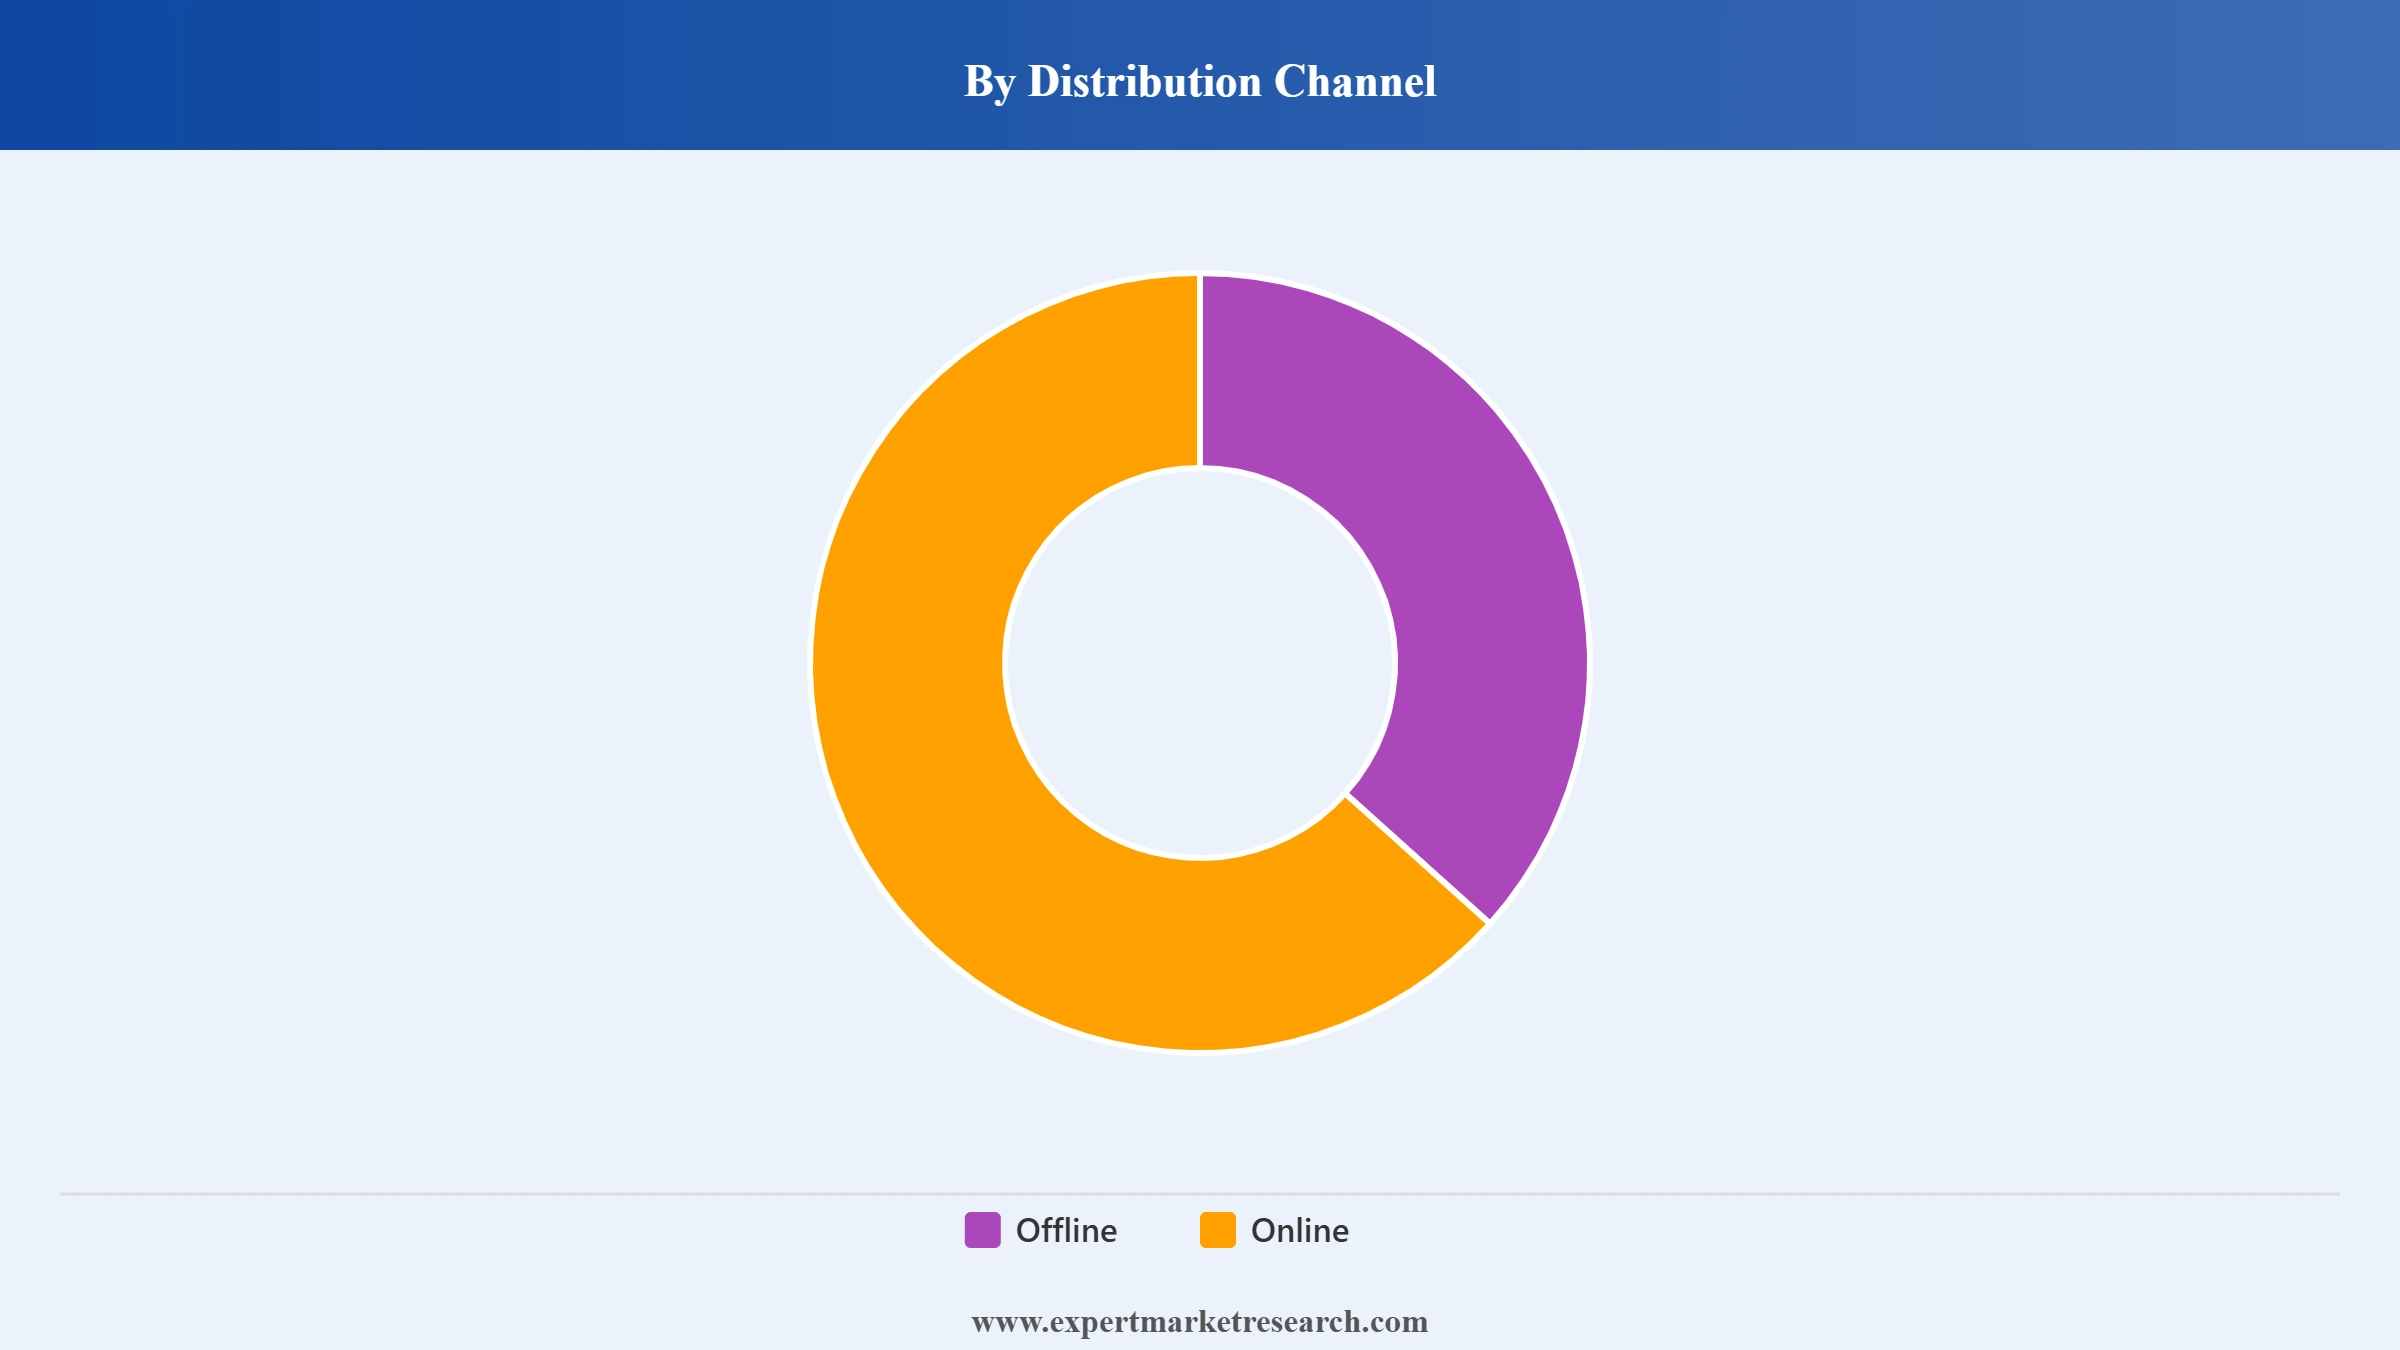
Online is the dominant United Kingdom television market distribution channel through competitive pricing and doorstep delivery via Amazon UK, Currys, John Lewis, and Argos. Offline channels through electronics retailers remain significant for consumers evaluating display quality in person.
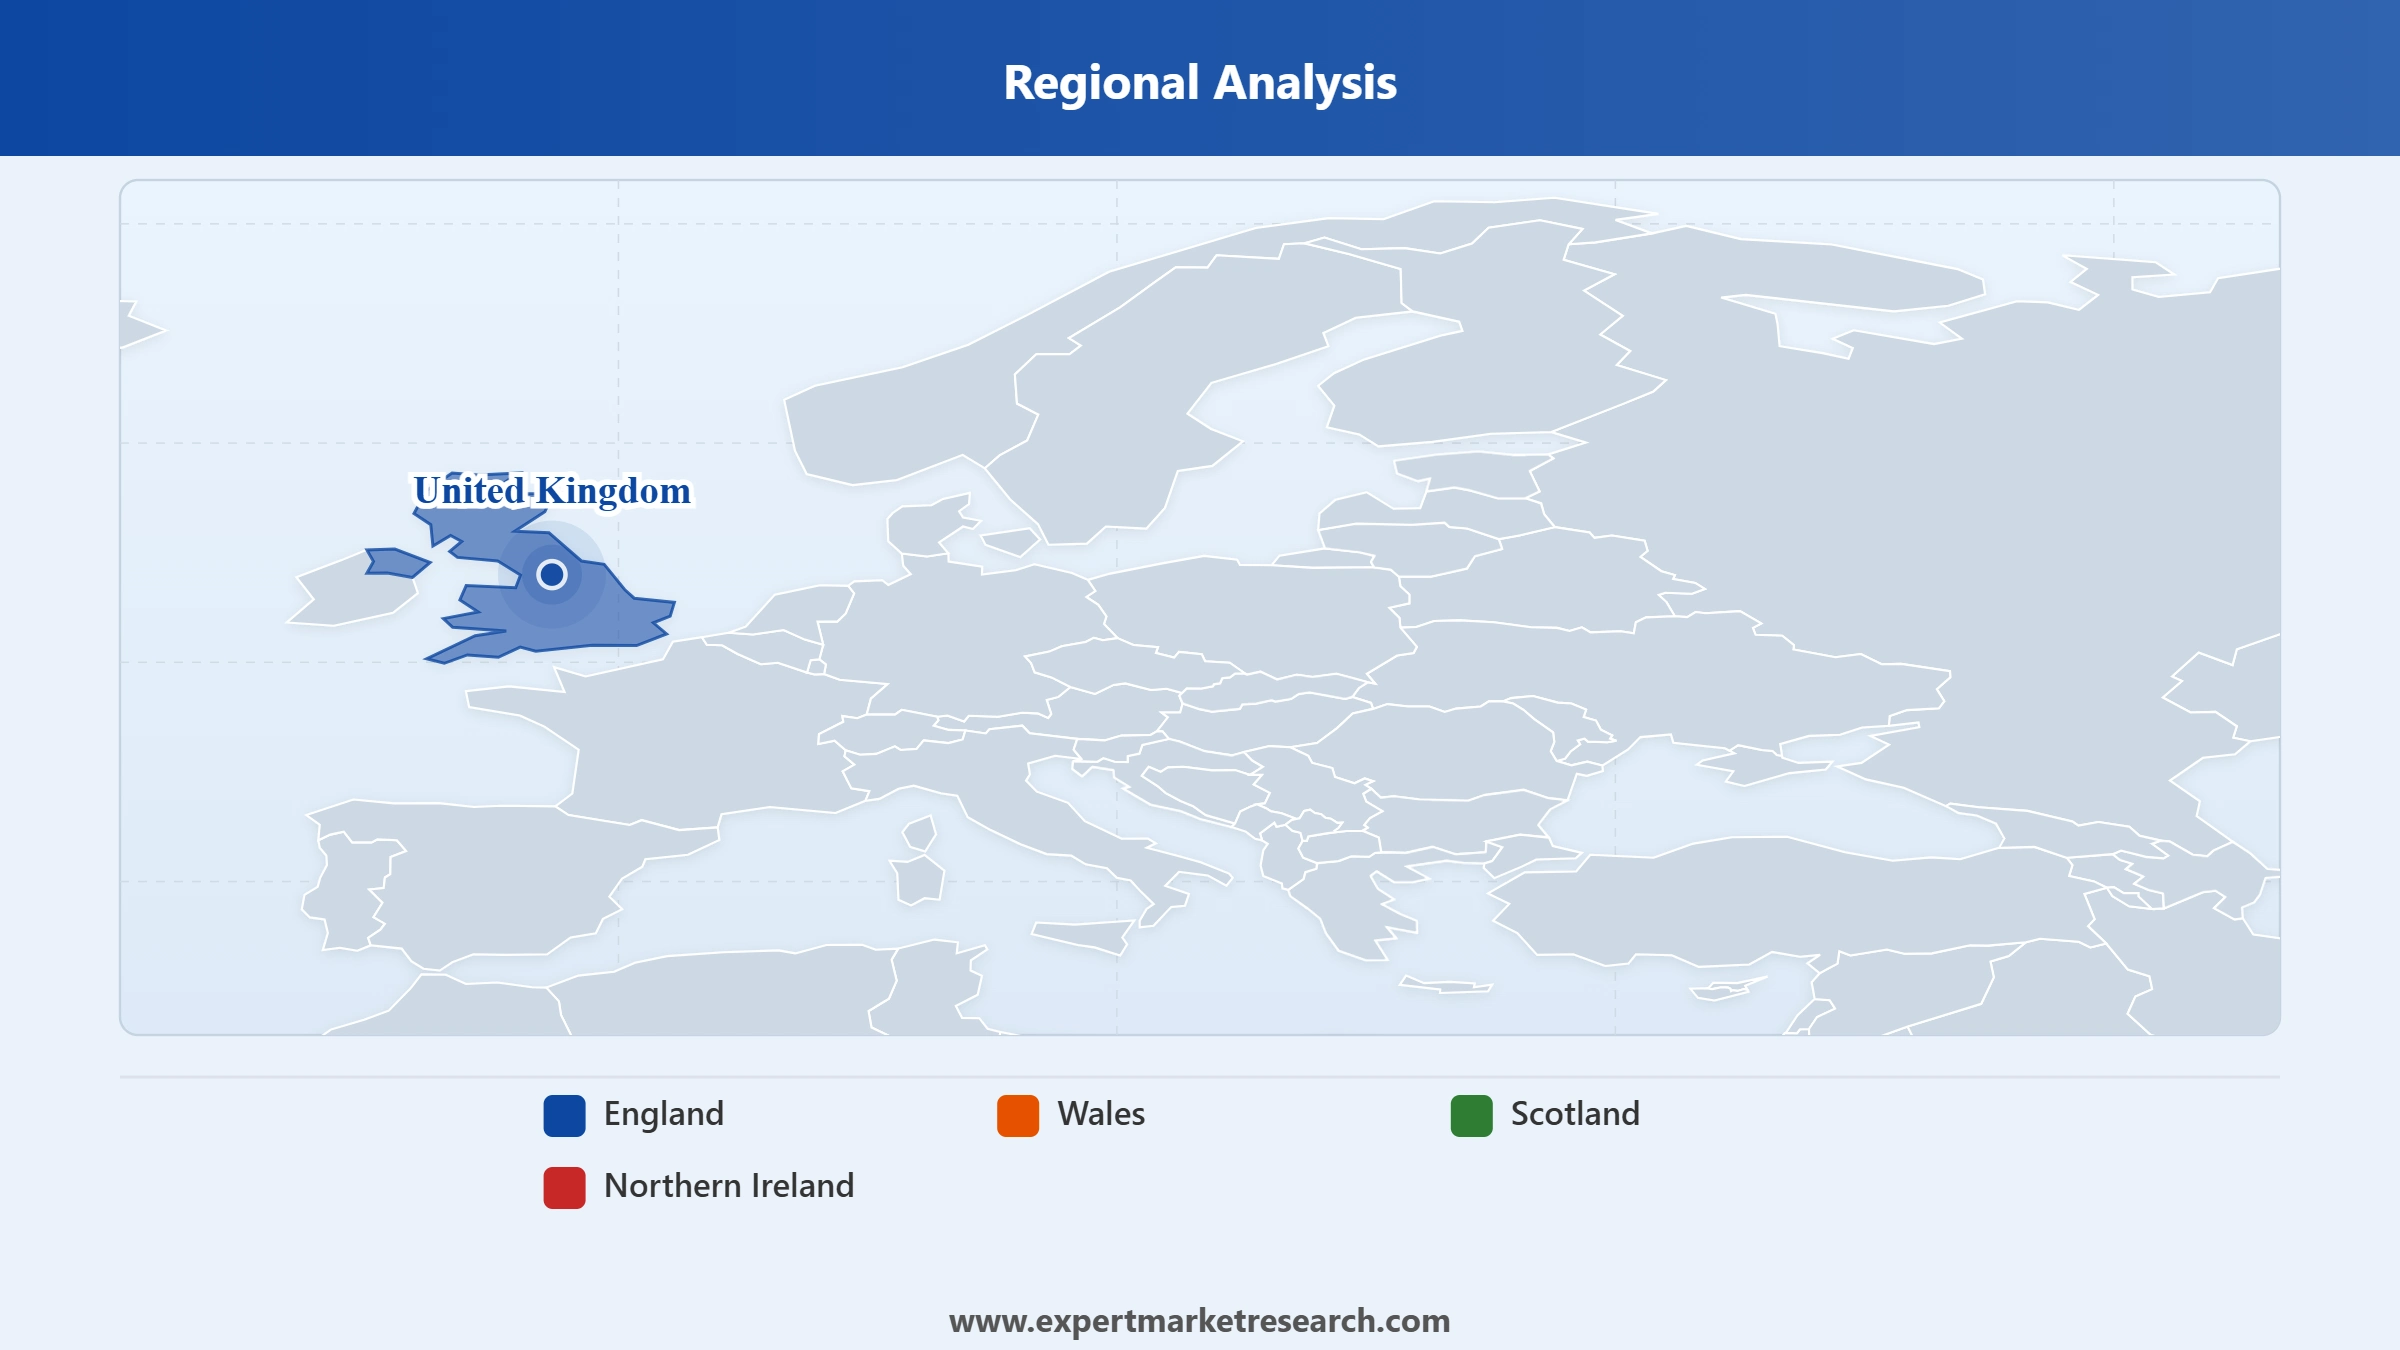
England commands the largest United Kingdom television market share by region through its population of approximately 56 million and concentration of retail infrastructure in London and major metropolitan areas. Wales, Scotland, and Northern Ireland are significant regions, with Northern Ireland also accessing Republic of Ireland broadcast content.
LCD, Plasma, and LED TVs represent a significant United Kingdom television market type through ongoing replacement demand from cost-conscious consumers. LCD and LED televisions from Hisense, TCL, Toshiba, and LG are widely available at Currys, Argos, and supermarkets. CRT and Rear-Projection TVs represent a declining legacy segment.
Offline is a significant United Kingdom television market distribution channel, with Currys PC World, John Lewis, Argos, and Richer Sounds providing physical retail touchpoints for premium OLED, QLED, and large-screen Smart TVs where in-store demonstration drives purchasing decisions.
"United Kingdom Television Market Report and Forecast 2026-2035" offers a detailed analysis of the market based on the following segments:
Market Breakup by Type
Key Insight: Smart TV is the dominant and fastest-growing United Kingdom television market type through strong UK streaming service adoption and internet-enabled television demand. LCD, Plasma, and LED TVs remain significant. CRT and Rear-Projection TVs are a declining segment.
Market Breakup by Distribution Channel
Key Insight: Online is the dominant United Kingdom television market distribution channel through growing UK e-commerce adoption and competitive online pricing. Offline channels remain significant for in-store display evaluation.
Market Breakup by Region
Key Insight: England is the dominant United Kingdom television market region through its position as the UK's largest nation by population and television retail infrastructure. Wales, Scotland, and Northern Ireland are significant regions.
Read more about this report - REQUEST FREE SAMPLE COPY IN PDF
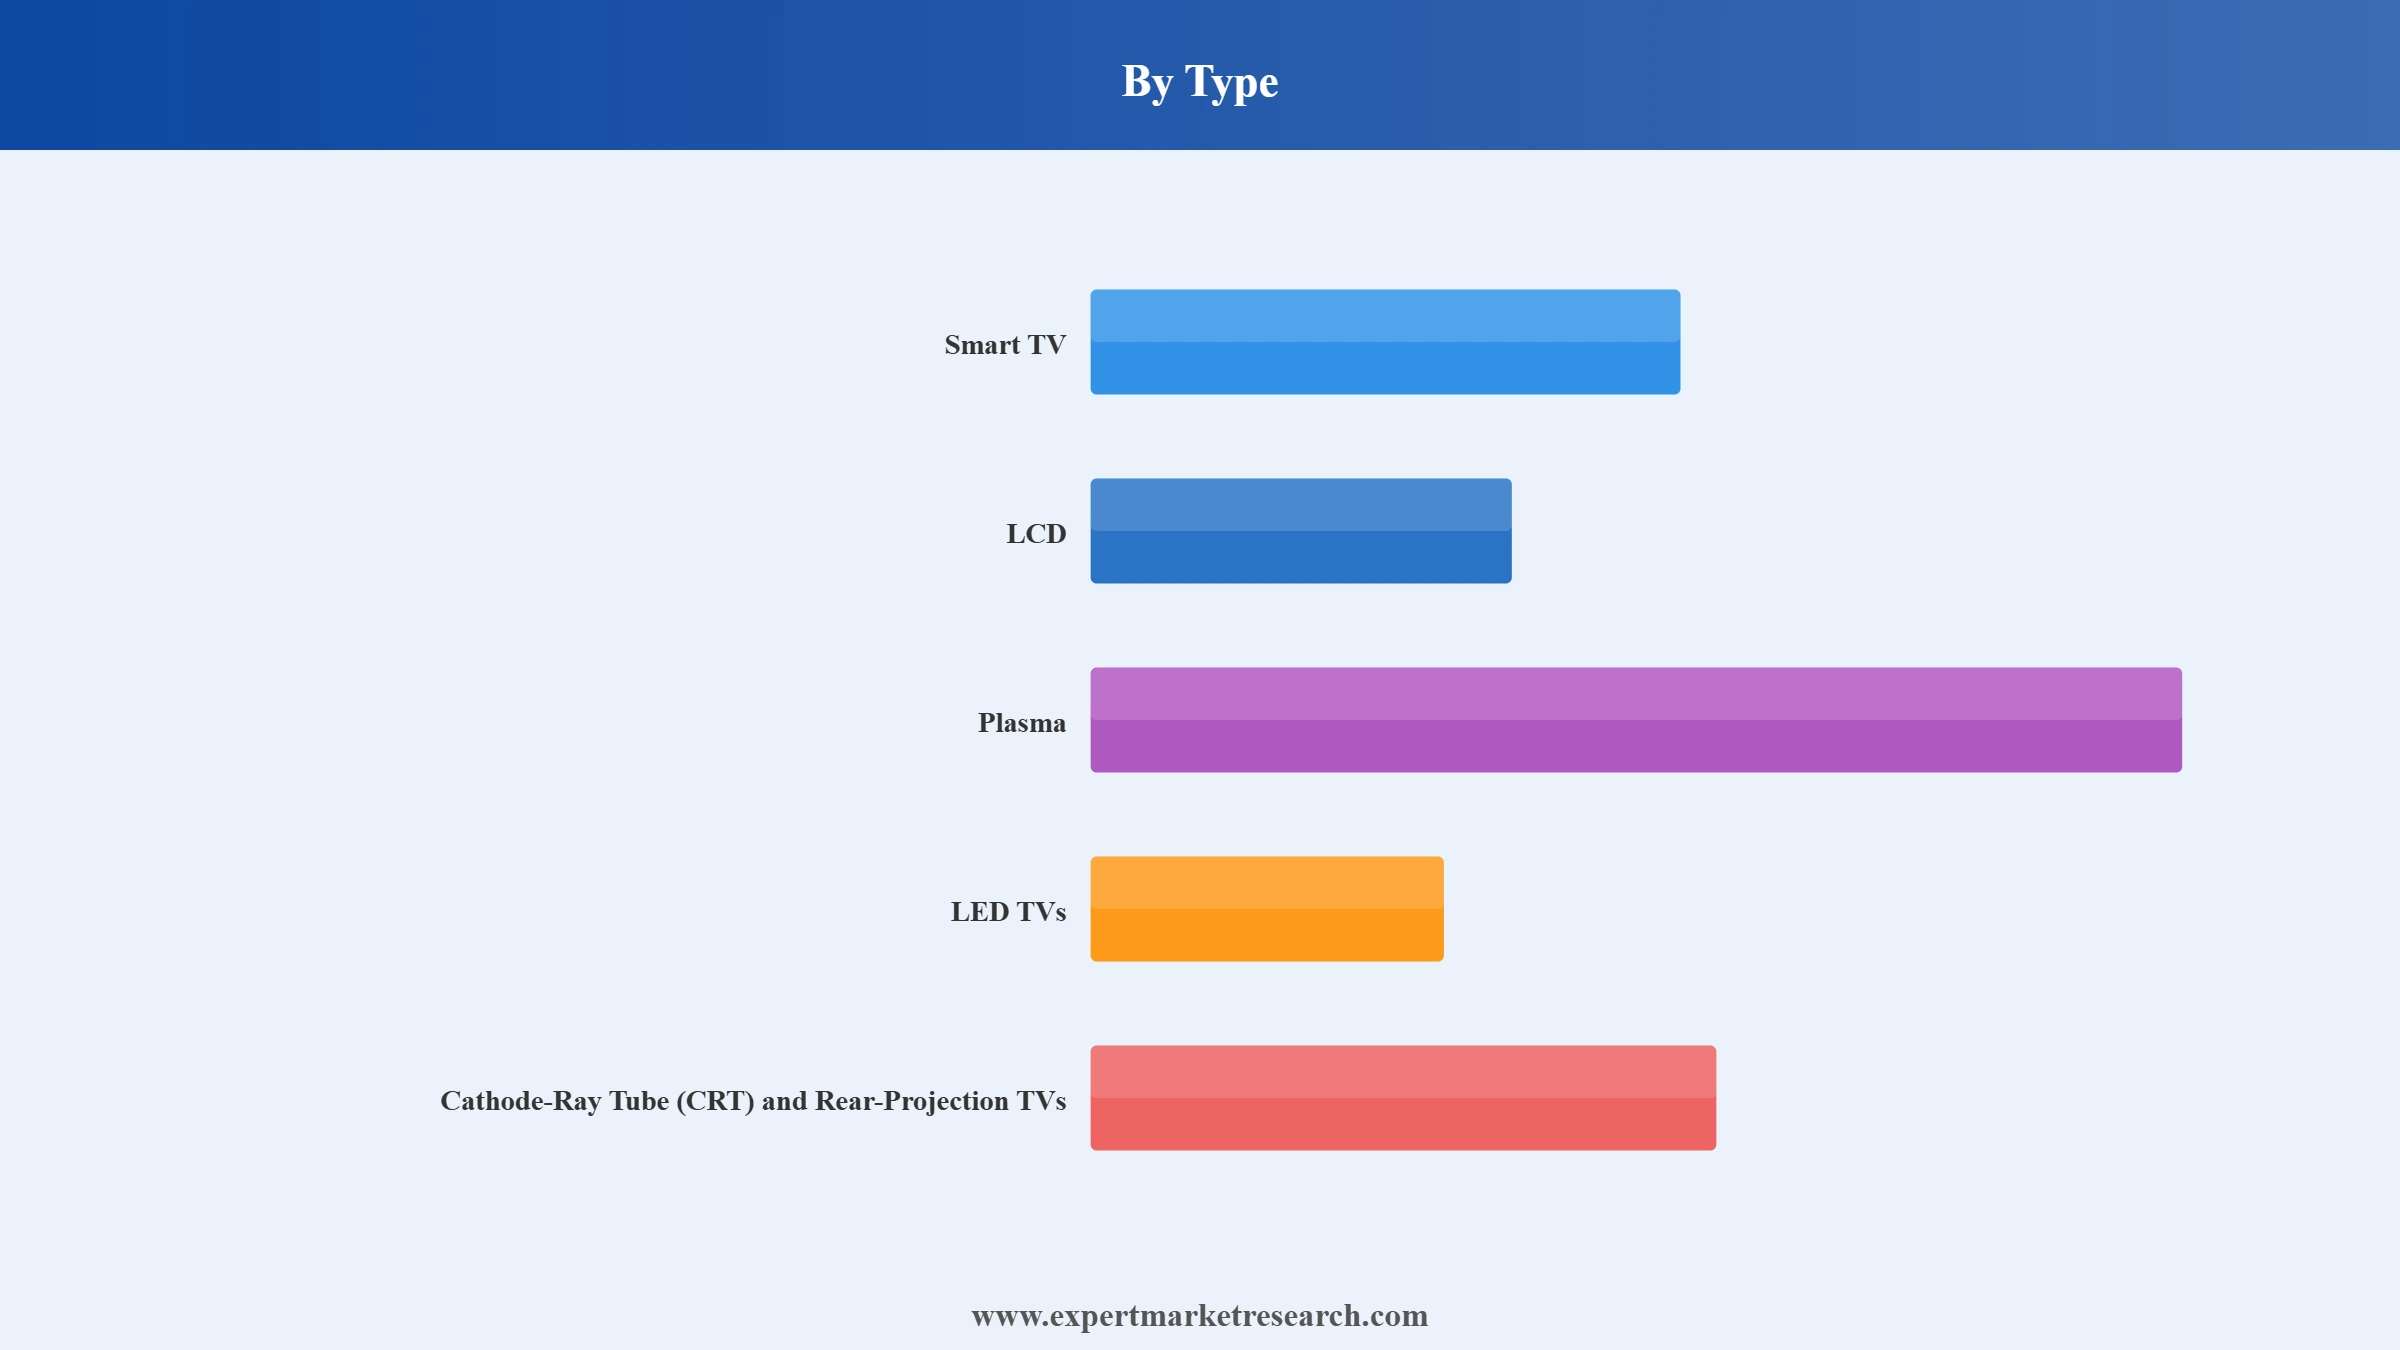
By Type, Smart TV is the dominant and fastest-growing type in the United Kingdom television market
Smart TV commands the largest United Kingdom television market share by type through strong streaming service adoption, with over 70% of UK consumers watching on internet-enabled sets and Smart TVs accounting for approximately 83% of 2025 sales. LCD/Plasma/LED TVs are a significant type through replacement demand. CRT and Rear-Projection TVs are a declining segment.
Read more about this report - REQUEST FREE SAMPLE COPY IN PDF
By Distribution Channel, Online is the dominant and fastest-growing channel in the United Kingdom television market
Online channels command the largest United Kingdom television market share by distribution channel through competitive pricing and doorstep delivery via Amazon UK, Currys, John Lewis, and Argos. Offline channels through electronics retailers remain significant for in-person display evaluation.
Read more about this report - REQUEST FREE SAMPLE COPY IN PDF
The United Kingdom is a key Europe television market driven by its advanced digital infrastructure, strong Smart TV adoption, and the BBC and Channel 4 public service broadcaster ecosystem
The United Kingdom television market is a key contributor to the Europe television market, which reached USD 31.42 Billion in 2025 and is projected to grow at a CAGR of 2.60% between 2026 and 2035, reaching almost USD 40.61 Billion by 2035. Television viewing is an increasingly connected experience across the UK, with over 70% of UK consumers watching TV shows on internet-enabled television sets. In 2022, 79% of the UK's population watched television at least once per week, with average daily viewing time of two hours and thirty-eight minutes.
The Europe television market reached USD 31.42 Billion in 2025 and is projected to grow at a CAGR of 2.60% between 2026 and 2035, reaching almost USD 40.61 Billion by 2035. The United Kingdom is the largest national contributor to the Europe television market, supported by strong Smart TV adoption and a highly connected consumer base. In 2020, 6.6 million smart TV sets were sold in Germany, while over 70% of consumers in Italy, the UK, Germany, and France watch TV shows on internet-enabled television sets.
Read more about this report - REQUEST FREE SAMPLE COPY IN PDF
The United Kingdom television market is highly competitive, with global electronics leaders, major consumer brands, and UK-focused television manufacturers competing through Smart TV platform ecosystems, display technology innovation, brand recognition, and both online and offline UK retail distribution.
Samsung Electronics Co., Ltd. is a South Korea-based global electronics leader with a dominant United Kingdom television market presence through its The Frame, QLED, Neo QLED, and OLED series, maintaining global TV market leadership for 19 consecutive years. Its Tizen platform supports Netflix, Amazon Prime Video, Disney+, and BBC iPlayer.
LG Corp. is a South Korea-based global electronics company with a significant United Kingdom television market presence through its OLED evo, QNED evo, and NanoCell series. LG leads the global OLED television market, with its webOS platform supporting Netflix, Amazon Prime Video, Disney+, and BBC iPlayer. In 2025 LG unveiled the wireless OLED evo M5 and expanded its QNED lineup to 100 inches.
Panasonic Holdings Corp. is a Japan-based global electronics company with a significant United Kingdom television market presence through its Z95B MLA OLED, MX950 Mini-LED, and LX950 LED series. Panasonic is a Freely-compatible Smart TV brand recognized for ISF-certified picture calibration in the UK premium segment.
Sony Group Corp. is a Japan-based global electronics company with a significant United Kingdom television market presence through its BRAVIA XR, BRAVIA 9, and BRAVIA 8 OLED and Mini-LED series. Sony's Google TV platform supports Netflix, Amazon Prime Video, Disney+, and BBC iPlayer, with the XR Processor delivering AI-driven picture processing.
Other key players include Toshiba Corporation, Hisense International Co., Ltd., Cello Electronics UK Ltd., KONKA Group Co. Ltd., and Hon. Hai Precision Industry Co., Ltd. (Sharp Corp.), among others.
*Please note that this is only a partial list; the complete list of key players is available in the full report. Additionally, the list of key players can be customized to better suit your needs.*
Our full report for 2026-2035 delivers the market data, competitive intelligence, and strategic analysis to capture the United Kingdom's growing television market. Reach out to our team to access the complete report or request a customised version.


Upto 15% Off
USD
$2499 $2249
$3999 $3599
$4999 $4249
$5999 $5099


*While we strive to always give you current and accurate information, the numbers depicted on the website are indicative and may differ from the actual numbers in the main report. At Expert Market Research, we aim to bring you the latest insights and trends in the market. Using our analyses and forecasts, stakeholders can understand the market dynamics, navigate challenges, and capitalize on opportunities to make data-driven strategic decisions.*
The market reached nearly USD 5.92 Billion in 2025.
The market is projected to grow at a CAGR of 2.10% between 2026 and 2035.
The market is assessed to witness a healthy growth in the forecast period to reach around USD 7.29 Billion in 2035.
The different types of televisions in the market include smart TVs, LCD, plasma, and LED TVs, and cathode-ray tube (CRT) and rear-projection TVs.
The different distribution channels of television in the market include offline and online.
The different regions in the market include England, Wales, Scotland, and Northern Ireland.
The key market players are Samsung Electronics Co. Ltd., LG Corp., Panasonic Holdings Corp., Sony Group Corp., Toshiba Corporation, Hisense International Co., Ltd., Cello Electronics UK Ltd., KONKA Group Co. Ltd., and Hon. Hai Precision Industry Co., Ltd. (Sharp Corp.), among others.
Explore our key highlights of the report and gain a concise overview of key findings, trends, and actionable insights that will empower your strategic decisions.
| REPORT FEATURES | DETAILS |
| Base Year | 2025 |
| Historical Period | 2019-2025 |
| Forecast Period | 2026-2035 |
| Scope of the Report |
Historical and Forecast Trends, Industry Drivers and Constraints, Historical and Forecast Market Analysis by Segment:
|
| Breakup by Type |
|
| Breakup by Distribution Channel |
|
| Breakup by Region |
|
| Market Dynamics |
|
| Competitive Landscape |
|
| Companies Covered |
|
Datasheet
One User
USD 2,499
USD 2,249
tax inclusive*
Single User License
One User
USD 3,999
USD 3,599
tax inclusive*
Five User License
Five User
USD 4,999
USD 4,249
tax inclusive*
Corporate License
Unlimited Users
USD 5,999
USD 5,099
tax inclusive*
*Please note that the prices mentioned below are starting prices for each bundle type. Kindly contact our team for further details.*
Flash Bundle
Small Business Bundle
Growth Bundle
Enterprise Bundle
*Please note that the prices mentioned below are starting prices for each bundle type. Kindly contact our team for further details.*
Flash Bundle
Number of Reports: 3
20%
tax inclusive*
Small Business Bundle
Number of Reports: 5
25%
tax inclusive*
Growth Bundle
Number of Reports: 8
30%
tax inclusive*
Enterprise Bundle
Number of Reports: 10
35%
tax inclusive*
How To Order

Select License Type
Choose the right license for your needs and access rights.

Click on ‘Buy Now’
Add the report to your cart with one click and proceed to register.

Select Mode of Payment
Choose a payment option for a secure checkout. You will be redirected accordingly.
Strategic Solutions for Informed Decision-Making
Gain insights to stay ahead and seize opportunities.

Get insights & trends for a competitive edge.

Track prices with detailed trend reports.

Analyse trade data for supply chain insights.

Leverage cost reports for smart savings

Enhance supply chain with partnerships.

Connect For More Information
Our expert team of analysts will offer full support and resolve any queries regarding the report, before and after the purchase.
Our expert team of analysts will offer full support and resolve any queries regarding the report, before and after the purchase.
We employ meticulous research methods, blending advanced analytics and expert insights to deliver accurate, actionable industry intelligence, staying ahead of competitors.
Our skilled analysts offer unparalleled competitive advantage with detailed insights on current and emerging markets, ensuring your strategic edge.
We offer an in-depth yet simplified presentation of industry insights and analysis to meet your specific requirements effectively.




